Downtown (Central Business District) neighborhood in Fillmore, California (CA), 93015 detailed profile
Settings
X


Business Search - 14 Million verified businesses
Area: 0.745 square miles
Population: 3,474
Population density:
| Downtown (Central Business District): | 4,663 people per square mile |
| Fillmore: | 5,923 people per square mile |

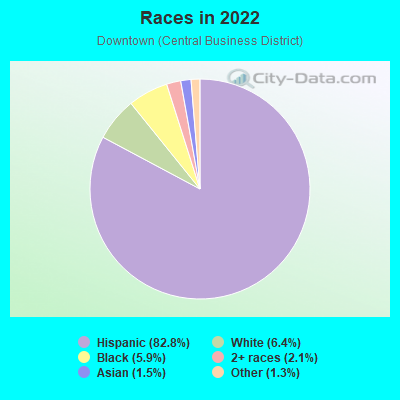
- 1,90654.0%Hispanic or Latino
- 1,29836.8%White
- 1895.4%Asian
- 772.2%Two or more races
- 561.6%American Indian
- 10.03%Black
Median household income in 2022:
| Downtown (Central Business District): | $85,903 |
| Fillmore: | $85,255 |
Distribution of median household income
![Distribution of median household income]()
- 59Less than $10,000
- 43$10,000 to $19,999
- 52$20,000 to $29,999
- 62$30,000 to $39,999
- 52$40,000 to $49,999
- 274$50,000 to $59,999
- 27$60,000 to $74,999
- 110$75,000 to $99,999
- 155$100,000 to $124,999
- 84$125,000 to $149,999
- 241$150,000 to $199,999
- 222$200,000 or more

Distribution of owner-occupied house/condo value
![Distribution of owner-occupied house/condo value]()
- 12Less than $50,000
- 90$50,000 to $99,999
- 4$100,000 to $149,999
- 10$150,000 to $199,999
- 5$200,000 to $249,999
- 183$300,000 to $399,999
- 65$400,000 to $499,999
- 264$500,000 to $749,999
- 55$750,000 to $999,999
- 114$1,000,000 or more

Distribution of rent paid by renters
![Distribution of rent paid by renters]()
- 1$200 to $299
- 114$500 to $599
- 2$700 to $799
- 3$800 to $899
- 1$900 to $999
- 41$1,000 to $1,249
- 25$1,250 to $1,499
- 208$1,500 to $1,999
- 232$2,000 or more

Median rent in 2022:
| Downtown (Central Business District): | $1,836 |
| Fillmore: | $1,721 |
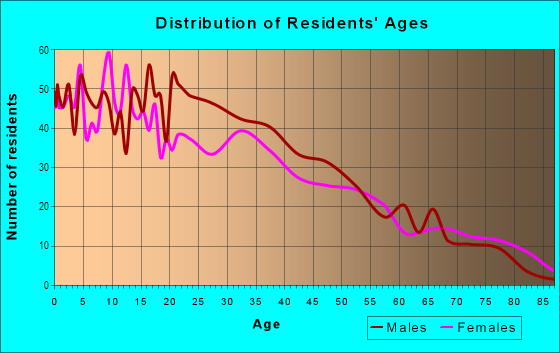
| Males: | 1,796 |
| Females: | 1,677 |
Males:
| This neighborhood: | 46.5 years |
| Whole city: | 35.3 years |
| This neighborhood: | 29.6 years |
| Whole city: | 34.6 years |
Average household size:
| Downtown (Central Business District): | 2.7 people |
| Fillmore: | 3.3 people |
Percentage of family households:
| Downtown (Central Business District): | 58.5% |
| Fillmore: | 60.4% |
| Here: | 55.0% |
| Fillmore: | 53.1% |
Percentage of married-couple families with children (among all households):
| Downtown (Central Business District): | 30.0% |
| Fillmore: | 22.7% |
Percentage of single-mother households (among all households):
| Downtown (Central Business District): | 4.8% |
| Fillmore: | 5.9% |
Percentage of never married males 15 years old and over:
Percentage of never married females 15 years old and over:
| Downtown (Central Business District): | 15.5% |
| Fillmore: | 20.0% |
Percentage of never married females 15 years old and over:
| Downtown (Central Business District): | 12.2% |
| city: | 17.2% |
Percentage of people that speak English not well or not at all:
| Downtown (Central Business District): | 2.3% |
| Fillmore: | 9.6% |
Percentage of people born in this state:
Percentage of people born in another U.S. state:
Percentage of native residents but born outside the U.S.:
Percentage of foreign born residents:
| Here: | 72.6% |
| Fillmore: | 73.9% |
Percentage of people born in another U.S. state:
| Downtown (Central Business District): | 8.2% |
| Fillmore: | 6.1% |
Percentage of native residents but born outside the U.S.:
| Here: | 0.6% |
| city: | 0.8% |
Percentage of foreign born residents:
| Here: | 18.7% |
| Fillmore: | 19.2% |
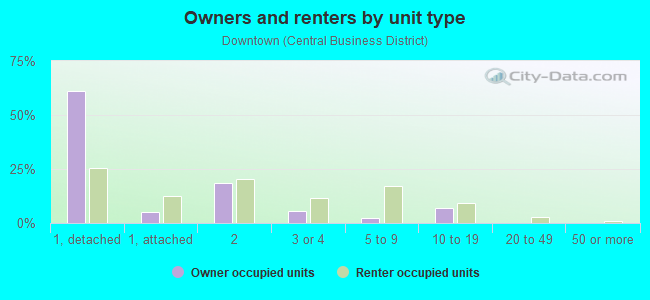
Owner-occupied
Renter-occupied

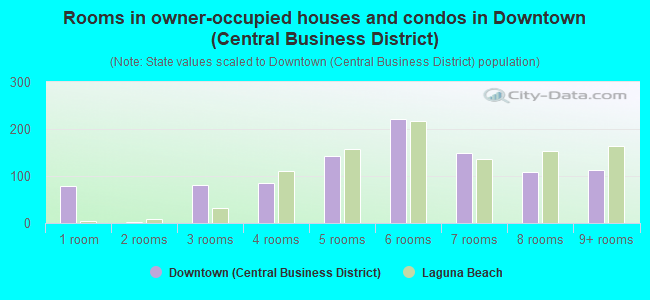
- Rooms in owner-occupied houses and condos in Downtown <
> - 01 room
- 02 rooms
- 03 rooms
- 1054 rooms
- 1035 rooms
- 1946 rooms
- 847 rooms
- 728 rooms
- 1209+ rooms
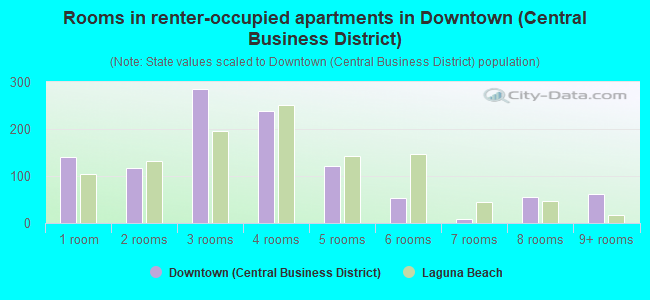
- Rooms in renter-occupied apartments in Downtown <
> - 31 room
- 12 rooms
- 33 rooms
- 684 rooms
- 2215 rooms
- 3156 rooms
- 567 rooms
- 1138 rooms
- 09+ rooms
Owner-occupied
Renter-occupied
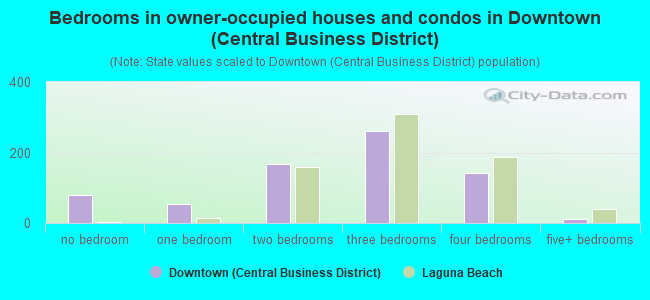
- Bedrooms in owner-occupied houses and condos in Downtown <
> - 0no bedroom
- 01 bedroom
- 912 bedrooms
- 3213 bedrooms
- 2084 bedrooms
- 555+ bedrooms
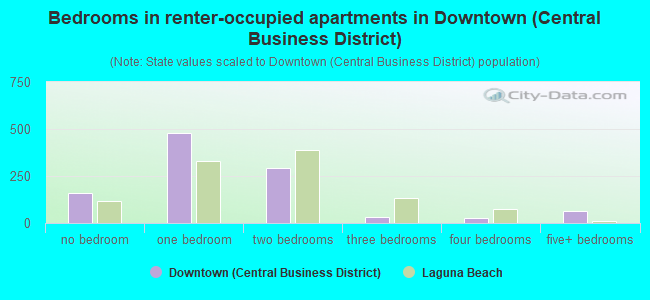
- Bedrooms in renter-occupied apartments in Downtown <
> - 4no bedroom
- 21 bedroom
- 842 bedrooms
- 3453 bedrooms
- 2324 bedrooms
- 05+ bedrooms
Average number of cars or other vehicles available in houses/condos:
Average number of cars or other vehicles available in apartments:
| This neighborhood: | 2.5 |
| Fillmore: | 2.5 |
Average number of cars or other vehicles available in apartments:
| Here: | 1.7 |
| city: | 1.7 |
Percentage of units with a mortgage:
| Downtown (Central Business District): | 51.9% |
| Fillmore: | 64.0% |
Average estimated value of detached houses in 2022 (85.7% of all units):
| Downtown (Central Business District): | $572,785 |
| California: | $988,808 |
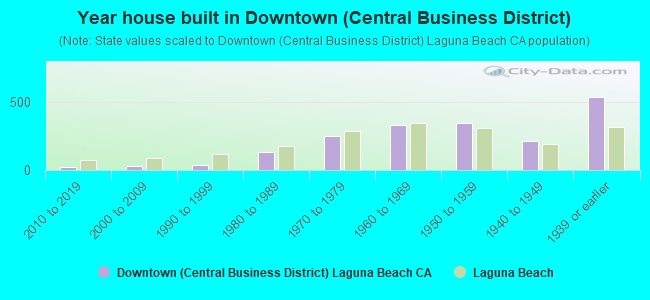
- Year house built in Downtown <
> - 12020 or later
- 22010 to 2019
- 1172000 to 2009
- 301990 to 1999
- 2141980 to 1989
- 1511970 to 1979
- 2381960 to 1969
- 3771950 to 1959
- 31940 to 1949
- 2601939 or earlier
City-data.com crime index for city in 2020 (higher means more crime):
| City: | 105.8 |
| U.S. average: | 219.5 |
Travel time to work (commute)
![Travel time to work (commute)]()
- 165Less than 5 minutes
- 1155 to 9 minutes
- 24510 to 14 minutes
- 12015 to 19 minutes
- 13120 to 24 minutes
- 12925 to 29 minutes
- 28630 to 34 minutes
- 7535 to 39 minutes
- 10940 to 44 minutes
- 53845 to 59 minutes
- 16160 to 89 minutes
- 11690 or more minutes

Means of transportation to work
![Means of transportation to work]()
- 67.3%1,172Drove a car alone
- 18.2%316Carpooled
- 5.6%97Bus
- 1.1%19Bicycle
- 5.2%91Walked
- 0.1%1Other means
- 7.6%132Worked at home

Time leaving home to go to work
![Time leaving home to go to work]()
- 13112:00 a.m. to 4:59 a.m.
- 355:00 a.m. to 5:29 a.m.
- 2855:30 a.m. to 5:59 a.m.
- 576:00 a.m. to 6:29 a.m.
- 1596:30 a.m. to 6:59 a.m.
- 2407:00 a.m. to 7:29 a.m.
- 2037:30 a.m. to 7:59 a.m.
- 1768:00 a.m. to 8:29 a.m.
- 548:30 a.m. to 8:59 a.m.
- 1599:00 a.m. to 9:59 a.m.
- 9811:00 a.m. to 11:59 a.m.
- 15112:00 p.m. to 3:59 p.m.
- 1684:00 p.m. to 11:59 p.m.

Occupations of males:
- Percentage of males in management occupations (except farmers):
Here: 23.7% city: 10.4%
- Percentage of males in architecture and engineering occupations:
Here: 3.3% city: 3.2%
- Percentage of males in service occupations:
Here: 20.6% city: 18.9%
- Percentage of males in sales and office occupations:
Here: 8.0% city: 14.8%
- Percentage of males in construction, extraction, and maintenance occupations:
Here: 6.0% city: 8.0%
- Percentage of males in production occupations:
Here: 10.5% city: 8.9%
- Percentage of males in transportation occupations:
Here: 2.5% city: 3.2%
- Percentage of males in material moving occupations:
Here: 5.2% city: 6.1%
Occupations of females:
- Percentage of females in management occupations (except farmers):
Here: 7.8% city: 6.8%
- Percentage of females in architecture and engineering occupations:
Here: 5.6% city: 2.5%
- Percentage of females in community and social services occupations:
Here: 8.8% city: 5.0%
- Percentage of females in education, training, and library occupations:
Here: 7.1% city: 3.9%
- Percentage of females in healthcare practitioners and technical occupations:
Here: 41.3% city: 11.6%
- Percentage of females in service occupations:
Here: 5.7% city: 21.3%
- Percentage of females in sales and office occupations:
Here: 17.6% city: 29.7%
- Percentage of females in farming, fishing, and forestry occupations:
Here: 2.9% city: 4.5%
- Percentage of females in production occupations:
Here: 8.7% city: 3.4%
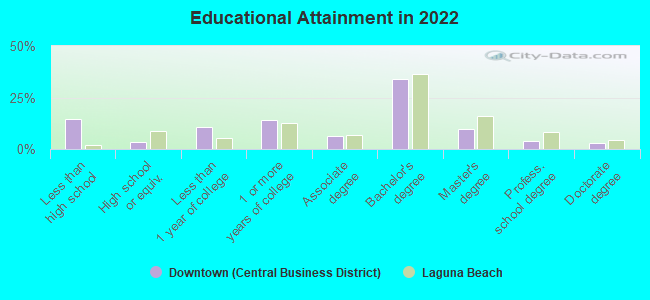
Education in this neighborhood (subdivision or community):
- Percentage of people 3 years and older in K-12 schools:
Downtown (Central Business District): 16.2% Fillmore: 20.8%
- Percentage of people 3 years and older in undergraduate colleges:
Downtown (Central Business District): 4.1% Fillmore: 8.0%
- Percentage of people 3 years and older in grad. or professional schools:
Downtown (Central Business District): 0.0% Fillmore: 0.0%
- Percentage of students K-12 enrolled in private schools:
Downtown (Central Business District): 3.6% Fillmore: 10.8%
Percentage of population below poverty level:
| Downtown (Central Business District): | 8.1% |
| Fillmore: | 6.8% |
Median year owner moved in (as recorded in 2022):
Median year renter moved in (as recorded in 2022):
| Downtown (Central Business District): | 1998 |
| Fillmore: | 2006 |
Median year renter moved in (as recorded in 2022):
| Downtown (Central Business District): | 2010 |
| Fillmore: | 2013 |
Percentage of married-couple families with both working:
| Downtown (Central Business District): | 92.3% |
| Fillmore: | 59.6% |
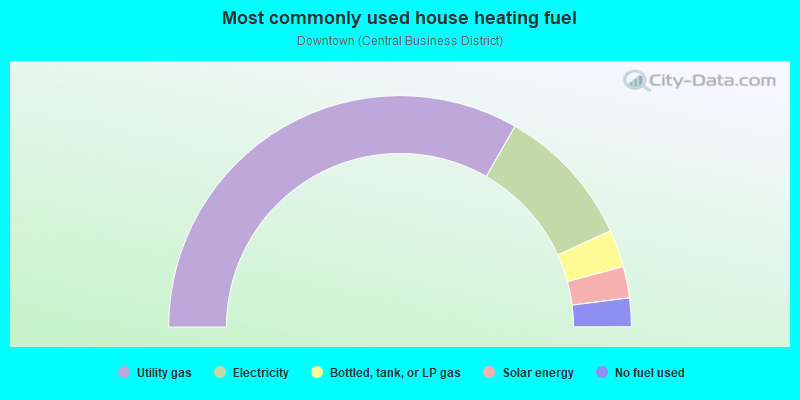
- 63.9%Utility gas
- 13.9%No fuel used
- 13.3%Electricity
- 8.0%Solar energy
- 0.9%Bottled, tank, or LP gas
Highways in this neighborhood:
State Rte 126 (W Telegraph Rd)
Length: 1.49 miles
Direction: E-W
Address range: 100 to 547
Direction: E-W
Address range: 100 to 547
W Ventura St (State Rte 126, W Telegraph Rd)
Length: 0.50 miles
Direction: E-W
Address range: 548 to 799
Direction: E-W
Address range: 548 to 799
Roads and streets:
Sespe Ave
Length: 1.42 miles
Directions: E-W, SE-NW, SW-NE
Address range: 100 to 743
Directions: E-W, SE-NW, SW-NE
Address range: 100 to 743
2nd St
Length: 1.24 miles
Directions: E-W, N-S, SW-NE
Address range: 300 to 999
Directions: E-W, N-S, SW-NE
Address range: 300 to 999
3rd St
Length: 1.08 miles
Direction: E-W
Address range: 147 to 825
Direction: E-W
Address range: 147 to 825
1st St
Length: 1.04 miles
Direction: E-W
Address range: 300 to 799
Direction: E-W
Address range: 300 to 799
Santa Clara Ave (Santa Clara St)
Length: 0.99 miles
Directions: E-W, N-S, SE-NW, SW-NE
Address range: 134 to 699
Directions: E-W, N-S, SE-NW, SW-NE
Address range: 134 to 699
A St
Length: 0.84 miles
Directions: N-S, SE-NW
Address range: 200 to 399
Directions: N-S, SE-NW
Address range: 200 to 399
Central Ave
Length: 0.83 miles
Directions: N-S, SE-NW, SW-NE
Address range: 180 to 725
Directions: N-S, SE-NW, SW-NE
Address range: 180 to 725
Saratoga St
Length: 0.71 miles
Directions: N-S, SE-NW
Address range: 200 to 699
Directions: N-S, SE-NW
Address range: 200 to 699
Mountain View St
Length: 0.69 miles
Direction: N-S
Address range: 200 to 763
Direction: N-S
Address range: 200 to 763
Clay St
Length: 0.68 miles
Direction: N-S
Address range: 200 to 699
Direction: N-S
Address range: 200 to 699
Main St
Length: 0.65 miles
Direction: E-W
Address range: 100 to 599
Direction: E-W
Address range: 100 to 599
Fillmore St
Length: 0.55 miles
Direction: N-S
Address range: 200 to 699
Direction: N-S
Address range: 200 to 699
Old Telegraph Rd
Length: 0.42 miles
Direction: SE-NW
Address range: 401 to 523
Direction: SE-NW
Address range: 401 to 523
Yucca Dr
Length: 0.27 miles
Directions: N-S, SE-NW
Address range: 600 to 699
Directions: N-S, SE-NW
Address range: 600 to 699
Cook Dr
Length: 0.26 miles
Directions: E-W, N-S, SE-NW, SW-NE
Address range: 100 to 498
Directions: E-W, N-S, SE-NW, SW-NE
Address range: 100 to 498
Market St
Length: 0.22 miles
Directions: N-S, SE-NW, SW-NE
Address range: 300 to 499
Directions: N-S, SE-NW, SW-NE
Address range: 300 to 499
Bard St
Length: 0.22 miles
Direction: E-W
Address range: 300 to 500
Direction: E-W
Address range: 300 to 500
Casner Way
Length: 0.22 miles
Direction: E-W
Address range: 100 to 299
Direction: E-W
Address range: 100 to 299
Kensington Dr
Length: 0.18 miles
Direction: E-W
Address range: 500 to 599
Direction: E-W
Address range: 500 to 599
Island View St
Length: 0.17 miles
Direction: N-S
Address range: 600 to 708
Direction: N-S
Address range: 600 to 708
Pine Grove Ave (Orange Grove Ave)
Length: 0.16 miles
Direction: N-S
Address range: 200 to 499
Direction: N-S
Address range: 200 to 499
Fernglen Cir
Length: 0.15 miles
Directions: E-W, N-S, SE-NW, SW-NE
Address range: 600 to 699
Directions: E-W, N-S, SE-NW, SW-NE
Address range: 600 to 699
Lora Ln
Length: 0.14 miles
Direction: E-W
Address range: 100 to 299
Direction: E-W
Address range: 100 to 299
Manzanita Dr
Length: 0.14 miles
Directions: E-W, N-S, SW-NE
Address range: 600 to 699
Directions: E-W, N-S, SW-NE
Address range: 600 to 699
Orchard St
Length: 0.14 miles
Direction: N-S
Address range: 400 to 599
Direction: N-S
Address range: 400 to 599
Hume Dr
Length: 0.13 miles
Directions: E-W, N-S, SE-NW, SW-NE
Address range: 400 to 499
Directions: E-W, N-S, SE-NW, SW-NE
Address range: 400 to 499
Chaparral St
Length: 0.13 miles
Direction: N-S
Address range: 600 to 699
Direction: N-S
Address range: 600 to 699
Shiells Dr
Length: 0.13 miles
Direction: N-S
Address range: 600 to 699
Direction: N-S
Address range: 600 to 699
B St
Length: 0.12 miles
Direction: N-S
Direction: N-S
Walker Ln
Length: 0.11 miles
Directions: E-W, N-S
Address range: 501 to 799
Directions: E-W, N-S
Address range: 501 to 799
Olive St
Length: 0.10 miles
Direction: N-S
Address range: 200 to 299
Direction: N-S
Address range: 200 to 299
Palm St
Length: 0.10 miles
Direction: N-S
Address range: 200 to 299
Direction: N-S
Address range: 200 to 299
Boulder St
Length: 0.08 miles
Direction: N-S
Address range: 600 to 699
Direction: N-S
Address range: 600 to 699
Elkins Ln
Length: 0.08 miles
Direction: N-S
Address range: 600 to 699
Direction: N-S
Address range: 600 to 699
Via Rodeo
Length: 0.06 miles
Direction: N-S
Address range: 500 to 699
Direction: N-S
Address range: 500 to 699
Stephens St
Length: 0.03 miles
Direction: N-S
Address range: 500 to 599
Direction: N-S
Address range: 500 to 599
Railroad features:
Union Pacific RR
Length: 1.42 miles
Directions: E-W, SE-NW
Directions: E-W, SE-NW
Other features:
Pole Crk
Length: 0.63 miles
Directions: N-S, SE-NW
Directions: N-S, SE-NW