Downtown Business District neighborhood in Arlington, Texas (TX), 76010, 76011 detailed profile
Settings
X


Business Search - 14 Million verified businesses
Area: 0.245 square miles
Population: 1,930
Population density:
| Downtown Business District: | 7,871 people per square mile |
| Arlington: | 4,118 people per square mile |

- 67131.8%White
- 51924.6%Asian
- 47422.4%Hispanic or Latino
- 35216.7%Black
- 683.2%Two or more races
- 200.9%American Indian
- 90.4%Some other race

Median household income in 2022:
| Downtown Business District: | $27,940 |
| Arlington: | $70,433 |
Distribution of median household income
![Distribution of median household income]()
- 137Less than $10,000
- 85$10,000 to $19,999
- 96$20,000 to $29,999
- 70$30,000 to $39,999
- 41$40,000 to $49,999
- 29$50,000 to $59,999
- 45$60,000 to $74,999
- 20$75,000 to $99,999
- 23$100,000 to $124,999
- 25$125,000 to $149,999
- 13$200,000 or more

Distribution of owner-occupied house/condo value
![Distribution of owner-occupied house/condo value]()
- 29Less than $50,000
- 18$50,000 to $99,999
- 28$100,000 to $149,999
- 34$150,000 to $199,999
- 19$200,000 to $249,999
- 11$250,000 to $299,999
- 41$300,000 to $399,999
- 5$500,000 to $749,999

Distribution of rent paid by renters
![Distribution of rent paid by renters]()
- 5$200 to $299
- 14$300 to $399
- 34$400 to $499
- 28$500 to $599
- 31$600 to $699
- 64$700 to $799
- 79$800 to $899
- 74$900 to $999
- 89$1,000 to $1,249
- 52$1,250 to $1,499
- 59$1,500 to $1,999
- 11$2,000 or more

Median rent in 2022:
| Downtown Business District: | $931 |
| Arlington: | $1,162 |
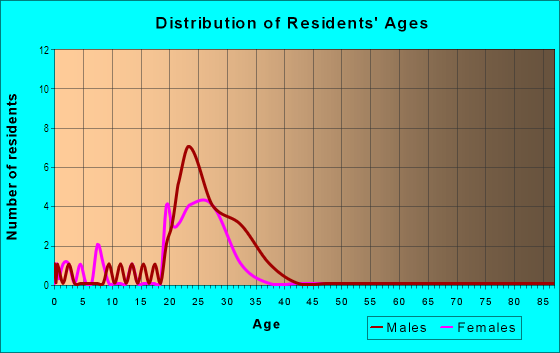
| Males: | 983 |
| Females: | 947 |
Males:
| This neighborhood: | 25.7 years |
| Whole city: | 32.2 years |
| This neighborhood: | 24.9 years |
| Whole city: | 33.4 years |
Average household size:
| Downtown Business District: | 2.4 people |
| Arlington: | 2.8 people |
Percentage of family households:
| Downtown Business District: | 24.5% |
| Arlington: | 49.5% |
| Here: | 15.4% |
| Arlington: | 43.9% |
Percentage of married-couple families with children (among all households):
| Downtown Business District: | 14.5% |
| Arlington: | 23.1% |
Percentage of single-mother households (among all households):
| Downtown Business District: | 6.6% |
| Arlington: | 8.5% |
Percentage of never married males 15 years old and over:
Percentage of never married females 15 years old and over:
| Downtown Business District: | 41.0% |
| Arlington: | 20.6% |
Percentage of never married females 15 years old and over:
| Downtown Business District: | 35.8% |
| city: | 19.7% |
Percentage of people that speak English not well or not at all:
| Downtown Business District: | 4.0% |
| Arlington: | 6.6% |
Percentage of people born in this state:
Percentage of people born in another U.S. state:
Percentage of native residents but born outside the U.S.:
Percentage of foreign born residents:
| Here: | 43.0% |
| Arlington: | 50.9% |
Percentage of people born in another U.S. state:
| Downtown Business District: | 25.1% |
| Arlington: | 25.9% |
Percentage of native residents but born outside the U.S.:
| Here: | 2.4% |
| city: | 1.9% |
Percentage of foreign born residents:
| Here: | 29.5% |
| Arlington: | 21.3% |

Owner-occupied
Renter-occupied


- Rooms in owner-occupied houses and condos in Downtown Business District
- 81 room
- 02 rooms
- 93 rooms
- 224 rooms
- 325 rooms
- 386 rooms
- 107 rooms
- 48 rooms
- 109+ rooms

- Rooms in renter-occupied apartments in Downtown Business District
- 441 room
- 472 rooms
- 1463 rooms
- 1154 rooms
- 605 rooms
- 296 rooms
- 277 rooms
- 218 rooms
- 79+ rooms
Owner-occupied
Renter-occupied

- Bedrooms in owner-occupied houses and condos in Downtown Business District
- 8no bedroom
- 171 bedroom
- 362 bedrooms
- 353 bedrooms
- 274 bedrooms
- 45+ bedrooms

- Bedrooms in renter-occupied apartments in Downtown Business District
- 47no bedroom
- 2111 bedroom
- 1192 bedrooms
- 683 bedrooms
- 284 bedrooms
- 85+ bedrooms
Average number of cars or other vehicles available in houses/condos:
Average number of cars or other vehicles available in apartments:
| This neighborhood: | 3.3 |
| Arlington: | 2.2 |
Average number of cars or other vehicles available in apartments:
| Here: | 1.1 |
| city: | 1.4 |
Percentage of units with a mortgage:
| Downtown Business District: | 25.0% |
| Arlington: | 60.9% |

- Year house built in Downtown Business District
- 652020 or later
- 1232010 to 2019
- 1212000 to 2009
- 401990 to 1999
- 571980 to 1989
- 661970 to 1979
- 811960 to 1969
- 681950 to 1959
- 331940 to 1949
- 431939 or earlier

City-data.com crime index for city in 2020 (higher means more crime):
| City: | 285.6 |
| U.S. average: | 219.5 |
Travel time to work (commute)
![Travel time to work (commute)]()
- 22Less than 5 minutes
- 815 to 9 minutes
- 11010 to 14 minutes
- 9215 to 19 minutes
- 9120 to 24 minutes
- 2825 to 29 minutes
- 6830 to 34 minutes
- 635 to 39 minutes
- 840 to 44 minutes
- 2045 to 59 minutes
- 1360 to 89 minutes
- 1190 or more minutes

Means of transportation to work
![Means of transportation to work]()
- 48.0%431Drove a car alone
- 8.5%76Carpooled
- 0.8%7Bicycle
- 28.9%259Walked
- 3.1%28Other means
- 16.2%145Worked at home

Time leaving home to go to work
![Time leaving home to go to work]()
- 912:00 a.m. to 4:59 a.m.
- 295:00 a.m. to 5:29 a.m.
- 175:30 a.m. to 5:59 a.m.
- 416:00 a.m. to 6:29 a.m.
- 306:30 a.m. to 6:59 a.m.
- 217:00 a.m. to 7:29 a.m.
- 467:30 a.m. to 7:59 a.m.
- 558:00 a.m. to 8:29 a.m.
- 238:30 a.m. to 8:59 a.m.
- 409:00 a.m. to 9:59 a.m.
- 2610:00 a.m. to 10:59 a.m.
- 1311:00 a.m. to 11:59 a.m.
- 8412:00 p.m. to 3:59 p.m.
- 1064:00 p.m. to 11:59 p.m.

Occupations of males:
- Percentage of males in business and financial operations occupations:
Here: 4.2% city: 4.5%
- Percentage of males in computer and mathematical occupations:
Here: 3.5% city: 4.4%
- Percentage of males in architecture and engineering occupations:
Here: 4.3% city: 2.5%
- Percentage of males in education, training, and library occupations:
Here: 12.4% city: 3.7%
- Percentage of males in service occupations:
Here: 18.5% city: 12.9%
- Percentage of males in sales and office occupations:
Here: 27.0% city: 17.0%
- Percentage of males in construction, extraction, and maintenance occupations:
Here: 11.0% city: 10.8%
- Percentage of males in production occupations:
Here: 5.6% city: 8.0%
- Percentage of males in transportation occupations:
Here: 2.8% city: 7.6%
- Percentage of males in material moving occupations:
Here: 7.2% city: 7.5%
Occupations of females:
- Percentage of females in management occupations (except farmers):
Here: 6.0% city: 9.3%
- Percentage of females in business and financial operations occupations:
Here: 4.6% city: 6.1%
- Percentage of females in computer and mathematical occupations:
Here: 4.2% city: 1.9%
- Percentage of females in life, physical, and social science occupations:
Here: 4.2% city: 0.7%
- Percentage of females in community and social services occupations:
Here: 3.5% city: 2.5%
- Percentage of females in education, training, and library occupations:
Here: 5.6% city: 9.2%
- Percentage of females in arts, design, entertainment, sports, and media occupations:
Here: 3.7% city: 1.7%
- Percentage of females in service occupations:
Here: 29.3% city: 19.8%
- Percentage of females in sales and office occupations:
Here: 27.0% city: 30.1%
- Percentage of females in construction, extraction, and maintenance occupations:
Here: 2.6% city: 0.4%
- Percentage of females in production occupations:
Here: 5.0% city: 3.6%
- Percentage of females in material moving occupations:
Here: 2.9% city: 3.3%
Percentage of people 16-64 in Armed Forces:
| Downtown Business District: | 0.2% |
| Arlington: | 0.4% |
Education in this neighborhood (subdivision or community):
- Percentage of people 3 years and older in K-12 schools:
Downtown Business District: 7.0% Arlington: 19.2%
- Percentage of people 3 years and older in undergraduate colleges:
Downtown Business District: 57.2% Arlington: 8.1%
- Percentage of people 3 years and older in grad. or professional schools:
Downtown Business District: 18.8% Arlington: 1.4%
- Percentage of students K-12 enrolled in private schools:
Downtown Business District: 9.7% Arlington: 7.1%
Percentage of population below poverty level:
| Downtown Business District: | 49.2% |
| Arlington: | 11.7% |
Median year renter moved in (as recorded in 2022):
| Downtown Business District: | 2019 |
| Arlington: | 2020 |
Percentage of married-couple families with both working:
| Downtown Business District: | 35.0% |
| Arlington: | 62.4% |

- 78.5%Electricity
- 17.5%Utility gas
- 3.1%No fuel used
- 0.9%Bottled, tank, or LP gas
Roads and streets:
W Front St
Length: 0.49 miles
Direction: E-W
Address range: 100 to 699
Direction: E-W
Address range: 100 to 699
E Border St
Length: 0.46 miles
Direction: E-W
Address range: 100 to 687
Direction: E-W
Address range: 100 to 687
FM 157 (W Abram St)
Length: 0.40 miles
Direction: E-W
Address range: 100 to 598
Direction: E-W
Address range: 100 to 598
W South St
Length: 0.34 miles
Directions: E-W, SW-NE
Address range: 100 to 499
Directions: E-W, SW-NE
Address range: 100 to 499
Uta Blvd
Length: 0.34 miles
Direction: E-W
Address range: 100 to 499
Direction: E-W
Address range: 100 to 499
E 1st St
Length: 0.30 miles
Direction: E-W
Address range: 100 to 499
Direction: E-W
Address range: 100 to 499
S Center St
Length: 0.29 miles
Direction: N-S
Address range: 100 to 499
Direction: N-S
Address range: 100 to 499
S Mesquite St
Length: 0.25 miles
Direction: N-S
Address range: 100 to 499
Direction: N-S
Address range: 100 to 499
FM 157 (E Abram St)
Length: 0.25 miles
Direction: E-W
Address range: 100 to 399
Direction: E-W
Address range: 100 to 399
E South St
Length: 0.25 miles
Direction: E-W
Address range: 100 to 399
Direction: E-W
Address range: 100 to 399
W Main St
Length: 0.22 miles
Directions: E-W, SW-NE
Address range: 200 to 403
Directions: E-W, SW-NE
Address range: 200 to 403
S Indiana St
Length: 0.21 miles
Direction: N-S
Address range: 100 to 399
Direction: N-S
Address range: 100 to 399
S West St
Length: 0.21 miles
Direction: N-S
Address range: 100 to 399
Direction: N-S
Address range: 100 to 399
S Oak St
Length: 0.21 miles
Direction: N-S
Address range: 100 to 399
Direction: N-S
Address range: 100 to 399
S Pecan St
Length: 0.21 miles
Directions: N-S, SW-NE
Address range: 100 to 399
Directions: N-S, SW-NE
Address range: 100 to 399
S Elm St
Length: 0.20 miles
Direction: N-S
Address range: 100 to 399
Direction: N-S
Address range: 100 to 399
E Main St
Length: 0.17 miles
Direction: E-W
Address range: 100 to 299
Direction: E-W
Address range: 100 to 299
S College St
Length: 0.14 miles
Direction: N-S
Address range: 200 to 399
Direction: N-S
Address range: 200 to 399
E Front St
Length: 0.09 miles
Direction: E-W
Address range: 100 to 199
Direction: E-W
Address range: 100 to 199
Main St
Length: 0.09 miles
Directions: E-W, SW-NE
Directions: E-W, SW-NE
N West St
Length: 0.08 miles
Direction: N-S
Address range: 102 to 199
Direction: N-S
Address range: 102 to 199
N Mesquite St
Length: 0.08 miles
Direction: N-S
Address range: 100 to 199
Direction: N-S
Address range: 100 to 199
S Mary St
Length: 0.06 miles
Direction: N-S
Address range: 400 to 499
Direction: N-S
Address range: 400 to 499
S East St
Length: 0.05 miles
Direction: N-S
Address range: 200 to 299
Direction: N-S
Address range: 200 to 299
N Pecan St
Length: 0.05 miles
Direction: N-S
Address range: 100 to 199
Direction: N-S
Address range: 100 to 199
Indiana St
Length: 0.05 miles
Direction: N-S
Address range: 100 to 199
Direction: N-S
Address range: 100 to 199
N Center St
Length: 0.05 miles
Direction: N-S
Address range: 100 to 199
Direction: N-S
Address range: 100 to 199
N Oak St
Length: 0.03 miles
Direction: N-S
Address range: 100 to 199
Direction: N-S
Address range: 100 to 199
Railroad features:
Texas and Pacific Rlwy
Length: 0.38 miles
Direction: E-W
Direction: E-W