Dolphin neighborhood in Redwood City, California (CA), 94002, 94065, 94070 detailed profile
Settings
X


Business Search - 14 Million verified businesses
Area: 0.538 square miles
Population: 834
Population density:
| Dolphin: | 1,551 people per square mile |
| Redwood City: | 4,134 people per square mile |

- 33236.2%Asian
- 32935.8%White
- 12013.1%Hispanic or Latino
- 535.8%Native Hawaiian and Other
Pacific Islander - 465.0%Two or more races
- 202.2%Some other race
- 161.7%Black
- 20.2%American Indian

Distribution of median household income
![Distribution of median household income]()
- 14Less than $10,000
- 18$10,000 to $19,999
- 48$20,000 to $29,999
- 37$30,000 to $39,999
- 25$40,000 to $49,999
- 13$50,000 to $59,999
- 21$60,000 to $74,999
- 25$75,000 to $99,999
- 16$100,000 to $124,999
- 11$125,000 to $149,999
- 52$150,000 to $199,999
- 114$200,000 or more

Distribution of owner-occupied house/condo value
![Distribution of owner-occupied house/condo value]()
- 32Less than $50,000
- 24$50,000 to $99,999
- 7$100,000 to $149,999
- 6$200,000 to $249,999
- 6$300,000 to $399,999
- 24$400,000 to $499,999
- 9$500,000 to $749,999
- 18$750,000 to $999,999
- 132$1,000,000 or more

Distribution of rent paid by renters
![Distribution of rent paid by renters]()
- 15$300 to $399
- 9$400 to $499
- 19$700 to $799
- 32$800 to $899
- 6$900 to $999
- 49$1,000 to $1,249
- 35$1,250 to $1,499
- 14$1,500 to $1,999
- 191$2,000 or more

Median rent in 2022:
| Dolphin: | $3,377 |
| Redwood City: | $2,001 |
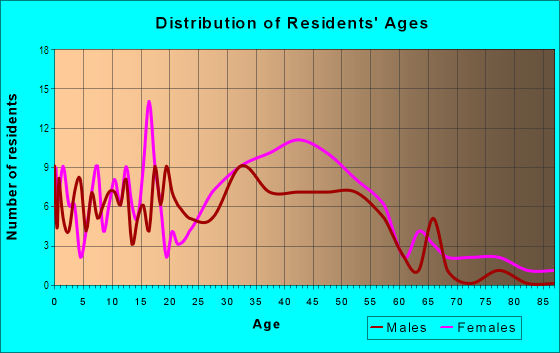
| Males: | 426 |
| Females: | 407 |
Males:
| This neighborhood: | 42.6 years |
| Whole city: | 34.0 years |
| This neighborhood: | 42.4 years |
| Whole city: | 37.5 years |
Average household size:
| Dolphin: | 2.7 people |
| Redwood City: | 2.6 people |
Percentage of family households:
| Dolphin: | 44.2% |
| Redwood City: | 48.9% |
| Here: | 58.0% |
| Redwood City: | 49.5% |
Percentage of married-couple families with children (among all households):
| Dolphin: | 24.5% |
| Redwood City: | 30.8% |
Percentage of single-mother households (among all households):
| Dolphin: | 7.4% |
| Redwood City: | 5.0% |
Percentage of never married males 15 years old and over:
Percentage of never married females 15 years old and over:
| Dolphin: | 16.5% |
| Redwood City: | 20.9% |
Percentage of never married females 15 years old and over:
| Dolphin: | 11.8% |
| city: | 15.9% |
Percentage of people that speak English not well or not at all:
| Dolphin: | 3.3% |
| Redwood City: | 7.0% |
Percentage of people born in this state:
Percentage of people born in another U.S. state:
Percentage of native residents but born outside the U.S.:
Percentage of foreign born residents:
| Here: | 46.1% |
| Redwood City: | 50.0% |
Percentage of people born in another U.S. state:
| Dolphin: | 15.8% |
| Redwood City: | 16.0% |
Percentage of native residents but born outside the U.S.:
| Here: | 2.7% |
| city: | 2.1% |
Percentage of foreign born residents:
| Here: | 35.4% |
| Redwood City: | 31.9% |

Owner-occupied
Renter-occupied


- Rooms in owner-occupied houses and condos in Dolphin
- 01 room
- 132 rooms
- 93 rooms
- 274 rooms
- 315 rooms
- 346 rooms
- 427 rooms
- 98 rooms
- 89+ rooms

- Rooms in renter-occupied apartments in Dolphin
- 221 room
- 72 rooms
- 253 rooms
- 514 rooms
- 295 rooms
- 126 rooms
- 347 rooms
- 68 rooms
- 139+ rooms
Owner-occupied
Renter-occupied

- Bedrooms in owner-occupied houses and condos in Dolphin
- 0no bedroom
- 111 bedroom
- 272 bedrooms
- 623 bedrooms
- 584 bedrooms
- 175+ bedrooms

- Bedrooms in renter-occupied apartments in Dolphin
- 22no bedroom
- 71 bedroom
- 732 bedrooms
- 353 bedrooms
- 134 bedrooms
- 135+ bedrooms
Average number of cars or other vehicles available in houses/condos:
Average number of cars or other vehicles available in apartments:
| This neighborhood: | 2.5 |
| Redwood City: | 2.1 |
Average number of cars or other vehicles available in apartments:
| Here: | 1.7 |
| city: | 1.5 |
Percentage of units with a mortgage:
| Dolphin: | 72.8% |
| Redwood City: | 71.1% |
Average estimated value of detached houses in 2022 (65.3% of all units):
| Dolphin: | $2,011,756 |
| California: | $988,808 |

- Year house built in Dolphin
- 02020 or later
- 82010 to 2019
- 92000 to 2009
- 561990 to 1999
- 561980 to 1989
- 801970 to 1979
- 671960 to 1969
- 811950 to 1959
- 1641940 to 1949
- 51939 or earlier

City-data.com crime index for city in 2020 (higher means more crime):
| City: | 167.5 |
| U.S. average: | 219.5 |
Travel time to work (commute)
![Travel time to work (commute)]()
- 6Less than 5 minutes
- 355 to 9 minutes
- 3710 to 14 minutes
- 5915 to 19 minutes
- 5220 to 24 minutes
- 2225 to 29 minutes
- 9130 to 34 minutes
- 2235 to 39 minutes
- 2140 to 44 minutes
- 3745 to 59 minutes
- 2060 to 89 minutes
- 690 or more minutes

Means of transportation to work
![Means of transportation to work]()
- 62.3%228Drove a car alone
- 2.7%10Carpooled
- 9.6%35Bus
- 5.2%19Subway or elevated rail
- 2.5%9Long-distance train or commuter rail
- 3.8%14Light rail, streetcar or trolley
- 4.6%17Taxi
- 0.8%3Motorcycle
- 1.9%7Bicycle
- 4.6%17Walked
- 3.0%11Other means
- 29.2%107Worked at home

Time leaving home to go to work
![Time leaving home to go to work]()
- 612:00 a.m. to 4:59 a.m.
- 45:00 a.m. to 5:29 a.m.
- 45:30 a.m. to 5:59 a.m.
- 186:00 a.m. to 6:29 a.m.
- 256:30 a.m. to 6:59 a.m.
- 507:00 a.m. to 7:29 a.m.
- 667:30 a.m. to 7:59 a.m.
- 958:00 a.m. to 8:29 a.m.
- 708:30 a.m. to 8:59 a.m.
- 499:00 a.m. to 9:59 a.m.
- 1510:00 a.m. to 10:59 a.m.
- 211:00 a.m. to 11:59 a.m.
- 1512:00 p.m. to 3:59 p.m.
- 94:00 p.m. to 11:59 p.m.

Occupations of males:
- Percentage of males in management occupations (except farmers):
Here: 36.3% city: 16.8%
- Percentage of males in business and financial operations occupations:
Here: 17.3% city: 5.3%
- Percentage of males in computer and mathematical occupations:
Here: 8.5% city: 12.5%
- Percentage of males in architecture and engineering occupations:
Here: 8.1% city: 5.7%
- Percentage of males in legal occupations:
Here: 4.0% city: 1.2%
- Percentage of males in education, training, and library occupations:
Here: 3.9% city: 3.3%
- Percentage of males in arts, design, entertainment, sports, and media occupations:
Here: 1.3% city: 2.7%
- Percentage of males in service occupations:
Here: 9.0% city: 13.8%
- Percentage of males in sales and office occupations:
Here: 3.4% city: 10.3%
- Percentage of males in transportation occupations:
Here: 6.9% city: 3.3%
Occupations of females:
- Percentage of females in management occupations (except farmers):
Here: 6.1% city: 15.2%
- Percentage of females in business and financial operations occupations:
Here: 15.9% city: 7.3%
- Percentage of females in computer and mathematical occupations:
Here: 11.9% city: 5.3%
- Percentage of females in architecture and engineering occupations:
Here: 5.8% city: 1.4%
- Percentage of females in life, physical, and social science occupations:
Here: 2.0% city: 4.4%
- Percentage of females in community and social services occupations:
Here: 1.4% city: 1.4%
- Percentage of females in education, training, and library occupations:
Here: 14.3% city: 9.3%
- Percentage of females in arts, design, entertainment, sports, and media occupations:
Here: 2.5% city: 2.9%
- Percentage of females in healthcare practitioners and technical occupations:
Here: 4.9% city: 7.4%
- Percentage of females in service occupations:
Here: 5.2% city: 17.8%
- Percentage of females in sales and office occupations:
Here: 18.6% city: 20.9%
- Percentage of females in production occupations:
Here: 4.1% city: 2.0%
- Percentage of females in transportation occupations:
Here: 4.0% city: 1.1%
- Percentage of females in material moving occupations:
Here: 1.4% city: 1.1%
Education in this neighborhood (subdivision or community):
- Percentage of people 3 years and older in K-12 schools:
Dolphin: 23.4% Redwood City: 16.6%
- Percentage of people 3 years and older in undergraduate colleges:
Dolphin: 4.5% Redwood City: 5.1%
- Percentage of people 3 years and older in grad. or professional schools:
Dolphin: 3.8% Redwood City: 2.0%
- Percentage of students K-12 enrolled in private schools:
Dolphin: 28.0% Redwood City: 23.2%
Percentage of population below poverty level:
| Dolphin: | 4.5% |
| Redwood City: | 6.2% |
Median year owner moved in (as recorded in 2022):
Median year renter moved in (as recorded in 2022):
| Dolphin: | 2005 |
| Redwood City: | 2007 |
Median year renter moved in (as recorded in 2022):
| Dolphin: | 2014 |
| Redwood City: | 2020 |
Percentage of married-couple families with both working:
| Dolphin: | 73.2% |
| Redwood City: | 67.4% |

- 51.9%Utility gas
- 40.0%Electricity
- 2.7%Bottled, tank, or LP gas
- 2.3%Wood
- 1.3%Solar energy
- 0.9%Other fuel
- 0.9%No fuel used
Roads and streets:
US Hwy 101
Length: 1.20 miles
Directions: N-S, SE-NW
Directions: N-S, SE-NW
Shoreway Rd
Length: 1.00 miles
Directions: E-W, N-S, SE-NW, SW-NE
Address range: 2 to 1499
Directions: E-W, N-S, SE-NW, SW-NE
Address range: 2 to 1499
Twin Dolphin Dr
Length: 0.95 miles
Directions: E-W, SE-NW
Address range: 132 to 599
Directions: E-W, SE-NW
Address range: 132 to 599
Shoreline Dr
Length: 0.66 miles
Directions: E-W, N-S, SE-NW, SW-NE
Address range: 100 to 299
Directions: E-W, N-S, SE-NW, SW-NE
Address range: 100 to 299
Redwood Shores Pkwy
Length: 0.62 miles
Directions: N-S, SE-NW, SW-NE
Address range: 100 to 299
Directions: N-S, SE-NW, SW-NE
Address range: 100 to 299
Lanyard Dr
Length: 0.43 miles
Directions: E-W, N-S, SE-NW, SW-NE
Address range: 400 to 631
Directions: E-W, N-S, SE-NW, SW-NE
Address range: 400 to 631
Pico Blvd
Length: 0.39 miles
Directions: E-W, N-S, SW-NE
Directions: E-W, N-S, SW-NE
Hastings Shore Ln
Length: 0.38 miles
Directions: SE-NW, SW-NE
Address range: 2000 to 2999
Directions: SE-NW, SW-NE
Address range: 2000 to 2999
Holly St
Length: 0.34 miles
Direction: SW-NE
Address range: 635 to 791
Direction: SW-NE
Address range: 635 to 791
Quay Ln
Length: 0.29 miles
Directions: E-W, N-S, SE-NW, SW-NE
Address range: 300 to 399
Directions: E-W, N-S, SE-NW, SW-NE
Address range: 300 to 399
Teredo Dr
Length: 0.25 miles
Directions: E-W, N-S, SE-NW, SW-NE
Address range: 500 to 699
Directions: E-W, N-S, SE-NW, SW-NE
Address range: 500 to 699
Bowsprit Dr
Length: 0.25 miles
Directions: E-W, SW-NE
Address range: 300 to 449
Directions: E-W, SW-NE
Address range: 300 to 449
Bridge Pkwy
Length: 0.23 miles
Direction: SE-NW
Address range: 500 to 2499
Direction: SE-NW
Address range: 500 to 2499
Cormorant Dr
Length: 0.22 miles
Directions: N-S, SW-NE
Directions: N-S, SW-NE
Spar Dr
Length: 0.18 miles
Directions: E-W, SE-NW
Address range: 600 to 699
Directions: E-W, SE-NW
Address range: 600 to 699
Turks Head Ln
Length: 0.18 miles
Directions: N-S, SW-NE
Address range: 2 to 399
Directions: N-S, SW-NE
Address range: 2 to 399
Tiller Ln
Length: 0.13 miles
Directions: N-S, SW-NE
Address range: 400 to 444
Directions: N-S, SW-NE
Address range: 400 to 444
Ensign Ln
Length: 0.08 miles
Direction: SW-NE
Address range: 300 to 399
Direction: SW-NE
Address range: 300 to 399
Gunter Ln
Length: 0.08 miles
Direction: SW-NE
Address range: 300 to 399
Direction: SW-NE
Address range: 300 to 399
Peninsula Pkwy
Length: 0.06 miles
Direction: SW-NE
Direction: SW-NE
Turks Head Ct
Length: 0.04 miles
Direction: SE-NW
Address range: 2 to 54
Direction: SE-NW
Address range: 2 to 54
Capstan Ct
Length: 0.03 miles
Direction: E-W
Address range: 300 to 399
Direction: E-W
Address range: 300 to 399
Pennant Ct
Length: 0.02 miles
Direction: E-W
Address range: 500 to 516
Direction: E-W
Address range: 500 to 516
Other features:
Phelps Slough
Length: 1.37 miles
Directions: E-W, N-S, SE-NW, SW-NE
Directions: E-W, N-S, SE-NW, SW-NE