Columbia Tech Center neighborhood in Vancouver, Washington (WA), 98607 detailed profile
Settings
X


Business Search - 14 Million verified businesses
Area: 0.203 square miles
Population: 171
Population density:
| Columbia Tech Center: | 843 people per square mile |
| Vancouver: | 4,545 people per square mile |

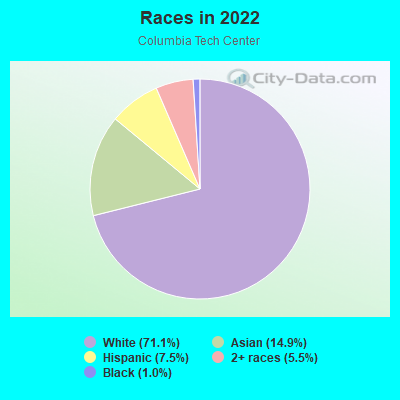
- 14371.1%White
- 3014.9%Asian
- 157.5%Hispanic or Latino
- 115.5%Two or more races
- 21.0%Black
Median household income in 2022:
| Columbia Tech Center: | $103,115 |
| Vancouver: | $76,799 |
Distribution of median household income
![Distribution of median household income]()
- 9Less than $10,000
- 14$10,000 to $19,999
- 10$20,000 to $29,999
- 24$30,000 to $39,999
- 18$40,000 to $49,999
- 29$50,000 to $59,999
- 9$60,000 to $74,999
- 19$75,000 to $99,999
- 24$100,000 to $124,999
- 30$125,000 to $149,999
- 4$150,000 to $199,999
- 6$200,000 or more

Distribution of owner-occupied house/condo value
![Distribution of owner-occupied house/condo value]()
- 10Less than $50,000
- 5$100,000 to $149,999
- 7$150,000 to $199,999
- 5$200,000 to $249,999
- 34$250,000 to $299,999
- 22$300,000 to $399,999
- 21$400,000 to $499,999
- 7$500,000 to $749,999

Distribution of rent paid by renters
![Distribution of rent paid by renters]()
- 23$900 to $999
- 16$1,000 to $1,249
- 27$1,250 to $1,499
- 51$1,500 to $1,999
- 42$2,000 or more

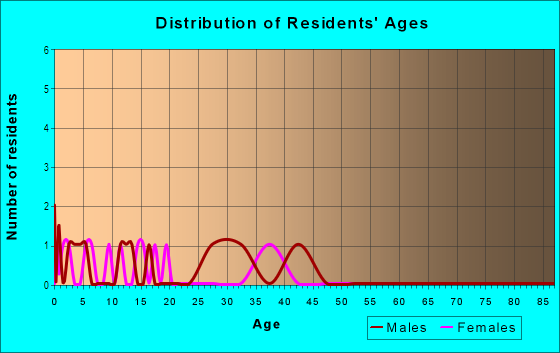
| Males: | 102 |
| Females: | 69 |
Males:
| This neighborhood: | 46.8 years |
| Whole city: | 34.7 years |
| This neighborhood: | 51.3 years |
| Whole city: | 39.9 years |
Average household size:
| Columbia Tech Center: | 2.3 people |
| Vancouver: | 2.4 people |
Percentage of family households:
| Columbia Tech Center: | 46.6% |
| Vancouver: | 40.5% |
| Here: | 45.0% |
| Vancouver: | 40.2% |
Percentage of married-couple families with children (among all households):
| Columbia Tech Center: | 25.9% |
| Vancouver: | 27.2% |
Percentage of single-mother households (among all households):
| Columbia Tech Center: | 27.7% |
| Vancouver: | 9.7% |
Percentage of never married males 15 years old and over:
Percentage of never married females 15 years old and over:
| Columbia Tech Center: | 12.5% |
| Vancouver: | 18.8% |
Percentage of never married females 15 years old and over:
| Columbia Tech Center: | 69.3% |
| city: | 17.6% |
Percentage of people born in this state:
Percentage of people born in another U.S. state:
Percentage of native residents but born outside the U.S.:
Percentage of foreign born residents:
| Here: | 32.6% |
| Vancouver: | 30.3% |
Percentage of people born in another U.S. state:
| Columbia Tech Center: | 44.7% |
| Vancouver: | 54.5% |
Percentage of native residents but born outside the U.S.:
| Here: | 1.8% |
| city: | 1.4% |
Percentage of foreign born residents:
| Here: | 20.9% |
| Vancouver: | 13.8% |
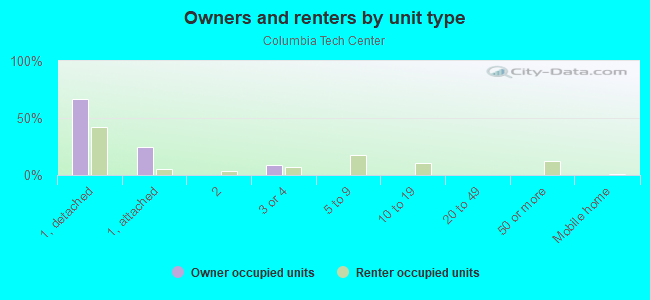
Owner-occupied
Renter-occupied

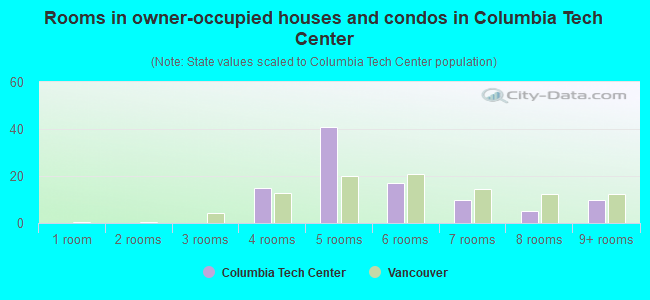
- Rooms in owner-occupied houses and condos in Columbia Tech Center
- 01 room
- 02 rooms
- 03 rooms
- 154 rooms
- 415 rooms
- 176 rooms
- 107 rooms
- 58 rooms
- 109+ rooms
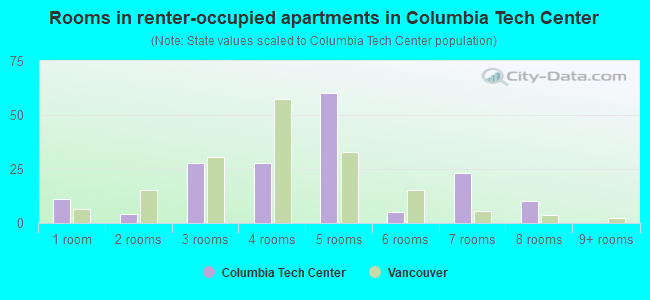
- Rooms in renter-occupied apartments in Columbia Tech Center
- 111 room
- 42 rooms
- 283 rooms
- 284 rooms
- 605 rooms
- 56 rooms
- 237 rooms
- 108 rooms
- 09+ rooms
Owner-occupied
Renter-occupied
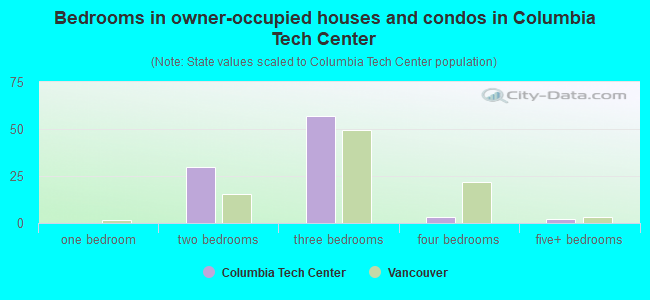
- Bedrooms in owner-occupied houses and condos in Columbia Tech Center
- 0no bedroom
- 01 bedroom
- 302 bedrooms
- 573 bedrooms
- 34 bedrooms
- 25+ bedrooms
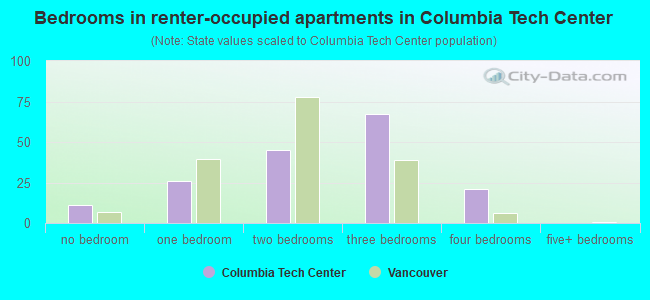
- Bedrooms in renter-occupied apartments in Columbia Tech Center
- 11no bedroom
- 261 bedroom
- 452 bedrooms
- 673 bedrooms
- 214 bedrooms
- 05+ bedrooms
Average number of cars or other vehicles available in houses/condos:
Average number of cars or other vehicles available in apartments:
| This neighborhood: | 1.7 |
| Vancouver: | 2.2 |
Average number of cars or other vehicles available in apartments:
| Here: | |
| city: |
Percentage of units with a mortgage:
| Columbia Tech Center: | 94.8% |
| Vancouver: | 64.8% |
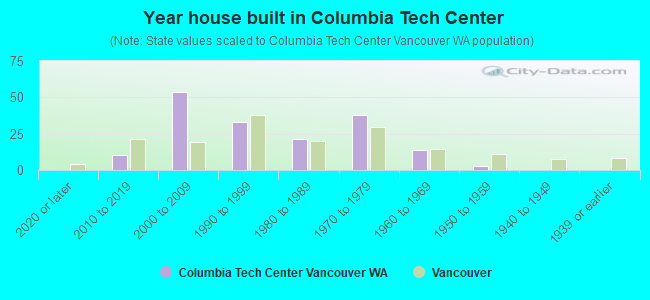
- Year house built in Columbia Tech Center
- 02020 or later
- 102010 to 2019
- 542000 to 2009
- 331990 to 1999
- 211980 to 1989
- 381970 to 1979
- 141960 to 1969
- 31950 to 1959
- 01940 to 1949
- 01939 or earlier
City-data.com crime index for city in 2020 (higher means more crime):
| City: | 339.4 |
| U.S. average: | 219.5 |
Travel time to work (commute)
![Travel time to work (commute)]()
- 7Less than 5 minutes
- 315 to 9 minutes
- 9910 to 14 minutes
- 7815 to 19 minutes
- 6220 to 24 minutes
- 2325 to 29 minutes
- 8530 to 34 minutes
- 135 to 39 minutes
- 3640 to 44 minutes
- 945 to 59 minutes
- 460 to 89 minutes
- 1590 or more minutes

Means of transportation to work
![Means of transportation to work]()
- 83.0%87Drove a car alone
- 78.2%82Carpooled
- 1.9%2Bus
- 9.5%10Walked
- 6.7%7Other means
- 16.2%17Worked at home

Time leaving home to go to work
![Time leaving home to go to work]()
- 5012:00 a.m. to 4:59 a.m.
- 385:00 a.m. to 5:29 a.m.
- 145:30 a.m. to 5:59 a.m.
- 636:00 a.m. to 6:29 a.m.
- 266:30 a.m. to 6:59 a.m.
- 397:00 a.m. to 7:29 a.m.
- 577:30 a.m. to 7:59 a.m.
- 228:00 a.m. to 8:29 a.m.
- 168:30 a.m. to 8:59 a.m.
- 439:00 a.m. to 9:59 a.m.
- 1010:00 a.m. to 10:59 a.m.
- 1011:00 a.m. to 11:59 a.m.
- 2712:00 p.m. to 3:59 p.m.
- 354:00 p.m. to 11:59 p.m.

Occupations of males:
- Percentage of males in management occupations (except farmers):
Here: 96.3% city: 9.6%
- Percentage of males in business and financial operations occupations:
Here: 25.7% city: 5.2%
- Percentage of males in computer and mathematical occupations:
Here: 24.6% city: 4.9%
- Percentage of males in architecture and engineering occupations:
Here: 5.3% city: 3.6%
- Percentage of males in community and social services occupations:
Here: 7.8% city: 1.0%
- Percentage of males in healthcare practitioners and technical occupations:
Here: 2.9% city: 2.3%
- Percentage of males in service occupations:
Here: 39.9% city: 12.4%
- Percentage of males in sales and office occupations:
Here: 27.7% city: 15.7%
- Percentage of males in construction, extraction, and maintenance occupations:
Here: 22.4% city: 11.5%
- Percentage of males in production occupations:
Here: 52.0% city: 8.2%
- Percentage of males in transportation occupations:
Here: 5.6% city: 8.9%
- Percentage of males in material moving occupations:
Here: 47.9% city: 5.8%
Occupations of females:
- Percentage of females in management occupations (except farmers):
Here: 17.9% city: 8.2%
- Percentage of females in business and financial operations occupations:
Here: 43.0% city: 7.3%
- Percentage of females in computer and mathematical occupations:
Here: 30.0% city: 2.7%
- Percentage of females in architecture and engineering occupations:
Here: 6.5% city: 0.7%
- Percentage of females in community and social services occupations:
Here: 2.1% city: 1.9%
- Percentage of females in legal occupations:
Here: 20.9% city: 1.0%
- Percentage of females in education, training, and library occupations:
Here: 14.4% city: 6.5%
- Percentage of females in healthcare practitioners and technical occupations:
Here: 32.9% city: 9.1%
- Percentage of females in service occupations:
Here: 30.9% city: 24.5%
- Percentage of females in sales and office occupations:
Here: 33.8% city: 26.7%
- Percentage of females in production occupations:
Here: 29.3% city: 3.4%
- Percentage of females in transportation occupations:
Here: 3.4% city: 2.0%
- Percentage of females in material moving occupations:
Here: 12.2% city: 2.3%
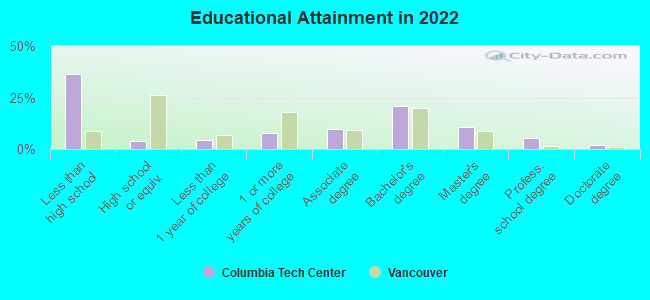
Education in this neighborhood (subdivision or community):
- Percentage of people 3 years and older in K-12 schools:
Columbia Tech Center: 94.7% Vancouver: 16.4%
- Percentage of people 3 years and older in undergraduate colleges:
Columbia Tech Center: 15.8% Vancouver: 4.1%
- Percentage of people 3 years and older in grad. or professional schools:
Columbia Tech Center: 0.0% Vancouver: 1.0%
- Percentage of students K-12 enrolled in private schools:
Columbia Tech Center: 3.7% Vancouver: 6.8%
Percentage of population below poverty level:
| Columbia Tech Center: | 11.6% |
| Vancouver: | 10.0% |
Median year owner moved in (as recorded in 2022):
| Columbia Tech Center: | 2497 |
| Vancouver: | 2012 |
Percentage of married-couple families with both working:
| Columbia Tech Center: | 261.8% |
| Vancouver: | 55.7% |
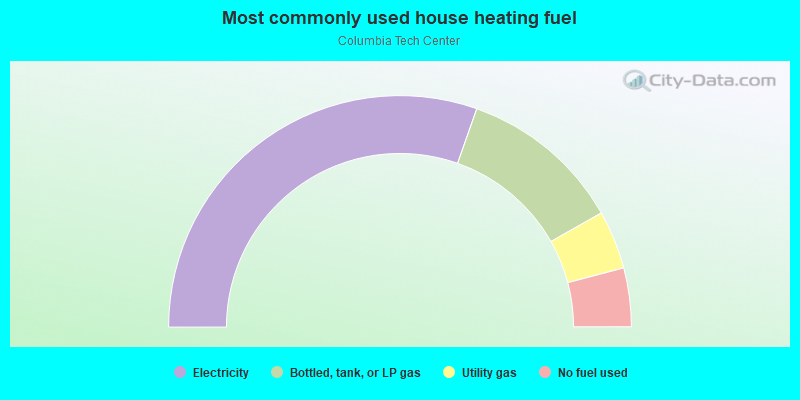
- 60.8%Electricity
- 22.8%Bottled, tank, or LP gas
- 8.2%Utility gas
- 8.2%No fuel used
Roads and streets:
SE Tech Center Dr
Length: 0.33 miles
Directions: E-W, N-S, SE-NW, SW-NE
Address range: 500 to 1499
Directions: E-W, N-S, SE-NW, SW-NE
Address range: 500 to 1499
SE Sequoia Cir
Length: 0.19 miles
Directions: E-W, SE-NW
Address range: 17500 to 17599
Directions: E-W, SE-NW
Address range: 17500 to 17599
SE Cardinal Ct
Length: 0.11 miles
Directions: N-S, SW-NE
Address range: 1200 to 1499
Directions: N-S, SW-NE
Address range: 1200 to 1499
SE 15th St
Length: 0.07 miles
Direction: E-W
Address range: 16678 to 16761
Direction: E-W
Address range: 16678 to 16761