West Point-Wilseyville, California (CA) income map, earnings map, and wages data
The median household income in West Point-Wilseyville, CA in 2022 was $74,961, which was 22.1% less than the median annual income of $91,551 across the entire state of California. Compared to the median income of $39,744 in 2000 this represents an increase of 47.0%. The per capita income in 2022 was $45,411, which means an increase of 49.0% compared to 2000 when it was $23,153.
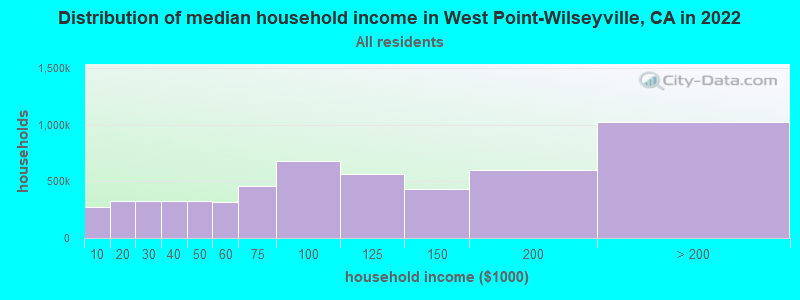
Income statistics for all residents
Median household income in West Point-Wilseyville, CA in 2022:| West Point-Wilseyville: | $74,962 |
| State: | $91,551 |
Change in median household income between 2000 and 2022:| West Point-Wilseyville, California: | +88.6% |
| State: | +92.8% |
Number of households with income < $10k:| West Point-Wilseyville: | 4.8% (273,704) |
| State: | 4.8% (654,370) |
Number of households with income $10k - 20k:| West Point-Wilseyville: | 5.8% (330,255) |
| State: | 5.8% (789,493) |
Number of households with income $20k - 30k:| West Point-Wilseyville: | 5.7% (325,616) |
| California: | 5.7% (778,318) |
Number of households with income $30k - 40k:| West Point-Wilseyville: | 5.8% (327,613) |
| California: | 5.8% (783,170) |
Number of households with income $40k - 50k:| West Point-Wilseyville: | 5.8% (326,867) |
| State: | 5.8% (781,352) |
Number of households with income $50k - 60k:| West Point-Wilseyville: | 5.6% (317,937) |
| State: | 5.6% (760,175) |
Number of households with income $60k - 75k:| West Point-Wilseyville: | 8.2% (462,066) |
| State: | 8.2% (1,104,699) |
Number of households with income $75k - 100k:| West Point-Wilseyville: | 12.0% (680,631) |
| State: | 12.0% (1,627,633) |
Number of households with income $100k - 125k:| West Point-Wilseyville: | 10.0% (568,209) |
| State: | 10.0% (1,358,619) |
Number of households with income $125k - 150k:| West Point-Wilseyville: | 7.6% (429,687) |
| State: | 7.6% (1,027,455) |
Number of households with income $150k - 200k:| West Point-Wilseyville: | 10.6% (602,119) |
| State: | 10.6% (1,439,811) |
Number of households with income > $200k:| West Point-Wilseyville: | 18.0% (1,022,469) |
| State: | 18.0% (2,445,491) |
Aggregate household income in West Point-Wilseyville in 2022: $111,701,919,950
Median family income in West Point-Wilseyville in 2022:| West Point-Wilseyville: | $91,107 |
| State: | $104,823 |
Median non-family income in West Point-Wilseyville in 2022:| West Point-Wilseyville: | $37,929 |
| State: | $59,348 |
Change in median non-family income between 2000 and 2022:| West Point-Wilseyville, California: | +76.6% |
| State: | +85.3% |
Median per capita income in West Point-Wilseyville in 2022:| West Point-Wilseyville: | $45,412 |
| State: | $46,661 |
Change in median per capita income between 2000 and 2022:| West Point-Wilseyville, California: | +96.1% |
| State: | +105.5% |
Income statistics for White residents
Median household income in West Point-Wilseyville, CA in 2022:| West Point-Wilseyville: | $76,871 |
| California: | $100,917 |
Change in median household income between 2000 and 2022:| West Point-Wilseyville, California: | +92.1% |
| State: | +96.8% |
Number of households with income < $10k:| West Point-Wilseyville: | 4.4% (111,137) |
| California: | 4.4% (284,109) |
Number of households with income $10k - 20k:| West Point-Wilseyville: | 5.3% (133,234) |
| California: | 5.3% (340,330) |
Number of households with income $20k - 30k:| West Point-Wilseyville: | 5.3% (134,281) |
| State: | 5.3% (343,145) |
Number of households with income $30k - 40k:| West Point-Wilseyville: | 5.1% (129,198) |
| State: | 5.1% (330,146) |
Number of households with income $40k - 50k:| West Point-Wilseyville: | 5.2% (131,223) |
| California: | 5.2% (335,310) |
Number of households with income $50k - 60k:| West Point-Wilseyville: | 5.1% (127,560) |
| State: | 5.1% (326,299) |
Number of households with income $60k - 75k:| West Point-Wilseyville: | 7.6% (190,766) |
| State: | 7.6% (487,640) |
Number of households with income $75k - 100k:| West Point-Wilseyville: | 11.5% (287,995) |
| California: | 11.5% (736,578) |
Number of households with income $100k - 125k:| West Point-Wilseyville: | 10.1% (253,579) |
| State: | 10.1% (648,782) |
Number of households with income $125k - 150k:| West Point-Wilseyville: | 7.8% (195,392) |
| California: | 7.8% (499,671) |
Number of households with income $150k - 200k:| West Point-Wilseyville: | 11.3% (285,098) |
| California: | 11.4% (729,603) |
Number of households with income > $200k:| West Point-Wilseyville: | 21.2% (532,557) |
| California: | 21.2% (1,364,246) |
Aggregate household income in West Point-Wilseyville in 2022: $56,305,704,381
Median family income in West Point-Wilseyville in 2022:| West Point-Wilseyville: | $96,233 |
| California: | $125,379 |
Number of families with income < $10k:| West Point-Wilseyville: | 3.6% (77) |
| State: | 2.2% (87,079) |
Number of families with income $10k - 20k:| West Point-Wilseyville: | 4.1% (89) |
| State: | 2.5% (97,716) |
Number of families with income $20k - 30k:| West Point-Wilseyville: | 4.4% (94) |
| State: | 3.5% (137,295) |
Number of families with income $30k - 40k:| West Point-Wilseyville: | 7.4% (158) |
| California: | 3.9% (152,947) |
Number of families with income $40k - 50k:| West Point-Wilseyville: | 7.2% (155) |
| State: | 4.3% (169,197) |
Number of families with income $50k - 60k:| West Point-Wilseyville: | 6.7% (144) |
| State: | 4.5% (176,192) |
Number of families with income $60k - 75k:| West Point-Wilseyville: | 8.4% (181) |
| State: | 7.0% (274,752) |
Number of families with income $75k - 100k:| West Point-Wilseyville: | 10.3% (222) |
| State: | 11.3% (445,632) |
Number of families with income $100k - 125k:| West Point-Wilseyville: | 9.9% (213) |
| State: | 10.7% (423,630) |
Number of families with income $125k - 150k:| West Point-Wilseyville: | 11.7% (250) |
| State: | 9.1% (357,408) |
Number of families with income $150k - 200k:| West Point-Wilseyville: | 10.3% (222) |
| California: | 13.5% (532,693) |
Number of families with income > $200k:| West Point-Wilseyville: | 15.9% (341) |
| State: | 27.6% (1,086,948) |
Median non-family income in West Point-Wilseyville in 2022:| West Point-Wilseyville: | $37,941 |
| California: | $62,819 |
Change in median non-family income between 2000 and 2022:| West Point-Wilseyville, California: | +75.2% |
| California: | +84.4% |
Median per capita income in West Point-Wilseyville in 2022:| West Point-Wilseyville: | $50,817 |
| State: | $61,706 |
Change in median per capita income between 2000 and 2022:| West Point-Wilseyville, California: | +113.4% |
| State: | +122.7% |
Income statistics for Black or African American residents
Median household income in West Point-Wilseyville, CA in 2022:| West Point-Wilseyville: | $17,894 |
| State: | $63,268 |
Change in median household income between 2000 and 2022:| West Point-Wilseyville, California: | +81.5% |
| State: | +81.0% |
Number of households with income < $10k:| West Point-Wilseyville: | 9.0% (10,323) |
| State: | 9.0% (73,219) |
Number of households with income $10k - 20k:| West Point-Wilseyville: | 10.6% (12,218) |
| California: | 10.6% (86,666) |
Number of households with income $20k - 30k:| West Point-Wilseyville: | 7.1% (8,136) |
| California: | 7.1% (57,719) |
Number of households with income $30k - 40k:| West Point-Wilseyville: | 7.2% (8,284) |
| State: | 7.2% (58,714) |
Number of households with income $40k - 50k:| West Point-Wilseyville: | 7.1% (8,184) |
| State: | 7.1% (58,075) |
Number of households with income $50k - 60k:| West Point-Wilseyville: | 6.8% (7,794) |
| State: | 6.8% (55,229) |
Number of households with income $60k - 75k:| West Point-Wilseyville: | 8.8% (10,128) |
| State: | 8.8% (71,895) |
Number of households with income $75k - 100k:| West Point-Wilseyville: | 11.9% (13,658) |
| State: | 11.9% (96,893) |
Number of households with income $100k - 125k:| West Point-Wilseyville: | 8.7% (9,962) |
| California: | 8.7% (70,729) |
Number of households with income $125k - 150k:| West Point-Wilseyville: | 6.3% (7,223) |
| State: | 6.3% (51,211) |
Number of households with income $150k - 200k:| West Point-Wilseyville: | 7.2% (8,274) |
| State: | 7.2% (58,687) |
Number of households with income > $200k:| West Point-Wilseyville: | 9.3% (10,634) |
| State: | 9.3% (75,487) |
Aggregate household income in West Point-Wilseyville in 2022: $3,046,142
Median family income in West Point-Wilseyville in 2022:| West Point-Wilseyville: | $18,778 |
| State: | $77,263 |
Number of families with income < $10k:| West Point-Wilseyville: | 69.9% (9) |
| State: | 5.9% (27,037) |
Number of families with income $10k - 20k:| West Point-Wilseyville: | 30.1% (4) |
| State: | 6.4% (29,505) |
Median per capita income in West Point-Wilseyville in 2022:| West Point-Wilseyville: | $7,455 |
| State: | $36,708 |
Change in median per capita income between 2000 and 2022:| West Point-Wilseyville, California: | +75.5% |
| State: | +110.4% |
Income statistics for Asian residents
Median household income in West Point-Wilseyville, CA in 2022:| West Point-Wilseyville: | $334,610 |
| State: | $119,861 |
Change in median household income between 2000 and 2022:| West Point-Wilseyville, California: | +119.6% |
| California: | +116.5% |
Number of households with income < $10k:| West Point-Wilseyville: | 5.1% (146,163) |
| State: | 5.1% (106,273) |
Number of households with income $10k - 20k:| West Point-Wilseyville: | 4.9% (140,099) |
| State: | 4.9% (101,815) |
Number of households with income $20k - 30k:| West Point-Wilseyville: | 4.6% (129,857) |
| State: | 4.6% (94,414) |
Number of households with income $30k - 40k:| West Point-Wilseyville: | 4.1% (116,238) |
| State: | 4.1% (84,491) |
Number of households with income $40k - 50k:| West Point-Wilseyville: | 4.0% (112,458) |
| State: | 4.0% (81,758) |
Number of households with income $50k - 60k:| West Point-Wilseyville: | 3.9% (111,326) |
| California: | 3.9% (80,971) |
Number of households with income $60k - 75k:| West Point-Wilseyville: | 6.0% (170,803) |
| State: | 6.0% (124,194) |
Number of households with income $75k - 100k:| West Point-Wilseyville: | 9.7% (275,661) |
| State: | 9.7% (200,337) |
Number of households with income $100k - 125k:| West Point-Wilseyville: | 9.4% (266,120) |
| State: | 9.4% (193,488) |
Number of households with income $125k - 150k:| West Point-Wilseyville: | 7.7% (217,711) |
| State: | 7.7% (158,253) |
Number of households with income $150k - 200k:| West Point-Wilseyville: | 12.2% (346,768) |
| California: | 12.2% (252,139) |
Number of households with income > $200k:| West Point-Wilseyville: | 28.4% (806,756) |
| State: | 28.4% (586,641) |
Aggregate household income in West Point-Wilseyville in 2022: $192,371,048
Median family income in West Point-Wilseyville in 2022:| West Point-Wilseyville: | $329,160 |
| California: | $136,040 |
Number of families with income $150k - 200k:| West Point-Wilseyville: | 100.0% (59) |
| State: | 13.2% (198,099) |
Median per capita income in West Point-Wilseyville in 2022:| West Point-Wilseyville: | $113,235 |
| State: | $58,824 |
Change in median per capita income between 2000 and 2022:| West Point-Wilseyville, California: | +135.2% |
| California: | +166.8% |
Income statistics for Hispanic or Latino residents
Median household income in West Point-Wilseyville, CA in 2022:| West Point-Wilseyville: | $89,009 |
| California: | $75,698 |
Change in median household income between 2000 and 2022:| West Point-Wilseyville, California: | +106.9% |
| State: | +107.2% |
Number of households with income < $10k:| West Point-Wilseyville: | 4.3% (108,229) |
| California: | 4.3% (183,294) |
Number of households with income $10k - 20k:| West Point-Wilseyville: | 6.0% (149,768) |
| State: | 6.0% (253,903) |
Number of households with income $20k - 30k:| West Point-Wilseyville: | 6.8% (168,987) |
| California: | 6.8% (286,386) |
Number of households with income $30k - 40k:| West Point-Wilseyville: | 7.4% (185,080) |
| California: | 7.4% (313,728) |
Number of households with income $40k - 50k:| West Point-Wilseyville: | 7.4% (184,819) |
| State: | 7.4% (313,199) |
Number of households with income $50k - 60k:| West Point-Wilseyville: | 7.2% (180,177) |
| State: | 7.2% (305,366) |
Number of households with income $60k - 75k:| West Point-Wilseyville: | 10.3% (256,499) |
| California: | 10.3% (434,937) |
Number of households with income $75k - 100k:| West Point-Wilseyville: | 14.4% (357,793) |
| California: | 14.4% (607,302) |
Number of households with income $100k - 125k:| West Point-Wilseyville: | 10.6% (263,804) |
| State: | 10.6% (447,424) |
Number of households with income $125k - 150k:| West Point-Wilseyville: | 7.5% (186,098) |
| California: | 7.5% (316,022) |
Number of households with income $150k - 200k:| West Point-Wilseyville: | 9.1% (227,675) |
| State: | 9.2% (386,269) |
Number of households with income > $200k:| West Point-Wilseyville: | 8.8% (219,842) |
| State: | 8.8% (372,651) |
Aggregate household income in West Point-Wilseyville in 2022: $2,314,632,430
Median family income in West Point-Wilseyville in 2022:| West Point-Wilseyville: | $104,936 |
| California: | $77,589 |
Number of families with income < $10k:| West Point-Wilseyville: | 5.7% (95) |
| State: | 3.9% (129,468) |
Number of families with income $10k - 20k:| West Point-Wilseyville: | 8.4% (141) |
| California: | 4.6% (151,997) |
Number of families with income $20k - 30k:| West Point-Wilseyville: | 9.0% (152) |
| State: | 6.6% (216,764) |
Number of families with income $30k - 40k:| West Point-Wilseyville: | 12.7% (213) |
| California: | 7.6% (249,849) |
Number of families with income $40k - 50k:| West Point-Wilseyville: | 11.7% (196) |
| State: | 7.7% (254,822) |
Number of families with income $50k - 60k:| West Point-Wilseyville: | 9.8% (165) |
| State: | 7.4% (244,815) |
Number of families with income $60k - 75k:| West Point-Wilseyville: | 10.2% (172) |
| State: | 10.5% (345,838) |
Number of families with income $75k - 100k:| West Point-Wilseyville: | 8.6% (145) |
| California: | 14.9% (491,589) |
Number of families with income $100k - 125k:| West Point-Wilseyville: | 7.8% (131) |
| California: | 10.7% (355,400) |
Number of families with income $125k - 150k:| West Point-Wilseyville: | 7.0% (118) |
| State: | 7.8% (259,317) |
Number of families with income $150k - 200k:| West Point-Wilseyville: | 5.5% (93) |
| State: | 9.3% (306,566) |
Number of families with income > $200k:| West Point-Wilseyville: | 3.6% (61) |
| State: | 9.1% (299,984) |
Median non-family income in West Point-Wilseyville in 2022:| West Point-Wilseyville: | $32,853 |
| California: | $49,746 |
Change in median non-family income between 2000 and 2022:| West Point-Wilseyville, California: | +97.9% |
| State: | +100.7% |
Median per capita income in West Point-Wilseyville in 2022:| West Point-Wilseyville: | $71,860 |
| State: | $27,240 |
Change in median per capita income between 2000 and 2022:| West Point-Wilseyville, California: | +130.5% |
| California: | +133.3% |
Income statistics for American Indian and Alaska Native residents
Median household income in West Point-Wilseyville, CA in 2022:| West Point-Wilseyville: | $49,719 |
| California: | $76,752 |
Change in median household income between 2000 and 2022:| West Point-Wilseyville, California: | +113.8% |
| State: | +110.0% |
Number of households with income < $10k:| West Point-Wilseyville: | 5.4% (2,683) |
| California: | 5.4% (8,471) |
Number of households with income $10k - 20k:| West Point-Wilseyville: | 6.0% (2,960) |
| California: | 6.0% (9,381) |
Number of households with income $20k - 30k:| West Point-Wilseyville: | 5.6% (2,781) |
| State: | 5.5% (8,668) |
Number of households with income $30k - 40k:| West Point-Wilseyville: | 8.2% (4,080) |
| State: | 8.3% (13,030) |
Number of households with income $40k - 50k:| West Point-Wilseyville: | 7.0% (3,452) |
| State: | 6.9% (10,908) |
Number of households with income $50k - 60k:| West Point-Wilseyville: | 7.1% (3,528) |
| State: | 7.1% (11,198) |
Number of households with income $60k - 75k:| West Point-Wilseyville: | 9.6% (4,766) |
| California: | 9.6% (15,190) |
Number of households with income $75k - 100k:| West Point-Wilseyville: | 14.0% (6,962) |
| California: | 14.1% (22,274) |
Number of households with income $100k - 125k:| West Point-Wilseyville: | 11.3% (5,593) |
| State: | 11.2% (17,643) |
Number of households with income $125k - 150k:| West Point-Wilseyville: | 8.3% (4,098) |
| State: | 8.3% (13,117) |
Number of households with income $150k - 200k:| West Point-Wilseyville: | 8.8% (4,355) |
| State: | 8.8% (13,853) |
Number of households with income > $200k:| West Point-Wilseyville: | 8.8% (4,373) |
| California: | 8.8% (13,925) |
Aggregate household income in West Point-Wilseyville in 2022: $10,682,276
Median family income in West Point-Wilseyville in 2022:| West Point-Wilseyville: | $60,553 |
| California: | $81,108 |
Number of families with income $10k - 20k:| West Point-Wilseyville: | 10.1% (5) |
| California: | 3.7% (4,148) |
Number of families with income $20k - 30k:| West Point-Wilseyville: | 23.7% (13) |
| California: | 4.3% (4,876) |
Number of families with income $30k - 40k:| West Point-Wilseyville: | 9.8% (5) |
| California: | 8.8% (9,994) |
Number of families with income $40k - 50k:| West Point-Wilseyville: | 23.7% (13) |
| State: | 7.8% (8,776) |
Number of families with income $100k - 125k:| West Point-Wilseyville: | 32.7% (18) |
| California: | 12.0% (13,609) |
Median non-family income in West Point-Wilseyville in 2022:| West Point-Wilseyville: | $28,756 |
| State: | $51,296 |
Change in median non-family income between 2000 and 2022:| West Point-Wilseyville, California: | +80.0% |
| State: | +114.0% |
Median per capita income in West Point-Wilseyville in 2022:| West Point-Wilseyville: | $18,585 |
| State: | $30,289 |
Change in median per capita income between 2000 and 2022:| West Point-Wilseyville, California: | +99.9% |
| State: | +98.9% |
Income statistics for Multirace residents
Median household income in West Point-Wilseyville, CA in 2022:| West Point-Wilseyville: | $85,073 |
| California: | $83,153 |
Change in median household income between 2000 and 2022:| West Point-Wilseyville, California: | +99.3% |
| State: | +106.0% |
Number of households with income < $10k:| West Point-Wilseyville: | 4.2% (45,190) |
| State: | 4.2% (85,299) |
Number of households with income $10k - 20k:| West Point-Wilseyville: | 6.1% (65,104) |
| State: | 6.1% (122,966) |
Number of households with income $20k - 30k:| West Point-Wilseyville: | 6.4% (68,553) |
| State: | 6.4% (129,328) |
Number of households with income $30k - 40k:| West Point-Wilseyville: | 6.4% (68,918) |
| State: | 6.4% (130,070) |
Number of households with income $40k - 50k:| West Point-Wilseyville: | 6.5% (69,514) |
| State: | 6.5% (131,254) |
Number of households with income $50k - 60k:| West Point-Wilseyville: | 6.5% (70,112) |
| State: | 6.5% (132,382) |
Number of households with income $60k - 75k:| West Point-Wilseyville: | 9.4% (101,340) |
| California: | 9.4% (191,472) |
Number of households with income $75k - 100k:| West Point-Wilseyville: | 13.3% (142,622) |
| California: | 13.3% (269,691) |
Number of households with income $100k - 125k:| West Point-Wilseyville: | 10.2% (109,726) |
| State: | 10.2% (207,286) |
Number of households with income $125k - 150k:| West Point-Wilseyville: | 7.8% (83,665) |
| State: | 7.8% (158,259) |
Number of households with income $150k - 200k:| West Point-Wilseyville: | 10.3% (110,712) |
| State: | 10.3% (209,227) |
Number of households with income > $200k:| West Point-Wilseyville: | 13.0% (139,319) |
| California: | 13.0% (263,210) |
Aggregate household income in West Point-Wilseyville in 2022: $206,327,792
Median family income in West Point-Wilseyville in 2022:| West Point-Wilseyville: | $94,850 |
| State: | $87,642 |
Number of families with income < $10k:| West Point-Wilseyville: | 11.1% (28) |
| State: | 3.2% (48,017) |
Number of families with income $30k - 40k:| West Point-Wilseyville: | 5.7% (14) |
| State: | 6.2% (91,415) |
Number of families with income $40k - 50k:| West Point-Wilseyville: | 17.9% (45) |
| State: | 6.8% (100,085) |
Number of families with income $50k - 60k:| West Point-Wilseyville: | 19.6% (49) |
| California: | 6.7% (98,298) |
Number of families with income $60k - 75k:| West Point-Wilseyville: | 10.3% (26) |
| State: | 9.5% (140,131) |
Number of families with income $100k - 125k:| West Point-Wilseyville: | 35.3% (89) |
| State: | 10.4% (153,515) |
Median non-family income in West Point-Wilseyville in 2022:| West Point-Wilseyville: | $51,781 |
| State: | $56,558 |
Change in median non-family income between 2000 and 2022:| West Point-Wilseyville, California: | +99.2% |
| State: | +100.2% |
Median per capita income in West Point-Wilseyville in 2022:| West Point-Wilseyville: | $30,821 |
| State: | $32,124 |
Change in median per capita income between 2000 and 2022:| West Point-Wilseyville, California: | +111.2% |
| California: | +120.4% |
Income statistics for other residents
Number of households with income < $10k:| West Point-Wilseyville: | 4.6% (31) |
| State: | 4.6% (93,035) |
Number of households with income $10k - 20k:| West Point-Wilseyville: | 6.4% (43) |
| California: | 6.3% (126,222) |
Number of households with income $20k - 30k:| West Point-Wilseyville: | 7.2% (49) |
| State: | 7.1% (142,656) |
Number of households with income $30k - 40k:| West Point-Wilseyville: | 8.1% (55) |
| California: | 8.2% (165,018) |
Number of households with income $40k - 50k:| West Point-Wilseyville: | 8.0% (54) |
| California: | 8.0% (161,732) |
Number of households with income $50k - 60k:| West Point-Wilseyville: | 7.5% (51) |
| State: | 7.6% (152,152) |
Number of households with income $60k - 75k:| West Point-Wilseyville: | 10.5% (71) |
| State: | 10.4% (209,951) |
Number of households with income $75k - 100k:| West Point-Wilseyville: | 14.8% (100) |
| State: | 14.7% (296,102) |
Number of households with income $100k - 125k:| West Point-Wilseyville: | 10.6% (72) |
| State: | 10.7% (214,281) |
Number of households with income $125k - 150k:| West Point-Wilseyville: | 7.1% (48) |
| California: | 7.1% (143,092) |
Number of households with income $150k - 200k:| West Point-Wilseyville: | 8.6% (58) |
| State: | 8.6% (172,215) |
Number of households with income > $200k:| West Point-Wilseyville: | 6.6% (45) |
| State: | 6.7% (134,102) |
Aggregate household income in West Point-Wilseyville in 2022: $60,542,648
Median family income in West Point-Wilseyville in 2022:| West Point-Wilseyville: | $95,545 |
| State: | $72,756 |
Number of families with income < $10k:| West Point-Wilseyville: | 10.0% (4) |
| State: | 4.3% (69,090) |
Number of families with income $20k - 30k:| West Point-Wilseyville: | 11.7% (5) |
| California: | 7.0% (112,854) |
Number of families with income $40k - 50k:| West Point-Wilseyville: | 78.3% (31) |
| State: | 8.4% (135,353) |
Median per capita income in West Point-Wilseyville in 2022:| West Point-Wilseyville: | $21,335 |
| California: | $25,164 |
Change in median per capita income between 2000 and 2022:| West Point-Wilseyville, California: | +138.7% |
| State: | +137.9% |