Nutley, New Jersey (NJ) income map, earnings map, and wages data
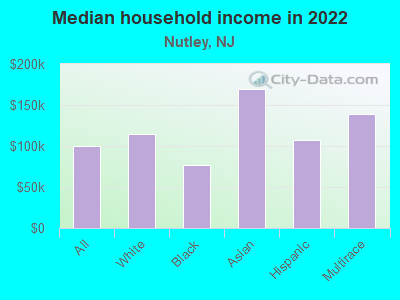
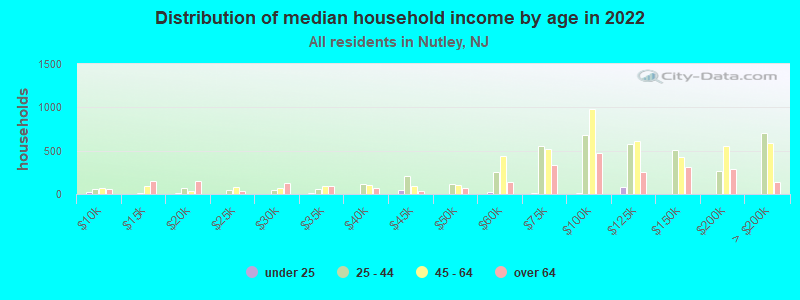
The median household income in Nutley, NJ in 2022 was $99,505, which was 3.2% greater than the median annual income of $96,346 across the entire state of New Jersey. Compared to the median income of $59,634 in 2000 this represents an increase of 40.1%. The per capita income in 2022 was $53,011, which means an increase of 47.1% compared to 2000 when it was $28,039.
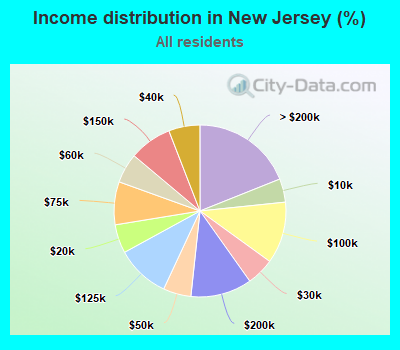
Income statistics for all residents
Median household income in Nutley, NJ in 2022:| Nutley: | $99,506 |
| State: | $96,346 |
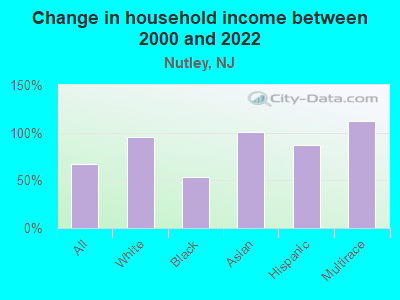
Change in median household income between 2000 and 2022:| Nutley, New Jersey: | +66.9% |
| State: | +74.7% |
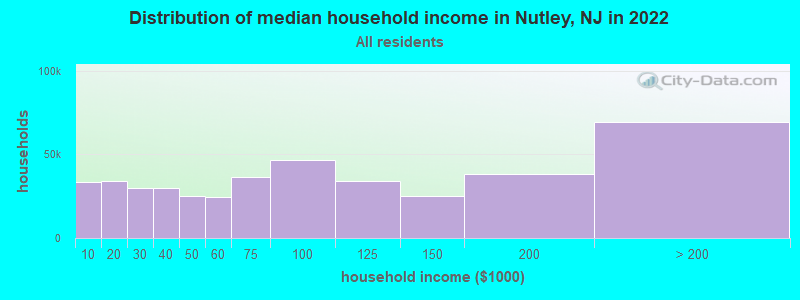
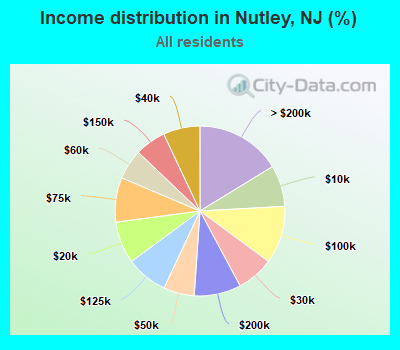
Number of households with income < $10k:| Nutley: | 7.9% (33,591) |
| State: | 4.4% (155,271) |
Number of households with income $10k - 20k:| Nutley: | 8.0% (34,118) |
| State: | 5.4% (189,888) |
Number of households with income $20k - 30k:| Nutley: | 7.1% (30,094) |
| State: | 5.2% (183,402) |
Number of households with income $30k - 40k:| Nutley: | 7.0% (29,811) |
| State: | 5.9% (206,969) |
Number of households with income $40k - 50k:| Nutley: | 5.9% (25,032) |
| New Jersey: | 5.2% (184,153) |
Number of households with income $50k - 60k:| Nutley: | 5.7% (24,410) |
| State: | 5.6% (197,270) |
Number of households with income $60k - 75k:| Nutley: | 8.5% (36,166) |
| State: | 8.1% (284,245) |
Number of households with income $75k - 100k:| Nutley: | 11.0% (46,851) |
| State: | 11.6% (408,272) |
Number of households with income $100k - 125k:| Nutley: | 7.9% (33,841) |
| State: | 10.1% (354,738) |
Number of households with income $125k - 150k:| Nutley: | 5.9% (25,148) |
| State: | 8.0% (281,341) |
Number of households with income $150k - 200k:| Nutley: | 8.9% (38,016) |
| New Jersey: | 11.5% (404,977) |
Number of households with income > $200k:| Nutley: | 16.3% (69,335) |
| New Jersey: | 18.9% (666,452) |
Aggregate household income in Nutley in 2022: $14,270,679,306
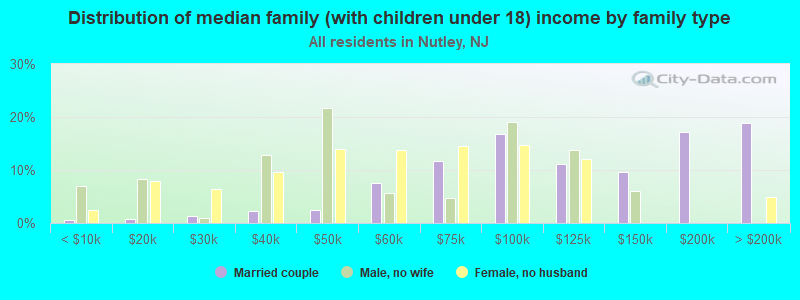
Median family income in Nutley in 2022:| Nutley: | $132,885 |
| New Jersey: | $117,988 |
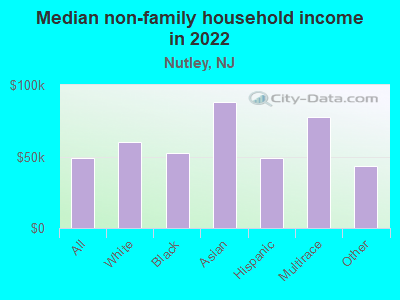
Median non-family income in Nutley in 2022:| Nutley: | $48,737 |
| New Jersey: | $54,589 |
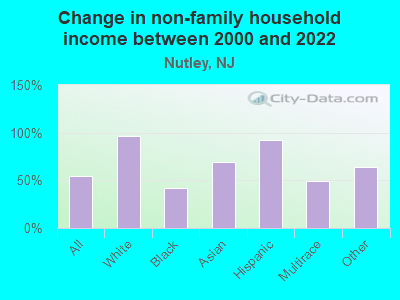
Change in median non-family income between 2000 and 2022:| Nutley, New Jersey: | +54.4% |
| State: | +74.4% |
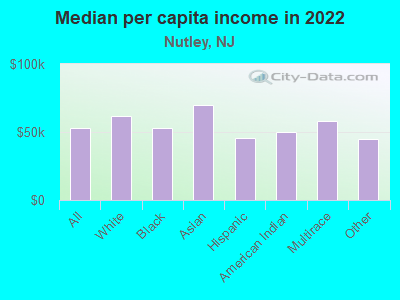
Median per capita income in Nutley in 2022:| Nutley: | $53,011 |
| New Jersey: | $51,272 |
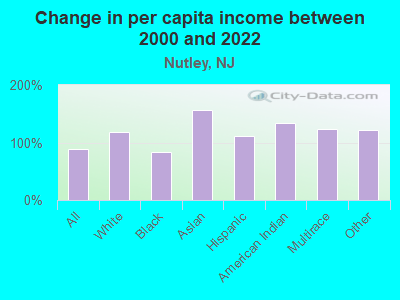
Change in median per capita income between 2000 and 2022:| Nutley, New Jersey: | +89.1% |
| State: | +89.9% |
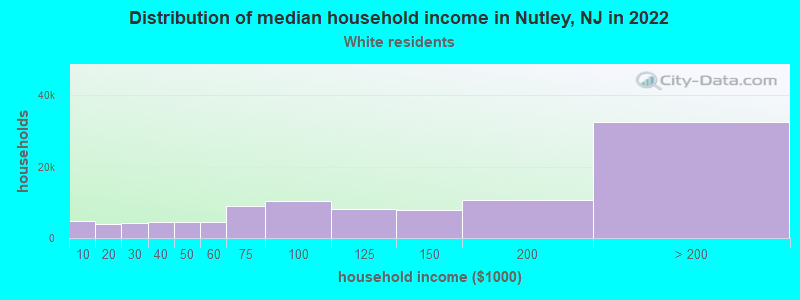
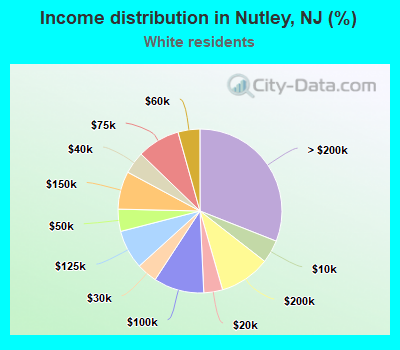
Income statistics for White residents
Median household income in Nutley, NJ in 2022:| Nutley: | $114,684 |
| New Jersey: | $105,428 |
Change in median household income between 2000 and 2022:| Nutley, New Jersey: | +95.3% |
| New Jersey: | +78.2% |
Number of households with income < $10k:| Nutley: | 4.5% (4,756) |
| State: | 3.5% (73,676) |
Number of households with income $10k - 20k:| Nutley: | 3.7% (3,881) |
| State: | 4.3% (90,086) |
Number of households with income $20k - 30k:| Nutley: | 4.1% (4,275) |
| State: | 4.7% (99,511) |
Number of households with income $30k - 40k:| Nutley: | 4.4% (4,591) |
| State: | 5.2% (109,051) |
Number of households with income $40k - 50k:| Nutley: | 4.4% (4,598) |
| State: | 4.9% (101,931) |
Number of households with income $50k - 60k:| Nutley: | 4.3% (4,531) |
| State: | 5.4% (112,379) |
Number of households with income $60k - 75k:| Nutley: | 8.5% (8,861) |
| State: | 7.7% (162,379) |
Number of households with income $75k - 100k:| Nutley: | 9.9% (10,426) |
| State: | 11.6% (242,478) |
Number of households with income $100k - 125k:| Nutley: | 7.7% (8,076) |
| State: | 10.4% (218,622) |
Number of households with income $125k - 150k:| Nutley: | 7.5% (7,831) |
| State: | 8.5% (177,925) |
Number of households with income $150k - 200k:| Nutley: | 10.0% (10,510) |
| State: | 12.5% (262,429) |
Number of households with income > $200k:| Nutley: | 31.0% (32,508) |
| State: | 21.3% (446,393) |
Aggregate household income in Nutley in 2022: $6,525,184,731
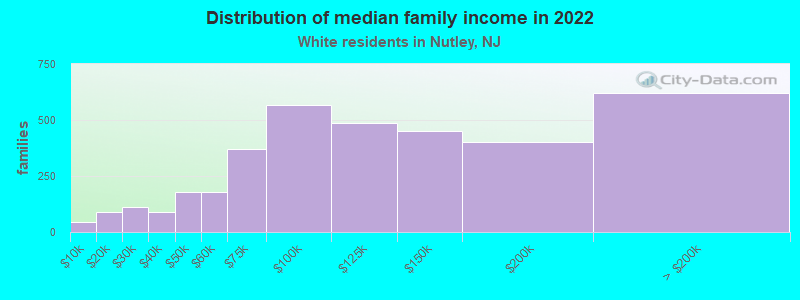
Median family income in Nutley in 2022:| Nutley: | $161,232 |
| New Jersey: | $133,117 |
Number of families with income < $10k:| Nutley: | 1.3% (45) |
| State: | 1.5% (21,094) |
Number of families with income $10k - 20k:| Nutley: | 2.5% (88) |
| New Jersey: | 1.9% (26,388) |
Number of families with income $20k - 30k:| Nutley: | 3.2% (113) |
| State: | 2.4% (33,161) |
Number of families with income $30k - 40k:| Nutley: | 2.5% (88) |
| New Jersey: | 3.2% (43,969) |
Number of families with income $40k - 50k:| Nutley: | 5.0% (178) |
| New Jersey: | 3.5% (48,685) |
Number of families with income $50k - 60k:| Nutley: | 5.0% (178) |
| State: | 4.1% (57,095) |
Number of families with income $60k - 75k:| Nutley: | 10.3% (370) |
| State: | 6.7% (92,267) |
Number of families with income $75k - 100k:| Nutley: | 15.9% (569) |
| State: | 11.5% (158,630) |
Number of families with income $100k - 125k:| Nutley: | 13.5% (485) |
| State: | 11.5% (158,059) |
Number of families with income $125k - 150k:| Nutley: | 12.5% (450) |
| State: | 9.8% (134,575) |
Number of families with income $150k - 200k:| Nutley: | 11.2% (401) |
| State: | 15.5% (212,728) |
Number of families with income > $200k:| Nutley: | 17.3% (622) |
| State: | 28.3% (389,541) |
Median non-family income in Nutley in 2022:| Nutley: | $60,130 |
| State: | $58,680 |
Change in median non-family income between 2000 and 2022:| Nutley, New Jersey: | +96.8% |
| New Jersey: | +81.6% |
Median per capita income in Nutley in 2022:| Nutley: | $62,020 |
| New Jersey: | $61,044 |
Change in median per capita income between 2000 and 2022:| Nutley, New Jersey: | +119.3% |
| New Jersey: | +101.8% |
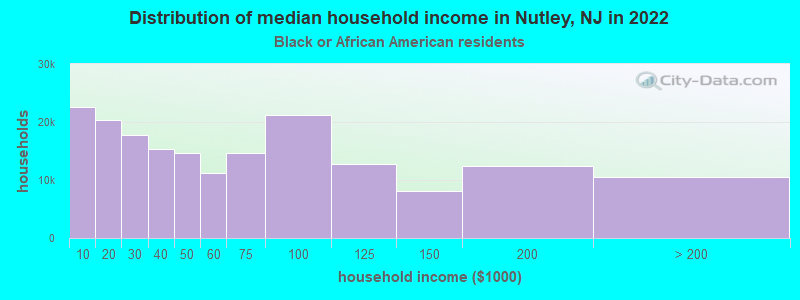
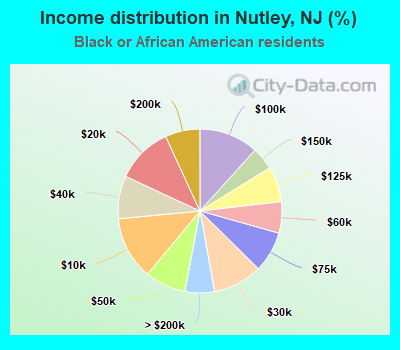
Income statistics for Black or African American residents
Median household income in Nutley, NJ in 2022:| Nutley: | $76,357 |
| State: | $65,850 |
Change in median household income between 2000 and 2022:| Nutley, New Jersey: | +53.6% |
| State: | +71.0% |
Number of households with income < $10k:| Nutley: | 12.4% (22,623) |
| State: | 8.9% (38,971) |
Number of households with income $10k - 20k:| Nutley: | 11.2% (20,340) |
| State: | 8.7% (38,456) |
Number of households with income $20k - 30k:| Nutley: | 9.7% (17,678) |
| New Jersey: | 7.3% (32,276) |
Number of households with income $30k - 40k:| Nutley: | 8.5% (15,380) |
| State: | 7.7% (33,867) |
Number of households with income $40k - 50k:| Nutley: | 8.1% (14,675) |
| State: | 7.5% (32,945) |
Number of households with income $50k - 60k:| Nutley: | 6.2% (11,225) |
| State: | 6.6% (29,115) |
Number of households with income $60k - 75k:| Nutley: | 8.1% (14,650) |
| State: | 8.9% (39,013) |
Number of households with income $75k - 100k:| Nutley: | 11.7% (21,289) |
| New Jersey: | 11.8% (51,915) |
Number of households with income $100k - 125k:| Nutley: | 7.0% (12,740) |
| State: | 9.1% (40,243) |
Number of households with income $125k - 150k:| Nutley: | 4.5% (8,150) |
| State: | 6.3% (27,533) |
Number of households with income $150k - 200k:| Nutley: | 6.9% (12,486) |
| New Jersey: | 8.3% (36,645) |
Number of households with income > $200k:| Nutley: | 5.8% (10,598) |
| State: | 8.9% (38,974) |
Aggregate household income in Nutley in 2022: $50,788,728
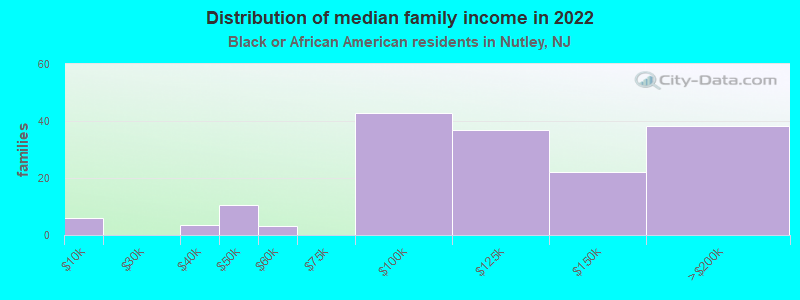
Median family income in Nutley in 2022:| Nutley: | $150,100 |
| State: | $81,896 |
Number of families with income < $10k:| Nutley: | 3.6% (6) |
| New Jersey: | 4.7% (12,431) |
Number of families with income $30k - 40k:| Nutley: | 2.1% (3) |
| State: | 7.2% (18,750) |
Number of families with income $40k - 50k:| Nutley: | 6.5% (11) |
| State: | 7.8% (20,518) |
Number of families with income $50k - 60k:| Nutley: | 1.9% (3) |
| State: | 6.8% (17,786) |
Number of families with income $75k - 100k:| Nutley: | 26.2% (43) |
| State: | 12.0% (31,349) |
Number of families with income $100k - 125k:| Nutley: | 22.7% (37) |
| State: | 10.8% (28,173) |
Number of families with income $125k - 150k:| Nutley: | 13.5% (22) |
| State: | 8.2% (21,536) |
Number of families with income $150k - 200k:| Nutley: | 23.4% (38) |
| State: | 11.1% (29,034) |
Median non-family income in Nutley in 2022:| Nutley: | $52,260 |
| State: | $40,126 |
Change in median non-family income between 2000 and 2022:| Nutley, New Jersey: | +42.1% |
| State: | +64.3% |
Median per capita income in Nutley in 2022:| Nutley: | $53,267 |
| New Jersey: | $35,632 |
Change in median per capita income between 2000 and 2022:| Nutley, New Jersey: | +82.9% |
| State: | +104.7% |
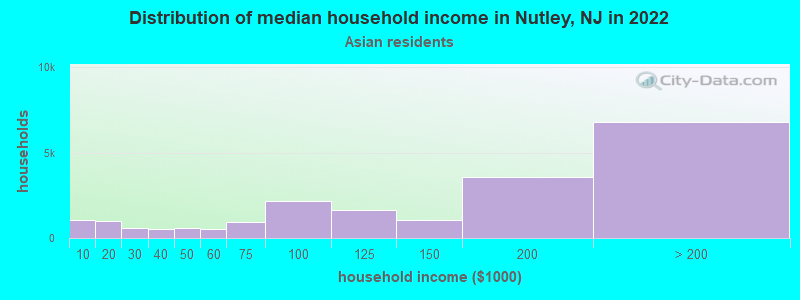
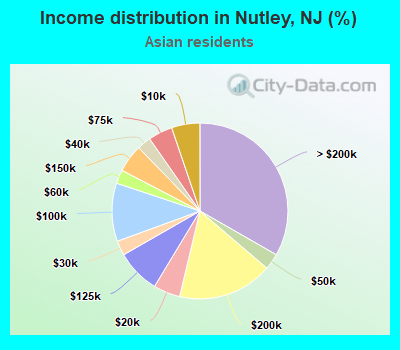
Income statistics for Asian residents
Median household income in Nutley, NJ in 2022:| Nutley: | $168,904 |
| New Jersey: | $144,878 |
Change in median household income between 2000 and 2022:| Nutley, New Jersey: | +101.5% |
| State: | +100.6% |
Number of households with income < $10k:| Nutley: | 5.2% (1,064) |
| State: | 3.8% (12,441) |
Number of households with income $10k - 20k:| Nutley: | 4.9% (1,001) |
| State: | 3.1% (9,957) |
Number of households with income $20k - 30k:| Nutley: | 2.7% (557) |
| State: | 3.1% (10,104) |
Number of households with income $30k - 40k:| Nutley: | 2.5% (520) |
| State: | 3.6% (11,819) |
Number of households with income $40k - 50k:| Nutley: | 3.0% (607) |
| New Jersey: | 2.6% (8,334) |
Number of households with income $50k - 60k:| Nutley: | 2.5% (518) |
| New Jersey: | 3.6% (11,799) |
Number of households with income $60k - 75k:| Nutley: | 4.5% (912) |
| State: | 5.4% (17,671) |
Number of households with income $75k - 100k:| Nutley: | 10.7% (2,179) |
| State: | 9.0% (29,301) |
Number of households with income $100k - 125k:| Nutley: | 8.1% (1,647) |
| State: | 9.6% (31,368) |
Number of households with income $125k - 150k:| Nutley: | 5.1% (1,040) |
| New Jersey: | 8.1% (26,318) |
Number of households with income $150k - 200k:| Nutley: | 17.5% (3,563) |
| New Jersey: | 14.3% (46,703) |
Number of households with income > $200k:| Nutley: | 33.3% (6,790) |
| State: | 33.8% (110,048) |
Aggregate household income in Nutley in 2022: $248,237,525
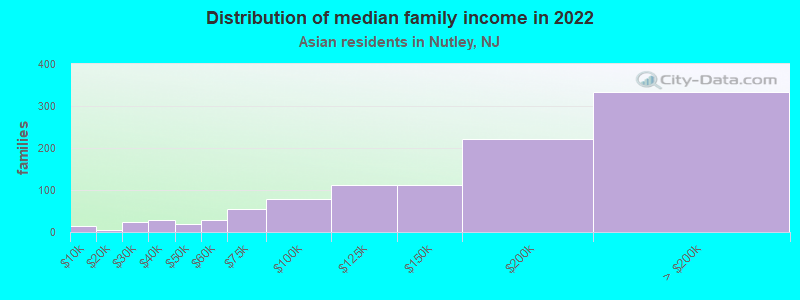
Median family income in Nutley in 2022:| Nutley: | $186,526 |
| State: | $162,032 |
Number of families with income < $10k:| Nutley: | 1.4% (15) |
| State: | 1.9% (4,949) |
Number of families with income $10k - 20k:| Nutley: | 0.4% (4) |
| State: | 1.9% (4,730) |
Number of families with income $20k - 30k:| Nutley: | 2.3% (24) |
| State: | 2.5% (6,325) |
Number of families with income $30k - 40k:| Nutley: | 2.7% (28) |
| State: | 2.9% (7,299) |
Number of families with income $40k - 50k:| Nutley: | 1.9% (20) |
| State: | 2.1% (5,357) |
Number of families with income $50k - 60k:| Nutley: | 2.8% (29) |
| New Jersey: | 3.1% (7,987) |
Number of families with income $60k - 75k:| Nutley: | 5.4% (55) |
| State: | 4.9% (12,419) |
Number of families with income $75k - 100k:| Nutley: | 7.6% (78) |
| State: | 7.9% (20,102) |
Number of families with income $100k - 125k:| Nutley: | 10.8% (111) |
| New Jersey: | 9.2% (23,481) |
Number of families with income $125k - 150k:| Nutley: | 10.8% (111) |
| State: | 8.7% (22,147) |
Number of families with income $150k - 200k:| Nutley: | 21.5% (221) |
| New Jersey: | 16.0% (40,707) |
Number of families with income > $200k:| Nutley: | 32.4% (333) |
| New Jersey: | 38.9% (99,016) |
Median non-family income in Nutley in 2022:| Nutley: | $87,935 |
| New Jersey: | $77,902 |
Change in median non-family income between 2000 and 2022:| Nutley, New Jersey: | +69.0% |
| New Jersey: | +69.1% |
Median per capita income in Nutley in 2022:| Nutley: | $69,935 |
| State: | $62,411 |
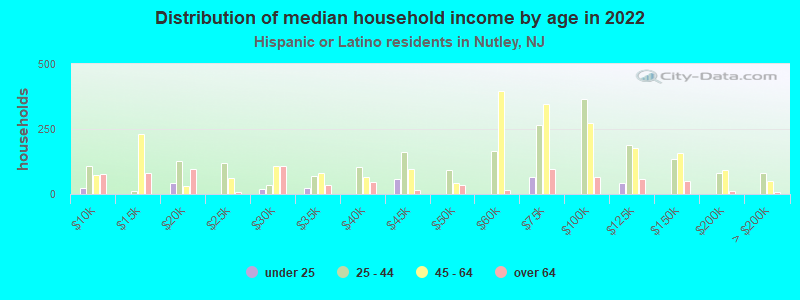
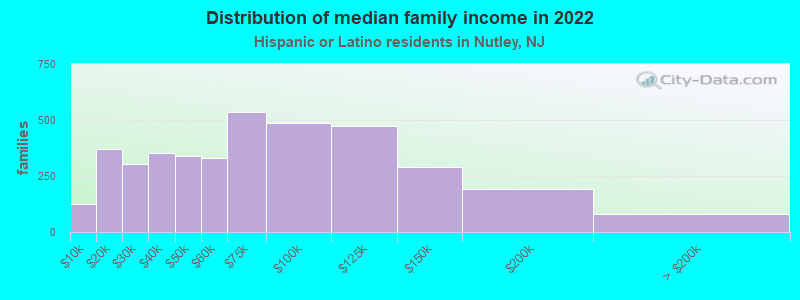
Income statistics for Hispanic or Latino residents
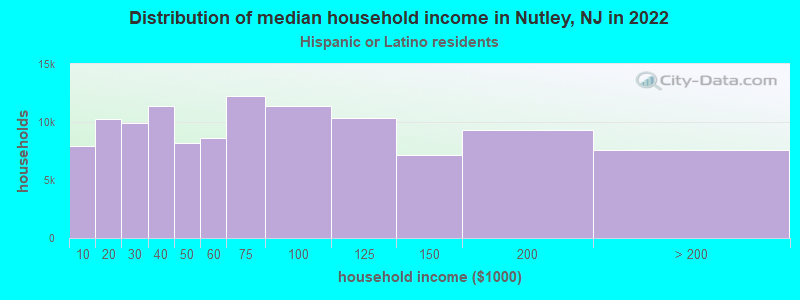
Median household income in Nutley, NJ in 2022:| Nutley: | $107,598 |
| State: | $72,170 |
Change in median household income between 2000 and 2022:| Nutley, New Jersey: | +87.4% |
| State: | +82.2% |
Number of households with income < $10k:| Nutley: | 6.9% (7,902) |
| State: | 4.6% (29,004) |
Number of households with income $10k - 20k:| Nutley: | 9.0% (10,271) |
| New Jersey: | 7.9% (50,233) |
Number of households with income $20k - 30k:| Nutley: | 8.7% (9,917) |
| New Jersey: | 6.7% (42,724) |
Number of households with income $30k - 40k:| Nutley: | 9.9% (11,364) |
| New Jersey: | 8.3% (52,621) |
Number of households with income $40k - 50k:| Nutley: | 7.2% (8,220) |
| State: | 6.6% (41,539) |
Number of households with income $50k - 60k:| Nutley: | 7.5% (8,622) |
| State: | 6.9% (43,976) |
Number of households with income $60k - 75k:| Nutley: | 10.7% (12,284) |
| State: | 10.4% (66,157) |
Number of households with income $75k - 100k:| Nutley: | 9.9% (11,369) |
| State: | 12.7% (80,102) |
Number of households with income $100k - 125k:| Nutley: | 9.1% (10,379) |
| New Jersey: | 10.1% (63,832) |
Number of households with income $125k - 150k:| Nutley: | 6.3% (7,154) |
| New Jersey: | 7.6% (47,874) |
Number of households with income $150k - 200k:| Nutley: | 8.1% (9,320) |
| State: | 8.3% (52,287) |
Number of households with income > $200k:| Nutley: | 6.6% (7,582) |
| State: | 9.9% (62,842) |
Aggregate household income in Nutley in 2022: $143,031,459
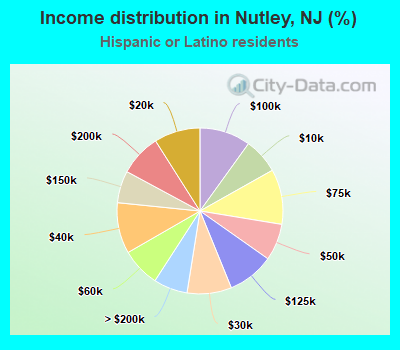
Median family income in Nutley in 2022:| Nutley: | $124,315 |
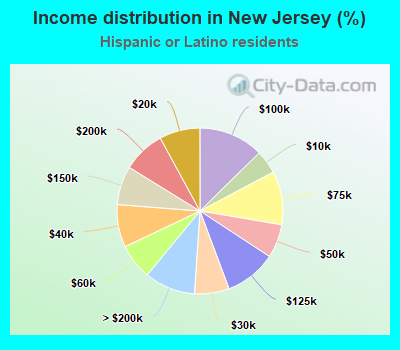
| New Jersey: | $77,272 |
Number of families with income < $10k:| Nutley: | 3.2% (125) |
| State: | 3.1% (14,686) |
Number of families with income $10k - 20k:| Nutley: | 9.6% (372) |
| New Jersey: | 6.0% (28,023) |
Number of families with income $20k - 30k:| Nutley: | 7.8% (304) |
| New Jersey: | 6.5% (30,501) |
Number of families with income $30k - 40k:| Nutley: | 9.1% (354) |
| New Jersey: | 8.3% (38,883) |
Number of families with income $40k - 50k:| Nutley: | 8.8% (341) |
| New Jersey: | 7.2% (33,778) |
Number of families with income $50k - 60k:| Nutley: | 8.5% (331) |
| State: | 6.7% (31,451) |
Number of families with income $60k - 75k:| Nutley: | 13.8% (535) |
| State: | 11.1% (52,120) |
Number of families with income $75k - 100k:| Nutley: | 12.6% (488) |
| New Jersey: | 13.3% (62,373) |
Number of families with income $100k - 125k:| Nutley: | 12.2% (472) |
| State: | 10.9% (51,355) |
Number of families with income $125k - 150k:| Nutley: | 7.5% (291) |
| State: | 7.5% (35,076) |
Number of families with income $150k - 200k:| Nutley: | 5.0% (194) |
| New Jersey: | 8.7% (40,972) |
Number of families with income > $200k:| Nutley: | 2.0% (80) |
| State: | 10.9% (51,269) |
Median non-family income in Nutley in 2022:| Nutley: | $48,664 |
| New Jersey: | $43,028 |
Change in median non-family income between 2000 and 2022:| Nutley, New Jersey: | +92.7% |
| State: | +82.5% |
Median per capita income in Nutley in 2022:| Nutley: | $45,668 |
| State: | $30,987 |
Change in median per capita income between 2000 and 2022:| Nutley, New Jersey: | +111.2% |
| State: | +109.3% |
Income statistics for American Indian and Alaska Native residents
Number of households with income < $10k:| Nutley: | 5.3% (874) |
| State: | 5.3% (760) |
Number of households with income $10k - 20k:| Nutley: | 4.6% (747) |
| New Jersey: | 4.6% (649) |
Number of households with income $20k - 30k:| Nutley: | 3.7% (605) |
| State: | 3.7% (526) |
Number of households with income $30k - 40k:| Nutley: | 5.0% (812) |
| State: | 5.0% (706) |
Number of households with income $40k - 50k:| Nutley: | 8.1% (1,322) |
| New Jersey: | 8.1% (1,149) |
Number of households with income $50k - 60k:| Nutley: | 11.5% (1,892) |
| State: | 11.5% (1,645) |
Number of households with income $60k - 75k:| Nutley: | 12.3% (2,023) |
| New Jersey: | 12.3% (1,759) |
Number of households with income $75k - 100k:| Nutley: | 9.2% (1,515) |
| New Jersey: | 9.2% (1,317) |
Number of households with income $100k - 125k:| Nutley: | 6.5% (1,059) |
| New Jersey: | 6.5% (921) |
Number of households with income $125k - 150k:| Nutley: | 13.8% (2,259) |
| State: | 13.8% (1,964) |
Number of households with income $150k - 200k:| Nutley: | 14.5% (2,376) |
| State: | 14.5% (2,066) |
Number of households with income > $200k:| Nutley: | 5.5% (909) |
| New Jersey: | 5.5% (790) |
Median per capita income in Nutley in 2022:| Nutley: | $50,357 |
| State: | $28,858 |
Change in median per capita income between 2000 and 2022:| Nutley, New Jersey: | +134.2% |
| State: | +54.4% |
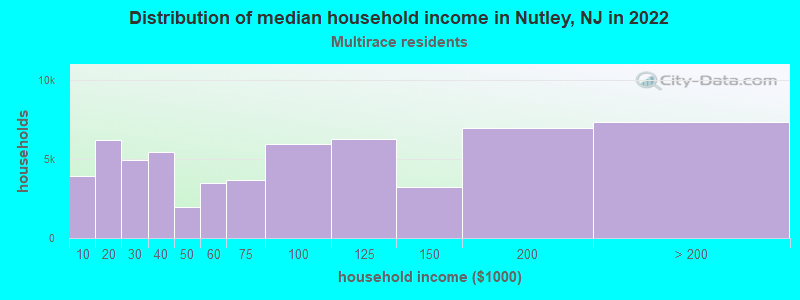
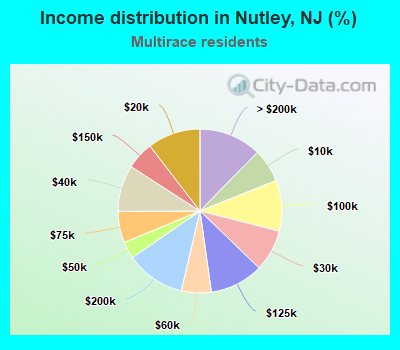
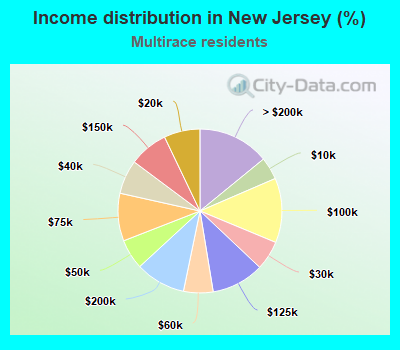
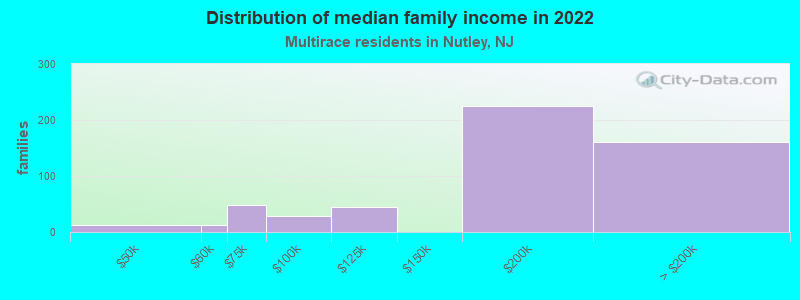
Income statistics for Multirace residents
Median household income in Nutley, NJ in 2022:| Nutley: | $139,051 |
| New Jersey: | $84,272 |
Change in median household income between 2000 and 2022:| Nutley, New Jersey: | +112.3% |
| State: | +101.4% |
Number of households with income < $10k:| Nutley: | 6.6% (3,918) |
| New Jersey: | 4.4% (15,172) |
Number of households with income $10k - 20k:| Nutley: | 10.5% (6,209) |
| New Jersey: | 7.1% (24,399) |
Number of households with income $20k - 30k:| Nutley: | 8.3% (4,912) |
| New Jersey: | 5.8% (19,827) |
Number of households with income $30k - 40k:| Nutley: | 9.2% (5,459) |
| State: | 6.7% (23,047) |
Number of households with income $40k - 50k:| Nutley: | 3.3% (1,986) |
| State: | 5.9% (20,379) |
Number of households with income $50k - 60k:| Nutley: | 5.9% (3,500) |
| State: | 5.8% (19,984) |
Number of households with income $60k - 75k:| Nutley: | 6.2% (3,668) |
| State: | 9.4% (32,244) |
Number of households with income $75k - 100k:| Nutley: | 10.0% (5,948) |
| State: | 12.8% (43,746) |
Number of households with income $100k - 125k:| Nutley: | 10.6% (6,274) |
| New Jersey: | 10.4% (35,588) |
Number of households with income $125k - 150k:| Nutley: | 5.4% (3,229) |
| New Jersey: | 7.7% (26,354) |
Number of households with income $150k - 200k:| Nutley: | 11.7% (6,961) |
| State: | 9.9% (33,977) |
Number of households with income > $200k:| Nutley: | 12.3% (7,333) |
| State: | 14.1% (48,377) |
Aggregate household income in Nutley in 2022: $56,237,070
Median family income in Nutley in 2022:| Nutley: | $168,904 |
| New Jersey: | $91,937 |
Number of families with income $40k - 50k:| Nutley: | 2.5% (13) |
| New Jersey: | 6.3% (15,201) |
Number of families with income $50k - 60k:| Nutley: | 2.4% (13) |
| State: | 5.1% (12,262) |
Number of families with income $60k - 75k:| Nutley: | 9.0% (48) |
| State: | 10.0% (24,160) |
Number of families with income $75k - 100k:| Nutley: | 5.3% (28) |
| State: | 12.6% (30,507) |
Number of families with income $100k - 125k:| Nutley: | 8.5% (45) |
| New Jersey: | 10.5% (25,338) |
Number of families with income $150k - 200k:| Nutley: | 42.2% (225) |
| State: | 11.4% (27,656) |
Number of families with income > $200k:| Nutley: | 30.1% (160) |
| State: | 16.8% (40,705) |
Median non-family income in Nutley in 2022:| Nutley: | $77,825 |
| State: | $53,768 |
Change in median non-family income between 2000 and 2022:| Nutley, New Jersey: | +48.9% |
| State: | +98.7% |
Median per capita income in Nutley in 2022:| Nutley: | $58,253 |
| New Jersey: | $36,016 |
Change in median per capita income between 2000 and 2022:| Nutley, New Jersey: | +122.8% |
| State: | +129.2% |
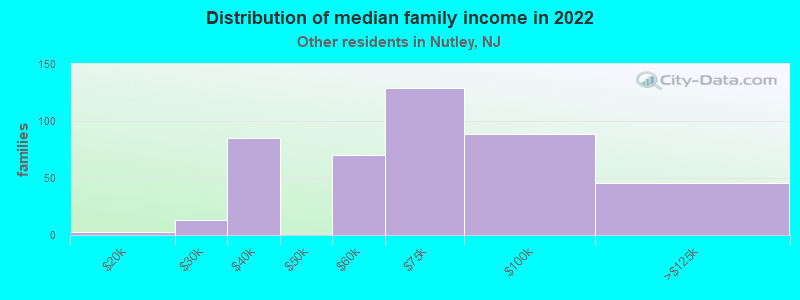
Income statistics for other residents
Number of households with income < $10k:| Nutley: | 5.9% (43) |
| State: | 4.7% (13,969) |
Number of households with income $10k - 20k:| Nutley: | 9.9% (72) |
| New Jersey: | 8.9% (26,341) |
Number of households with income $20k - 30k:| Nutley: | 8.4% (61) |
| State: | 7.1% (21,158) |
Number of households with income $30k - 40k:| Nutley: | 10.2% (74) |
| State: | 9.6% (28,479) |
Number of households with income $40k - 50k:| Nutley: | 6.5% (47) |
| State: | 6.6% (19,415) |
Number of households with income $50k - 60k:| Nutley: | 9.3% (67) |
| State: | 7.5% (22,348) |
Number of households with income $60k - 75k:| Nutley: | 12.3% (89) |
| State: | 10.5% (31,179) |
Number of households with income $75k - 100k:| Nutley: | 12.4% (90) |
| State: | 13.3% (39,515) |
Number of households with income $100k - 125k:| Nutley: | 9.4% (68) |
| State: | 9.4% (27,806) |
Number of households with income $125k - 150k:| Nutley: | 6.6% (48) |
| State: | 7.1% (20,898) |
Number of households with income $150k - 200k:| Nutley: | 5.9% (43) |
| State: | 7.8% (23,101) |
Number of households with income > $200k:| Nutley: | 3.0% (22) |
| State: | 7.4% (21,791) |
Aggregate household income in Nutley in 2022: $60,182,085
Median family income in Nutley in 2022:| Nutley: | $113,821 |
| State: | $69,615 |
Number of families with income $10k - 20k:| Nutley: | 0.8% (3) |
| State: | 7.1% (16,432) |
Number of families with income $20k - 30k:| Nutley: | 3.0% (13) |
| State: | 7.4% (17,149) |
Number of families with income $30k - 40k:| Nutley: | 19.5% (85) |
| State: | 9.8% (22,795) |
Number of families with income $50k - 60k:| Nutley: | 16.0% (70) |
| New Jersey: | 7.9% (18,395) |
Number of families with income $60k - 75k:| Nutley: | 29.7% (129) |
| State: | 11.1% (25,704) |
Number of families with income $75k - 100k:| Nutley: | 20.4% (89) |
| State: | 14.1% (32,679) |
Number of families with income $100k - 125k:| Nutley: | 10.6% (46) |
| New Jersey: | 10.3% (23,792) |
Median non-family income in Nutley in 2022:| Nutley: | $43,075 |
| New Jersey: | $34,676 |
Change in median non-family income between 2000 and 2022:| Nutley, New Jersey: | +63.7% |
| State: | +48.9% |
Median per capita income in Nutley in 2022:| Nutley: | $45,155 |
| State: | $27,830 |
Change in median per capita income between 2000 and 2022:| Nutley, New Jersey: | +121.6% |
| State: | +117.5% |