Norfolk, Massachusetts (MA) income map, earnings map, and wages data
The median household income in Norfolk, MA in 2022 was $157,508, which was 40.0% greater than the median annual income of $94,488 across the entire state of Massachusetts. Compared to the median income of $86,153 in 2000 this represents an increase of 45.3%. The per capita income in 2022 was $66,104, which means an increase of 50.9% compared to 2000 when it was $32,454.
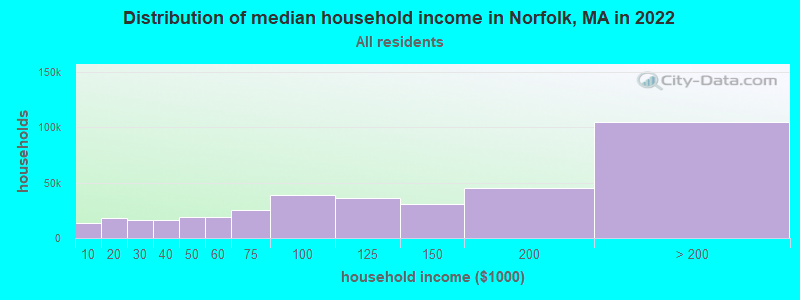
Income statistics for all residents
Median household income in Norfolk, MA in 2022:| Norfolk: | $157,508 |
| State: | $94,488 |
Change in median household income between 2000 and 2022:| Norfolk, Massachusetts: | +82.8% |
| Massachusetts: | +87.1% |
Number of households with income < $10k:| Norfolk: | 3.6% (13,613) |
| Massachusetts: | 5.2% (146,170) |
Number of households with income $10k - 20k:| Norfolk: | 4.8% (18,288) |
| State: | 6.4% (180,001) |
Number of households with income $20k - 30k:| Norfolk: | 4.3% (16,497) |
| Massachusetts: | 5.6% (156,667) |
Number of households with income $30k - 40k:| Norfolk: | 4.2% (16,149) |
| State: | 5.6% (157,168) |
Number of households with income $40k - 50k:| Norfolk: | 5.0% (19,197) |
| State: | 5.4% (151,455) |
Number of households with income $50k - 60k:| Norfolk: | 5.0% (19,060) |
| State: | 5.1% (142,726) |
Number of households with income $60k - 75k:| Norfolk: | 6.6% (25,162) |
| State: | 7.6% (212,203) |
Number of households with income $75k - 100k:| Norfolk: | 10.1% (38,654) |
| State: | 11.3% (317,064) |
Number of households with income $100k - 125k:| Norfolk: | 9.5% (36,428) |
| State: | 9.7% (270,603) |
Number of households with income $125k - 150k:| Norfolk: | 7.9% (30,297) |
| State: | 8.0% (223,140) |
Number of households with income $150k - 200k:| Norfolk: | 11.7% (44,901) |
| State: | 11.0% (308,695) |
Number of households with income > $200k:| Norfolk: | 27.3% (104,547) |
| State: | 19.0% (531,884) |
Aggregate household income in Norfolk in 2022: $7,138,009,122
Median family income in Norfolk in 2022:| Norfolk: | $181,891 |
| State: | $120,263 |
Median non-family income in Norfolk in 2022:| Norfolk: | $71,133 |
| State: | $55,979 |
Change in median non-family income between 2000 and 2022:| Norfolk, Massachusetts: | +73.0% |
| State: | +88.0% |
Median per capita income in Norfolk in 2022:| Norfolk: | $66,105 |
| Massachusetts: | $54,025 |
Change in median per capita income between 2000 and 2022:| Norfolk, Massachusetts: | +103.7% |
| State: | +108.2% |
Income statistics for White residents
Median household income in Norfolk, MA in 2022:| Norfolk: | $158,352 |
| Massachusetts: | $101,391 |
Change in median household income between 2000 and 2022:| Norfolk, Massachusetts: | +85.3% |
| State: | +93.3% |
Number of households with income < $10k:| Norfolk: | 3.3% (9,159) |
| State: | 4.4% (91,120) |
Number of households with income $10k - 20k:| Norfolk: | 4.7% (13,058) |
| State: | 5.9% (122,055) |
Number of households with income $20k - 30k:| Norfolk: | 4.3% (12,072) |
| Massachusetts: | 5.1% (105,311) |
Number of households with income $30k - 40k:| Norfolk: | 4.2% (11,820) |
| Massachusetts: | 5.3% (110,239) |
Number of households with income $40k - 50k:| Norfolk: | 5.3% (14,785) |
| State: | 5.0% (104,636) |
Number of households with income $50k - 60k:| Norfolk: | 4.5% (12,564) |
| State: | 4.8% (99,486) |
Number of households with income $60k - 75k:| Norfolk: | 6.2% (17,395) |
| Massachusetts: | 7.5% (155,124) |
Number of households with income $75k - 100k:| Norfolk: | 10.2% (28,459) |
| State: | 11.4% (236,252) |
Number of households with income $100k - 125k:| Norfolk: | 9.2% (25,699) |
| State: | 9.9% (204,731) |
Number of households with income $125k - 150k:| Norfolk: | 8.2% (22,943) |
| State: | 8.5% (175,324) |
Number of households with income $150k - 200k:| Norfolk: | 11.7% (32,775) |
| Massachusetts: | 11.7% (242,980) |
Number of households with income > $200k:| Norfolk: | 28.4% (79,458) |
| Massachusetts: | 20.5% (425,966) |
Aggregate household income in Norfolk in 2022: $5,306,595,648
Median family income in Norfolk in 2022:| Norfolk: | $187,898 |
| State: | $133,153 |
Number of families with income < $10k:| Norfolk: | 0.2% (5) |
| State: | 2.0% (25,038) |
Number of families with income $10k - 20k:| Norfolk: | 0.6% (14) |
| State: | 2.1% (26,403) |
Number of families with income $20k - 30k:| Norfolk: | 0.9% (22) |
| State: | 2.6% (32,525) |
Number of families with income $30k - 40k:| Norfolk: | 1.1% (27) |
| State: | 3.9% (48,079) |
Number of families with income $40k - 50k:| Norfolk: | 1.9% (46) |
| State: | 3.8% (46,908) |
Number of families with income $50k - 60k:| Norfolk: | 1.5% (34) |
| Massachusetts: | 3.8% (46,476) |
Number of families with income $60k - 75k:| Norfolk: | 4.9% (117) |
| State: | 6.4% (79,040) |
Number of families with income $75k - 100k:| Norfolk: | 10.3% (244) |
| State: | 11.1% (137,395) |
Number of families with income $100k - 125k:| Norfolk: | 8.2% (194) |
| State: | 11.1% (136,771) |
Number of families with income $125k - 150k:| Norfolk: | 11.4% (271) |
| State: | 10.0% (123,709) |
Number of families with income $150k - 200k:| Norfolk: | 13.1% (311) |
| Massachusetts: | 14.7% (181,602) |
Number of families with income > $200k:| Norfolk: | 45.9% (1,088) |
| Massachusetts: | 28.5% (351,887) |
Median non-family income in Norfolk in 2022:| Norfolk: | $69,436 |
| Massachusetts: | $59,323 |
Change in median non-family income between 2000 and 2022:| Norfolk, Massachusetts: | +73.0% |
| State: | +94.3% |
Median per capita income in Norfolk in 2022:| Norfolk: | $73,793 |
| Massachusetts: | $60,804 |
Change in median per capita income between 2000 and 2022:| Norfolk, Massachusetts: | +114.1% |
| Massachusetts: | +118.7% |
Income statistics for Black or African American residents
Median household income in Norfolk, MA in 2022:| Norfolk: | $317,088 |
| State: | $63,189 |
Change in median household income between 2000 and 2022:| Norfolk, Massachusetts: | +58.5% |
| State: | +87.4% |
Number of households with income < $10k:| Norfolk: | 5.5% (3,169) |
| State: | 9.1% (15,797) |
Number of households with income $10k - 20k:| Norfolk: | 7.2% (4,176) |
| State: | 9.4% (16,267) |
Number of households with income $20k - 30k:| Norfolk: | 4.9% (2,842) |
| Massachusetts: | 7.8% (13,520) |
Number of households with income $30k - 40k:| Norfolk: | 6.6% (3,796) |
| State: | 8.3% (14,412) |
Number of households with income $40k - 50k:| Norfolk: | 6.1% (3,542) |
| Massachusetts: | 7.9% (13,790) |
Number of households with income $50k - 60k:| Norfolk: | 5.7% (3,299) |
| State: | 5.8% (10,041) |
Number of households with income $60k - 75k:| Norfolk: | 8.6% (4,977) |
| Massachusetts: | 8.5% (14,822) |
Number of households with income $75k - 100k:| Norfolk: | 8.7% (5,013) |
| Massachusetts: | 11.0% (19,122) |
Number of households with income $100k - 125k:| Norfolk: | 14.7% (8,489) |
| Massachusetts: | 8.4% (14,575) |
Number of households with income $125k - 150k:| Norfolk: | 11.1% (6,428) |
| State: | 6.0% (10,429) |
Number of households with income $150k - 200k:| Norfolk: | 7.6% (4,413) |
| State: | 7.2% (12,539) |
Number of households with income > $200k:| Norfolk: | 13.4% (7,759) |
| State: | 10.5% (18,185) |
Aggregate household income in Norfolk in 2022: $13,836,676
Median family income in Norfolk in 2022:| Norfolk: | $194,787 |
| State: | $79,815 |
Number of families with income $125k - 150k:| Norfolk: | 100.0% (40) |
| State: | 7.5% (8,277) |
Median non-family income in Norfolk in 2022:| Norfolk: | $373,003 |
| State: | $38,934 |
Change in median non-family income between 2000 and 2022:| Norfolk, Massachusetts: | +86.5% |
| State: | +69.2% |
Median per capita income in Norfolk in 2022:| Norfolk: | $33,404 |
| State: | $33,524 |
Change in median per capita income between 2000 and 2022:| Norfolk, Massachusetts: | +73.4% |
| State: | +109.4% |
Income statistics for Asian residents
Median household income in Norfolk, MA in 2022:| Norfolk: | $421,341 |
| Massachusetts: | $117,855 |
Change in median household income between 2000 and 2022:| Norfolk, Massachusetts: | +110.7% |
| Massachusetts: | +129.9% |
Number of households with income < $10k:| Norfolk: | 3.4% (3,429) |
| State: | 6.8% (11,982) |
Number of households with income $10k - 20k:| Norfolk: | 4.3% (4,379) |
| Massachusetts: | 4.8% (8,376) |
Number of households with income $20k - 30k:| Norfolk: | 3.1% (3,158) |
| State: | 3.7% (6,558) |
Number of households with income $30k - 40k:| Norfolk: | 4.0% (4,048) |
| Massachusetts: | 3.3% (5,748) |
Number of households with income $40k - 50k:| Norfolk: | 4.4% (4,474) |
| Massachusetts: | 4.1% (7,192) |
Number of households with income $50k - 60k:| Norfolk: | 6.7% (6,741) |
| State: | 5.0% (8,734) |
Number of households with income $60k - 75k:| Norfolk: | 8.2% (8,283) |
| State: | 5.8% (10,203) |
Number of households with income $75k - 100k:| Norfolk: | 7.5% (7,609) |
| State: | 8.6% (15,154) |
Number of households with income $100k - 125k:| Norfolk: | 7.0% (7,088) |
| Massachusetts: | 10.8% (18,942) |
Number of households with income $125k - 150k:| Norfolk: | 7.6% (7,694) |
| Massachusetts: | 8.0% (14,037) |
Number of households with income $150k - 200k:| Norfolk: | 14.8% (15,030) |
| State: | 12.5% (21,856) |
Number of households with income > $200k:| Norfolk: | 29.0% (29,357) |
| State: | 26.6% (46,694) |
Aggregate household income in Norfolk in 2022: $19,167,248
Median family income in Norfolk in 2022:| Norfolk: | $448,119 |
| Massachusetts: | $140,113 |
Number of families with income $10k - 20k:| Norfolk: | 4.2% (10) |
| State: | 3.5% (4,118) |
Number of families with income > $200k:| Norfolk: | 95.8% (236) |
| Massachusetts: | 34.0% (39,856) |
Median per capita income in Norfolk in 2022:| Norfolk: | $50,403 |
| Massachusetts: | $58,900 |
Change in median per capita income between 2000 and 2022:| Norfolk, Massachusetts: | +141.2% |
| State: | +174.6% |
Income statistics for Hispanic or Latino residents
Median household income in Norfolk, MA in 2022:| Norfolk: | $125,642 |
| State: | $61,523 |
Change in median household income between 2000 and 2022:| Norfolk, Massachusetts: | +79.8% |
| State: | +125.4% |
Number of households with income < $10k:| Norfolk: | 4.4% (696) |
| State: | 8.8% (25,307) |
Number of households with income $10k - 20k:| Norfolk: | 4.5% (711) |
| State: | 10.0% (28,653) |
Number of households with income $20k - 30k:| Norfolk: | 4.8% (755) |
| State: | 8.8% (25,189) |
Number of households with income $30k - 40k:| Norfolk: | 3.9% (610) |
| State: | 7.2% (20,822) |
Number of households with income $40k - 50k:| Norfolk: | 3.2% (507) |
| State: | 7.2% (20,817) |
Number of households with income $50k - 60k:| Norfolk: | 5.7% (908) |
| State: | 6.5% (18,748) |
Number of households with income $60k - 75k:| Norfolk: | 11.5% (1,813) |
| Massachusetts: | 8.8% (25,390) |
Number of households with income $75k - 100k:| Norfolk: | 12.4% (1,963) |
| Massachusetts: | 12.0% (34,488) |
Number of households with income $100k - 125k:| Norfolk: | 11.8% (1,864) |
| State: | 8.6% (24,599) |
Number of households with income $125k - 150k:| Norfolk: | 4.2% (663) |
| State: | 6.2% (17,743) |
Number of households with income $150k - 200k:| Norfolk: | 13.9% (2,202) |
| State: | 7.3% (21,017) |
Number of households with income > $200k:| Norfolk: | 19.7% (3,109) |
| Massachusetts: | 8.6% (24,606) |
Aggregate household income in Norfolk in 2022: $13,483,470
Median family income in Norfolk in 2022:| Norfolk: | $153,283 |
| State: | $66,072 |
Number of families with income < $10k:| Norfolk: | 1.1% (4) |
| State: | 6.2% (12,456) |
Number of families with income $10k - 20k:| Norfolk: | 1.7% (6) |
| State: | 6.0% (12,071) |
Number of families with income $20k - 30k:| Norfolk: | 5.1% (19) |
| State: | 10.1% (20,376) |
Number of families with income $30k - 40k:| Norfolk: | 2.8% (11) |
| State: | 8.2% (16,470) |
Number of families with income $40k - 50k:| Norfolk: | 4.2% (16) |
| State: | 7.4% (14,829) |
Number of families with income $50k - 60k:| Norfolk: | 3.1% (12) |
| State: | 7.3% (14,643) |
Number of families with income $60k - 75k:| Norfolk: | 12.1% (45) |
| State: | 10.6% (21,252) |
Number of families with income $75k - 100k:| Norfolk: | 15.7% (59) |
| State: | 12.0% (24,088) |
Number of families with income $100k - 125k:| Norfolk: | 10.2% (38) |
| State: | 8.9% (17,954) |
Number of families with income $125k - 150k:| Norfolk: | 13.0% (49) |
| State: | 6.9% (13,837) |
Number of families with income $150k - 200k:| Norfolk: | 11.4% (43) |
| Massachusetts: | 7.3% (14,683) |
Number of families with income > $200k:| Norfolk: | 19.7% (73) |
| State: | 9.3% (18,741) |
Median per capita income in Norfolk in 2022:| Norfolk: | $29,896 |
| State: | $28,993 |
Change in median per capita income between 2000 and 2022:| Norfolk, Massachusetts: | +100.6% |
| State: | +142.4% |
Income statistics for American Indian and Alaska Native residents
Median household income in Norfolk, MA in 2022:| Norfolk: | $298,710 |
| State: | $87,730 |
Change in median household income between 2000 and 2022:| Norfolk, Massachusetts: | +134.6% |
| Massachusetts: | +138.3% |
Number of households with income < $10k:| Norfolk: | 6.6% (1,560) |
| State: | 6.6% (451) |
Number of households with income $10k - 20k:| Norfolk: | 7.0% (1,646) |
| State: | 7.0% (476) |
Number of households with income $20k - 30k:| Norfolk: | 2.8% (664) |
| State: | 2.8% (192) |
Number of households with income $30k - 40k:| Norfolk: | 3.2% (754) |
| State: | 3.2% (218) |
Number of households with income $40k - 50k:| Norfolk: | 2.9% (688) |
| Massachusetts: | 2.9% (199) |
Number of households with income $50k - 60k:| Norfolk: | 9.9% (2,341) |
| State: | 9.9% (677) |
Number of households with income $60k - 75k:| Norfolk: | 11.5% (2,701) |
| State: | 11.5% (781) |
Number of households with income $75k - 100k:| Norfolk: | 9.2% (2,175) |
| State: | 9.2% (629) |
Number of households with income $100k - 125k:| Norfolk: | 6.0% (1,404) |
| State: | 6.0% (406) |
Number of households with income $125k - 150k:| Norfolk: | 13.5% (3,185) |
| Massachusetts: | 13.5% (921) |
Number of households with income $150k - 200k:| Norfolk: | 12.6% (2,971) |
| Massachusetts: | 12.6% (859) |
Number of households with income > $200k:| Norfolk: | 14.7% (3,469) |
| State: | 14.7% (1,003) |
Aggregate household income in Norfolk in 2022: $2,204,200
Median per capita income in Norfolk in 2022:| Norfolk: | $23,518 |
| Massachusetts: | $39,434 |
Change in median per capita income between 2000 and 2022:| Norfolk, Massachusetts: | +140.2% |
| Massachusetts: | +148.2% |
Income statistics for Multirace residents
Median household income in Norfolk, MA in 2022:| Norfolk: | $146,571 |
| State: | $71,552 |
Number of households with income < $10k:| Norfolk: | 5.3% (968) |
| Massachusetts: | 6.6% (15,127) |
Number of households with income $10k - 20k:| Norfolk: | 3.4% (611) |
| Massachusetts: | 9.2% (21,158) |
Number of households with income $20k - 30k:| Norfolk: | 5.8% (1,053) |
| State: | 7.8% (18,016) |
Number of households with income $30k - 40k:| Norfolk: | 3.1% (560) |
| State: | 7.9% (18,260) |
Number of households with income $40k - 50k:| Norfolk: | 1.6% (297) |
| State: | 5.6% (13,027) |
Number of households with income $50k - 60k:| Norfolk: | 5.6% (1,017) |
| Massachusetts: | 5.6% (12,909) |
Number of households with income $60k - 75k:| Norfolk: | 5.0% (910) |
| Massachusetts: | 9.0% (20,800) |
Number of households with income $75k - 100k:| Norfolk: | 12.7% (2,318) |
| State: | 12.1% (27,875) |
Number of households with income $100k - 125k:| Norfolk: | 12.8% (2,340) |
| State: | 8.1% (18,754) |
Number of households with income $125k - 150k:| Norfolk: | 5.0% (903) |
| State: | 6.8% (15,621) |
Number of households with income $150k - 200k:| Norfolk: | 9.9% (1,803) |
| Massachusetts: | 9.4% (21,618) |
Number of households with income > $200k:| Norfolk: | 29.9% (5,446) |
| State: | 12.0% (27,592) |
Aggregate household income in Norfolk in 2022: $62,241,668
Median family income in Norfolk in 2022:| Norfolk: | $157,408 |
| Massachusetts: | $78,380 |
Number of families with income $50k - 60k:| Norfolk: | 9.1% (44) |
| State: | 6.7% (10,445) |
Number of families with income > $200k:| Norfolk: | 90.9% (436) |
| State: | 14.0% (21,838) |
Median per capita income in Norfolk in 2022:| Norfolk: | $85,527 |
| State: | $34,029 |
Income statistics for other residents
Number of households with income < $10k:| Norfolk: | 8.4% (9,144) |
| State: | 8.4% (11,559) |
Number of households with income $10k - 20k:| Norfolk: | 8.4% (9,097) |
| State: | 8.4% (11,499) |
Number of households with income $20k - 30k:| Norfolk: | 9.5% (10,340) |
| Massachusetts: | 9.5% (13,070) |
Number of households with income $30k - 40k:| Norfolk: | 6.0% (6,559) |
| State: | 6.0% (8,291) |
Number of households with income $40k - 50k:| Norfolk: | 9.2% (9,977) |
| State: | 9.2% (12,611) |
Number of households with income $50k - 60k:| Norfolk: | 7.9% (8,606) |
| State: | 7.9% (10,879) |
Number of households with income $60k - 75k:| Norfolk: | 7.5% (8,100) |
| Massachusetts: | 7.5% (10,239) |
Number of households with income $75k - 100k:| Norfolk: | 13.1% (14,265) |
| Massachusetts: | 13.1% (18,032) |
Number of households with income $100k - 125k:| Norfolk: | 9.6% (10,396) |
| Massachusetts: | 9.6% (13,141) |
Number of households with income $125k - 150k:| Norfolk: | 5.0% (5,386) |
| State: | 5.0% (6,808) |
Number of households with income $150k - 200k:| Norfolk: | 6.4% (6,996) |
| Massachusetts: | 6.4% (8,843) |
Number of households with income > $200k:| Norfolk: | 9.0% (9,806) |
| State: | 9.0% (12,396) |
Median per capita income in Norfolk in 2022:| Norfolk: | $23,904 |
| State: | $30,797 |