Livingston-New Willard, Texas (TX) income map, earnings map, and wages data
The median household income in Livingston-New Willard, TX in 2022 was $57,114, which was 26.6% less than the median annual income of $72,284 across the entire state of Texas. Compared to the median income of $30,980 in 2000 this represents an increase of 45.8%. The per capita income in 2022 was $31,652, which means an increase of 48.5% compared to 2000 when it was $16,298.
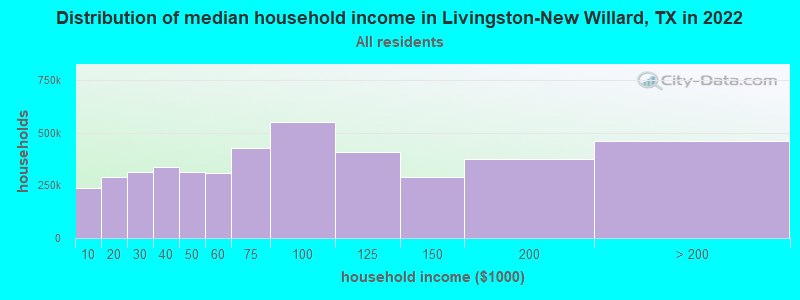
Income statistics for all residents
Median household income in Livingston-New Willard, TX in 2022:| Livingston-New Willard: | $57,114 |
| State: | $72,284 |
Change in median household income between 2000 and 2022:| Livingston-New Willard, Texas: | +84.4% |
| State: | +81.0% |
Number of households with income < $10k:| Livingston-New Willard: | 5.5% (236,917) |
| State: | 5.5% (611,011) |
Number of households with income $10k - 20k:| Livingston-New Willard: | 6.7% (288,306) |
| State: | 6.7% (743,157) |
Number of households with income $20k - 30k:| Livingston-New Willard: | 7.2% (311,679) |
| Texas: | 7.2% (803,381) |
Number of households with income $30k - 40k:| Livingston-New Willard: | 7.8% (335,965) |
| State: | 7.8% (866,080) |
Number of households with income $40k - 50k:| Livingston-New Willard: | 7.3% (314,394) |
| State: | 7.3% (810,440) |
Number of households with income $50k - 60k:| Livingston-New Willard: | 7.2% (310,219) |
| Texas: | 7.2% (799,783) |
Number of households with income $60k - 75k:| Livingston-New Willard: | 9.9% (424,897) |
| State: | 9.9% (1,095,384) |
Number of households with income $75k - 100k:| Livingston-New Willard: | 12.8% (550,599) |
| State: | 12.8% (1,419,057) |
Number of households with income $100k - 125k:| Livingston-New Willard: | 9.5% (409,221) |
| State: | 9.5% (1,054,577) |
Number of households with income $125k - 150k:| Livingston-New Willard: | 6.7% (287,813) |
| State: | 6.7% (741,518) |
Number of households with income $150k - 200k:| Livingston-New Willard: | 8.7% (373,095) |
| State: | 8.7% (961,776) |
Number of households with income > $200k:| Livingston-New Willard: | 10.7% (458,159) |
| Texas: | 10.7% (1,181,544) |
Aggregate household income in Livingston-New Willard in 2022: $147,604,153,439
Median family income in Livingston-New Willard in 2022:| Livingston-New Willard: | $69,714 |
| State: | $86,267 |
Median non-family income in Livingston-New Willard in 2022:| Livingston-New Willard: | $30,511 |
| State: | $45,999 |
Change in median non-family income between 2000 and 2022:| Livingston-New Willard, Texas: | +85.2% |
| State: | +79.5% |
Median per capita income in Livingston-New Willard in 2022:| Livingston-New Willard: | $31,653 |
| State: | $38,123 |
Change in median per capita income between 2000 and 2022:| Livingston-New Willard, Texas: | +94.2% |
| State: | +94.3% |
Income statistics for White residents
Median household income in Livingston-New Willard, TX in 2022:| Livingston-New Willard: | $60,191 |
| State: | $82,032 |
Change in median household income between 2000 and 2022:| Livingston-New Willard, Texas: | +90.4% |
| State: | +91.0% |
Number of households with income < $10k:| Livingston-New Willard: | 4.7% (100,449) |
| State: | 4.7% (273,716) |
Number of households with income $10k - 20k:| Livingston-New Willard: | 5.5% (118,643) |
| State: | 5.5% (322,702) |
Number of households with income $20k - 30k:| Livingston-New Willard: | 6.2% (133,880) |
| State: | 6.2% (363,947) |
Number of households with income $30k - 40k:| Livingston-New Willard: | 6.8% (146,748) |
| State: | 6.8% (399,275) |
Number of households with income $40k - 50k:| Livingston-New Willard: | 6.5% (140,870) |
| State: | 6.5% (383,417) |
Number of households with income $50k - 60k:| Livingston-New Willard: | 6.6% (142,723) |
| Texas: | 6.6% (388,535) |
Number of households with income $60k - 75k:| Livingston-New Willard: | 9.6% (207,748) |
| State: | 9.7% (566,295) |
Number of households with income $75k - 100k:| Livingston-New Willard: | 13.0% (279,178) |
| Texas: | 13.0% (760,276) |
Number of households with income $100k - 125k:| Livingston-New Willard: | 10.2% (219,445) |
| State: | 10.2% (597,596) |
Number of households with income $125k - 150k:| Livingston-New Willard: | 7.4% (160,364) |
| State: | 7.4% (436,830) |
Number of households with income $150k - 200k:| Livingston-New Willard: | 9.9% (213,880) |
| State: | 9.9% (583,067) |
Number of households with income > $200k:| Livingston-New Willard: | 13.5% (289,999) |
| State: | 13.5% (792,647) |
Aggregate household income in Livingston-New Willard in 2022: $80,342,462,620
Median family income in Livingston-New Willard in 2022:| Livingston-New Willard: | $76,033 |
| Texas: | $101,788 |
Number of families with income < $10k:| Livingston-New Willard: | 5.6% (353) |
| State: | 2.8% (108,142) |
Number of families with income $10k - 20k:| Livingston-New Willard: | 5.5% (348) |
| State: | 2.9% (113,421) |
Number of families with income $20k - 30k:| Livingston-New Willard: | 8.6% (540) |
| State: | 4.1% (157,688) |
Number of families with income $30k - 40k:| Livingston-New Willard: | 8.5% (535) |
| Texas: | 5.2% (198,847) |
Number of families with income $40k - 50k:| Livingston-New Willard: | 8.9% (560) |
| Texas: | 5.6% (216,490) |
Number of families with income $50k - 60k:| Livingston-New Willard: | 9.0% (565) |
| Texas: | 5.7% (220,689) |
Number of families with income $60k - 75k:| Livingston-New Willard: | 9.5% (599) |
| State: | 9.0% (346,106) |
Number of families with income $75k - 100k:| Livingston-New Willard: | 12.7% (796) |
| Texas: | 13.7% (527,363) |
Number of families with income $100k - 125k:| Livingston-New Willard: | 9.2% (576) |
| State: | 11.6% (448,411) |
Number of families with income $125k - 150k:| Livingston-New Willard: | 6.8% (425) |
| State: | 9.2% (355,798) |
Number of families with income $150k - 200k:| Livingston-New Willard: | 5.4% (338) |
| Texas: | 12.5% (480,185) |
Number of families with income > $200k:| Livingston-New Willard: | 10.3% (650) |
| State: | 17.6% (677,490) |
Median non-family income in Livingston-New Willard in 2022:| Livingston-New Willard: | $31,119 |
| Texas: | $50,587 |
Change in median non-family income between 2000 and 2022:| Livingston-New Willard, Texas: | +85.8% |
| Texas: | +87.7% |
Median per capita income in Livingston-New Willard in 2022:| Livingston-New Willard: | $37,167 |
| State: | $47,740 |
Change in median per capita income between 2000 and 2022:| Livingston-New Willard, Texas: | +112.1% |
| State: | +114.3% |
Income statistics for Black or African American residents
Median household income in Livingston-New Willard, TX in 2022:| Livingston-New Willard: | $50,838 |
| State: | $55,759 |
Change in median household income between 2000 and 2022:| Livingston-New Willard, Texas: | +113.5% |
| State: | +90.3% |
Number of households with income < $10k:| Livingston-New Willard: | 8.9% (51,146) |
| State: | 8.9% (126,378) |
Number of households with income $10k - 20k:| Livingston-New Willard: | 9.9% (57,181) |
| Texas: | 9.9% (140,369) |
Number of households with income $20k - 30k:| Livingston-New Willard: | 8.5% (49,195) |
| Texas: | 8.5% (120,639) |
Number of households with income $30k - 40k:| Livingston-New Willard: | 9.7% (55,620) |
| State: | 9.7% (137,517) |
Number of households with income $40k - 50k:| Livingston-New Willard: | 7.9% (45,694) |
| State: | 8.0% (112,973) |
Number of households with income $50k - 60k:| Livingston-New Willard: | 8.2% (47,347) |
| State: | 8.3% (117,156) |
Number of households with income $60k - 75k:| Livingston-New Willard: | 10.4% (59,768) |
| State: | 10.4% (147,462) |
Number of households with income $75k - 100k:| Livingston-New Willard: | 11.5% (65,994) |
| State: | 11.5% (162,718) |
Number of households with income $100k - 125k:| Livingston-New Willard: | 8.1% (46,857) |
| State: | 8.2% (115,829) |
Number of households with income $125k - 150k:| Livingston-New Willard: | 4.9% (28,394) |
| State: | 4.9% (69,556) |
Number of households with income $150k - 200k:| Livingston-New Willard: | 6.4% (36,775) |
| State: | 6.4% (90,701) |
Number of households with income > $200k:| Livingston-New Willard: | 5.5% (31,594) |
| State: | 5.5% (77,988) |
Aggregate household income in Livingston-New Willard in 2022: $669,879,707
Median family income in Livingston-New Willard in 2022:| Livingston-New Willard: | $61,089 |
| State: | $69,134 |
Number of families with income < $10k:| Livingston-New Willard: | 13.3% (77) |
| State: | 6.8% (55,625) |
Number of families with income $10k - 20k:| Livingston-New Willard: | 5.2% (30) |
| State: | 6.8% (55,300) |
Number of families with income $20k - 30k:| Livingston-New Willard: | 20.8% (120) |
| Texas: | 7.1% (57,877) |
Number of families with income $30k - 40k:| Livingston-New Willard: | 15.0% (87) |
| Texas: | 8.5% (68,776) |
Number of families with income $40k - 50k:| Livingston-New Willard: | 12.5% (72) |
| State: | 7.1% (57,907) |
Number of families with income $50k - 60k:| Livingston-New Willard: | 5.8% (33) |
| Texas: | 7.3% (59,511) |
Number of families with income $60k - 75k:| Livingston-New Willard: | 7.1% (41) |
| State: | 10.1% (81,994) |
Number of families with income $75k - 100k:| Livingston-New Willard: | 11.6% (67) |
| Texas: | 12.7% (103,723) |
Number of families with income $100k - 125k:| Livingston-New Willard: | 0.7% (4) |
| Texas: | 9.4% (76,609) |
Number of families with income > $200k:| Livingston-New Willard: | 8.0% (46) |
| State: | 7.9% (64,439) |
Median non-family income in Livingston-New Willard in 2022:| Livingston-New Willard: | $30,150 |
| State: | $40,133 |
Change in median non-family income between 2000 and 2022:| Livingston-New Willard, Texas: | +133.0% |
| State: | +102.2% |
Median per capita income in Livingston-New Willard in 2022:| Livingston-New Willard: | $22,345 |
| State: | $30,490 |
Change in median per capita income between 2000 and 2022:| Livingston-New Willard, Texas: | +116.3% |
| Texas: | +113.9% |
Income statistics for Asian residents
Median household income in Livingston-New Willard, TX in 2022:| Livingston-New Willard: | $126,616 |
| State: | $107,673 |
Change in median household income between 2000 and 2022:| Livingston-New Willard, Texas: | +105.9% |
| Texas: | +115.1% |
Number of households with income < $10k:| Livingston-New Willard: | 5.3% (18,382) |
| Texas: | 5.2% (29,885) |
Number of households with income $10k - 20k:| Livingston-New Willard: | 4.8% (16,633) |
| Texas: | 4.7% (27,044) |
Number of households with income $20k - 30k:| Livingston-New Willard: | 4.1% (14,335) |
| State: | 4.1% (23,363) |
Number of households with income $30k - 40k:| Livingston-New Willard: | 4.1% (14,330) |
| State: | 4.1% (23,309) |
Number of households with income $40k - 50k:| Livingston-New Willard: | 5.2% (18,319) |
| Texas: | 5.2% (29,826) |
Number of households with income $50k - 60k:| Livingston-New Willard: | 4.6% (16,250) |
| State: | 4.7% (26,512) |
Number of households with income $60k - 75k:| Livingston-New Willard: | 6.5% (22,696) |
| State: | 6.5% (36,905) |
Number of households with income $75k - 100k:| Livingston-New Willard: | 11.3% (39,466) |
| State: | 11.3% (64,350) |
Number of households with income $100k - 125k:| Livingston-New Willard: | 11.3% (39,718) |
| State: | 11.4% (64,714) |
Number of households with income $125k - 150k:| Livingston-New Willard: | 9.3% (32,380) |
| State: | 9.3% (52,719) |
Number of households with income $150k - 200k:| Livingston-New Willard: | 12.5% (43,587) |
| State: | 12.5% (70,953) |
Number of households with income > $200k:| Livingston-New Willard: | 21.1% (73,871) |
| State: | 21.1% (120,260) |
Aggregate household income in Livingston-New Willard in 2022: $97,890,202
Median family income in Livingston-New Willard in 2022:| Livingston-New Willard: | $168,720 |
| Texas: | $123,328 |
Number of families with income $10k - 20k:| Livingston-New Willard: | 1.4% (2) |
| Texas: | 3.0% (13,043) |
Number of families with income $20k - 30k:| Livingston-New Willard: | 9.6% (13) |
| Texas: | 3.4% (14,738) |
Number of families with income $40k - 50k:| Livingston-New Willard: | 4.0% (5) |
| State: | 4.9% (21,622) |
Number of families with income $75k - 100k:| Livingston-New Willard: | 54.1% (71) |
| Texas: | 10.7% (46,626) |
Number of families with income $100k - 125k:| Livingston-New Willard: | 30.9% (41) |
| Texas: | 11.3% (49,585) |
Median non-family income in Livingston-New Willard in 2022:| Livingston-New Willard: | $147,823 |
| State: | $64,320 |
Change in median non-family income between 2000 and 2022:| Livingston-New Willard, Texas: | +142.8% |
| State: | +131.1% |
Median per capita income in Livingston-New Willard in 2022:| Livingston-New Willard: | $51,897 |
| State: | $48,626 |
Change in median per capita income between 2000 and 2022:| Livingston-New Willard, Texas: | +127.1% |
| Texas: | +132.0% |
Income statistics for Hispanic or Latino residents
Median household income in Livingston-New Willard, TX in 2022:| Livingston-New Willard: | $69,064 |
| State: | $60,504 |
Change in median household income between 2000 and 2022:| Livingston-New Willard, Texas: | +112.9% |
| State: | +102.5% |
Number of households with income < $10k:| Livingston-New Willard: | 5.8% (116,298) |
| Texas: | 5.8% (213,953) |
Number of households with income $10k - 20k:| Livingston-New Willard: | 8.0% (161,743) |
| State: | 8.0% (297,456) |
Number of households with income $20k - 30k:| Livingston-New Willard: | 9.2% (184,802) |
| Texas: | 9.2% (340,166) |
Number of households with income $30k - 40k:| Livingston-New Willard: | 9.5% (192,674) |
| Texas: | 9.5% (354,336) |
Number of households with income $40k - 50k:| Livingston-New Willard: | 8.8% (177,697) |
| State: | 8.8% (327,013) |
Number of households with income $50k - 60k:| Livingston-New Willard: | 8.3% (167,711) |
| State: | 8.3% (308,818) |
Number of households with income $60k - 75k:| Livingston-New Willard: | 10.9% (220,198) |
| Texas: | 10.9% (405,109) |
Number of households with income $75k - 100k:| Livingston-New Willard: | 13.8% (278,226) |
| State: | 13.8% (511,639) |
Number of households with income $100k - 125k:| Livingston-New Willard: | 8.6% (173,878) |
| Texas: | 8.6% (319,728) |
Number of households with income $125k - 150k:| Livingston-New Willard: | 5.7% (114,810) |
| State: | 5.7% (210,932) |
Number of households with income $150k - 200k:| Livingston-New Willard: | 6.4% (128,222) |
| State: | 6.4% (236,055) |
Number of households with income > $200k:| Livingston-New Willard: | 5.1% (102,944) |
| State: | 5.1% (189,259) |
Aggregate household income in Livingston-New Willard in 2022: $1,432,057,463
Median family income in Livingston-New Willard in 2022:| Livingston-New Willard: | $77,204 |
| State: | $65,080 |
Number of families with income < $10k:| Livingston-New Willard: | 12.3% (744) |
| State: | 5.3% (147,493) |
Number of families with income $10k - 20k:| Livingston-New Willard: | 13.3% (807) |
| Texas: | 6.3% (174,531) |
Number of families with income $20k - 30k:| Livingston-New Willard: | 15.9% (964) |
| Texas: | 8.6% (238,528) |
Number of families with income $30k - 40k:| Livingston-New Willard: | 12.0% (726) |
| Texas: | 9.1% (251,999) |
Number of families with income $40k - 50k:| Livingston-New Willard: | 10.3% (622) |
| State: | 8.6% (240,188) |
Number of families with income $50k - 60k:| Livingston-New Willard: | 8.9% (538) |
| Texas: | 8.0% (223,566) |
Number of families with income $60k - 75k:| Livingston-New Willard: | 7.6% (460) |
| State: | 10.9% (302,688) |
Number of families with income $75k - 100k:| Livingston-New Willard: | 8.5% (512) |
| State: | 14.3% (398,554) |
Number of families with income $100k - 125k:| Livingston-New Willard: | 4.5% (275) |
| State: | 9.5% (264,007) |
Number of families with income $125k - 150k:| Livingston-New Willard: | 2.8% (169) |
| State: | 6.2% (171,274) |
Number of families with income $150k - 200k:| Livingston-New Willard: | 1.7% (102) |
| Texas: | 7.3% (202,259) |
Number of families with income > $200k:| Livingston-New Willard: | 2.3% (141) |
| Texas: | 5.9% (165,129) |
Median non-family income in Livingston-New Willard in 2022:| Livingston-New Willard: | $26,277 |
| State: | $39,934 |
Change in median non-family income between 2000 and 2022:| Livingston-New Willard, Texas: | +120.8% |
| Texas: | +109.1% |
Median per capita income in Livingston-New Willard in 2022:| Livingston-New Willard: | $22,969 |
| State: | $24,862 |
Change in median per capita income between 2000 and 2022:| Livingston-New Willard, Texas: | +128.5% |
| State: | +130.8% |
Income statistics for American Indian and Alaska Native residents
Median household income in Livingston-New Willard, TX in 2022:| Livingston-New Willard: | $51,578 |
| State: | $65,765 |
Change in median household income between 2000 and 2022:| Livingston-New Willard, Texas: | +93.7% |
| State: | +88.3% |
Number of households with income < $10k:| Livingston-New Willard: | 4.1% (1,298) |
| Texas: | 4.1% (3,398) |
Number of households with income $10k - 20k:| Livingston-New Willard: | 8.3% (2,653) |
| State: | 8.3% (6,949) |
Number of households with income $20k - 30k:| Livingston-New Willard: | 9.3% (2,956) |
| State: | 9.3% (7,742) |
Number of households with income $30k - 40k:| Livingston-New Willard: | 9.1% (2,909) |
| State: | 9.1% (7,627) |
Number of households with income $40k - 50k:| Livingston-New Willard: | 7.1% (2,263) |
| State: | 7.1% (5,922) |
Number of households with income $50k - 60k:| Livingston-New Willard: | 8.1% (2,582) |
| State: | 8.1% (6,761) |
Number of households with income $60k - 75k:| Livingston-New Willard: | 12.7% (4,041) |
| State: | 12.7% (10,588) |
Number of households with income $75k - 100k:| Livingston-New Willard: | 13.0% (4,164) |
| State: | 13.0% (10,903) |
Number of households with income $100k - 125k:| Livingston-New Willard: | 9.9% (3,153) |
| State: | 9.9% (8,256) |
Number of households with income $125k - 150k:| Livingston-New Willard: | 5.2% (1,662) |
| State: | 5.2% (4,355) |
Number of households with income $150k - 200k:| Livingston-New Willard: | 6.7% (2,145) |
| State: | 6.7% (5,623) |
Number of households with income > $200k:| Livingston-New Willard: | 6.6% (2,106) |
| State: | 6.6% (5,522) |
Aggregate household income in Livingston-New Willard in 2022: $31,360,589
Median family income in Livingston-New Willard in 2022:| Livingston-New Willard: | $61,974 |
| State: | $72,369 |
Number of families with income < $10k:| Livingston-New Willard: | 2.7% (8) |
| State: | 2.7% (1,671) |
Number of families with income $10k - 20k:| Livingston-New Willard: | 10.8% (32) |
| State: | 8.0% (4,891) |
Number of families with income $20k - 30k:| Livingston-New Willard: | 13.1% (38) |
| State: | 7.3% (4,502) |
Number of families with income $30k - 40k:| Livingston-New Willard: | 11.8% (35) |
| State: | 7.5% (4,592) |
Number of families with income $40k - 50k:| Livingston-New Willard: | 7.0% (20) |
| Texas: | 7.9% (4,855) |
Number of families with income $50k - 60k:| Livingston-New Willard: | 8.2% (24) |
| State: | 7.1% (4,347) |
Number of families with income $60k - 75k:| Livingston-New Willard: | 7.9% (23) |
| State: | 12.1% (7,429) |
Number of families with income $75k - 100k:| Livingston-New Willard: | 31.9% (93) |
| Texas: | 14.4% (8,852) |
Number of families with income $100k - 125k:| Livingston-New Willard: | 6.5% (19) |
| State: | 11.4% (6,997) |
Median non-family income in Livingston-New Willard in 2022:| Livingston-New Willard: | $10,697 |
| State: | $40,351 |
Change in median non-family income between 2000 and 2022:| Livingston-New Willard, Texas: | +80.1% |
| Texas: | +71.9% |
Median per capita income in Livingston-New Willard in 2022:| Livingston-New Willard: | $22,852 |
| State: | $28,166 |
Change in median per capita income between 2000 and 2022:| Livingston-New Willard, Texas: | +95.5% |
| State: | +77.2% |
Income statistics for Multirace residents
Median household income in Livingston-New Willard, TX in 2022:| Livingston-New Willard: | $71,328 |
| Texas: | $62,748 |
Change in median household income between 2000 and 2022:| Livingston-New Willard, Texas: | +97.9% |
| State: | +92.3% |
Number of households with income < $10k:| Livingston-New Willard: | 5.5% (67,478) |
| Texas: | 5.5% (122,324) |
Number of households with income $10k - 20k:| Livingston-New Willard: | 8.2% (100,528) |
| Texas: | 8.2% (182,232) |
Number of households with income $20k - 30k:| Livingston-New Willard: | 8.5% (104,404) |
| Texas: | 8.5% (189,456) |
Number of households with income $30k - 40k:| Livingston-New Willard: | 8.9% (108,920) |
| State: | 8.9% (197,499) |
Number of households with income $40k - 50k:| Livingston-New Willard: | 8.7% (105,797) |
| State: | 8.7% (191,735) |
Number of households with income $50k - 60k:| Livingston-New Willard: | 8.0% (97,853) |
| State: | 8.0% (177,535) |
Number of households with income $60k - 75k:| Livingston-New Willard: | 10.5% (128,258) |
| State: | 10.5% (232,479) |
Number of households with income $75k - 100k:| Livingston-New Willard: | 13.1% (160,186) |
| State: | 13.1% (290,448) |
Number of households with income $100k - 125k:| Livingston-New Willard: | 8.7% (105,714) |
| State: | 8.6% (191,595) |
Number of households with income $125k - 150k:| Livingston-New Willard: | 6.0% (73,633) |
| State: | 6.0% (133,361) |
Number of households with income $150k - 200k:| Livingston-New Willard: | 7.2% (87,701) |
| State: | 7.2% (159,195) |
Number of households with income > $200k:| Livingston-New Willard: | 6.7% (81,654) |
| State: | 6.7% (148,064) |
Aggregate household income in Livingston-New Willard in 2022: $399,968,399
Median family income in Livingston-New Willard in 2022:| Livingston-New Willard: | $73,873 |
| State: | $69,780 |
Number of families with income < $10k:| Livingston-New Willard: | 4.3% (88) |
| State: | 4.4% (70,825) |
Number of families with income $10k - 20k:| Livingston-New Willard: | 2.1% (43) |
| Texas: | 5.9% (95,279) |
Number of families with income $20k - 30k:| Livingston-New Willard: | 7.7% (157) |
| Texas: | 7.8% (126,627) |
Number of families with income $30k - 40k:| Livingston-New Willard: | 11.0% (224) |
| Texas: | 8.5% (137,626) |
Number of families with income $40k - 50k:| Livingston-New Willard: | 4.2% (85) |
| State: | 8.4% (135,809) |
Number of families with income $50k - 60k:| Livingston-New Willard: | 8.6% (174) |
| State: | 7.9% (127,739) |
Number of families with income $60k - 75k:| Livingston-New Willard: | 10.2% (208) |
| State: | 10.5% (169,549) |
Number of families with income $75k - 100k:| Livingston-New Willard: | 11.2% (228) |
| State: | 14.0% (226,284) |
Number of families with income > $200k:| Livingston-New Willard: | 40.6% (826) |
| State: | 7.9% (127,299) |
Median non-family income in Livingston-New Willard in 2022:| Livingston-New Willard: | $41,800 |
| State: | $40,634 |
Change in median non-family income between 2000 and 2022:| Livingston-New Willard, Texas: | +93.2% |
| Texas: | +77.2% |
Median per capita income in Livingston-New Willard in 2022:| Livingston-New Willard: | $26,525 |
| Texas: | $26,785 |
Change in median per capita income between 2000 and 2022:| Livingston-New Willard, Texas: | +108.4% |
| State: | +110.9% |
Income statistics for other residents
Number of households with income < $10k:| Livingston-New Willard: | 5.9% (98) |
| Texas: | 5.9% (54,162) |
Number of households with income $10k - 20k:| Livingston-New Willard: | 6.8% (113) |
| State: | 6.8% (62,891) |
Number of households with income $20k - 30k:| Livingston-New Willard: | 10.6% (175) |
| State: | 10.6% (97,294) |
Number of households with income $30k - 40k:| Livingston-New Willard: | 10.9% (180) |
| State: | 10.8% (99,670) |
Number of households with income $40k - 50k:| Livingston-New Willard: | 9.3% (154) |
| Texas: | 9.3% (85,548) |
Number of households with income $50k - 60k:| Livingston-New Willard: | 9.0% (149) |
| Texas: | 9.0% (82,757) |
Number of households with income $60k - 75k:| Livingston-New Willard: | 10.9% (181) |
| State: | 10.9% (100,326) |
Number of households with income $75k - 100k:| Livingston-New Willard: | 14.0% (232) |
| State: | 14.0% (128,767) |
Number of households with income $100k - 125k:| Livingston-New Willard: | 8.2% (135) |
| Texas: | 8.2% (75,218) |
Number of households with income $125k - 150k:| Livingston-New Willard: | 4.8% (80) |
| State: | 4.8% (44,223) |
Number of households with income $150k - 200k:| Livingston-New Willard: | 5.6% (92) |
| Texas: | 5.6% (51,376) |
Number of households with income > $200k:| Livingston-New Willard: | 4.0% (66) |
| State: | 4.0% (36,393) |
Aggregate household income in Livingston-New Willard in 2022: $121,408,806
Median family income in Livingston-New Willard in 2022:| Livingston-New Willard: | $64,255 |
| State: | $60,064 |
Number of families with income < $10k:| Livingston-New Willard: | 2.9% (6) |
| State: | 6.8% (47,502) |
Number of families with income $10k - 20k:| Livingston-New Willard: | 12.4% (27) |
| State: | 6.0% (41,763) |
Number of families with income $20k - 30k:| Livingston-New Willard: | 11.4% (24) |
| Texas: | 9.9% (68,761) |
Number of families with income $30k - 40k:| Livingston-New Willard: | 16.6% (36) |
| State: | 9.7% (67,685) |
Number of families with income $40k - 50k:| Livingston-New Willard: | 11.8% (25) |
| State: | 9.0% (62,441) |
Number of families with income $50k - 60k:| Livingston-New Willard: | 9.5% (20) |
| State: | 8.5% (59,321) |
Number of families with income $60k - 75k:| Livingston-New Willard: | 17.8% (38) |
| State: | 11.2% (77,588) |
Number of families with income $75k - 100k:| Livingston-New Willard: | 17.7% (38) |
| State: | 14.5% (101,032) |
Median non-family income in Livingston-New Willard in 2022:| Livingston-New Willard: | $20,993 |
| State: | $38,690 |
Change in median non-family income between 2000 and 2022:| Livingston-New Willard, Texas: | +123.9% |
| State: | +90.2% |
Median per capita income in Livingston-New Willard in 2022:| Livingston-New Willard: | $22,112 |
| State: | $23,899 |
Change in median per capita income between 2000 and 2022:| Livingston-New Willard, Texas: | +141.8% |
| State: | +135.2% |