The median household income in Harlingen, TX in 2022 was $50,166, which was 44.1% less than the median annual income of $72,284 across the entire state of Texas. Compared to the median income of $30,296 in 2000 this represents an increase of 39.6%. The per capita income in 2022 was $26,136, which means an increase of 46.9% compared to 2000 when it was $13,886.
Whole page based on the data from 2000 / 2022 when the population of Harlingen, Texas was 57,564 / 71,669
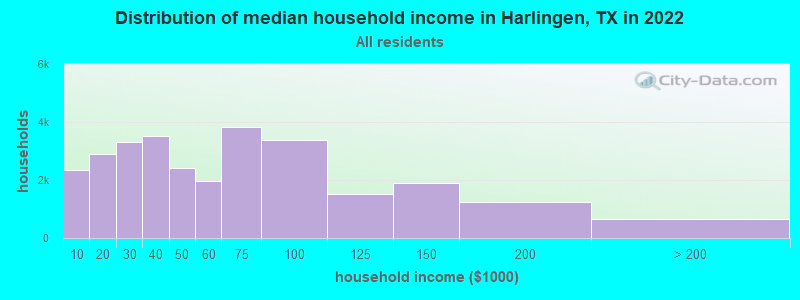
Income statistics for all residents
Median household income in Harlingen, TX in 2022:
Harlingen:
$50,166
State:
$72,284
Change in median household income between 2000 and 2022:
Harlingen, Texas:
+65.6%
State:
+81.0%
Number of households with income < $10k:
Harlingen:
8.1% (2,329)
State:
5.5% (611,011)
Number of households with income $10k - 20k:
Harlingen:
10.0% (2,884)
Texas:
6.7% (743,157)
Number of households with income $20k - 30k:
Harlingen:
11.4% (3,301)
State:
7.2% (803,381)
Number of households with income $30k - 40k:
Harlingen:
12.1% (3,508)
State:
7.8% (866,080)
Number of households with income $40k - 50k:
Harlingen:
8.3% (2,399)
State:
7.3% (810,440)
Number of households with income $50k - 60k:
Harlingen:
6.8% (1,979)
State:
7.2% (799,783)
Number of households with income $60k - 75k:
Harlingen:
13.2% (3,824)
State:
9.9% (1,095,384)
Number of households with income $75k - 100k:
Harlingen:
11.7% (3,377)
State:
12.8% (1,419,057)
Number of households with income $100k - 125k:
Harlingen:
5.2% (1,511)
Texas:
9.5% (1,054,577)
Number of households with income $125k - 150k:
Harlingen:
6.5% (1,882)
State:
6.7% (741,518)
Number of households with income $150k - 200k:
Harlingen:
4.2% (1,225)
Texas:
8.7% (961,776)
Number of households with income > $200k:
Harlingen:
2.3% (672)
Texas:
10.7% (1,181,544)
Aggregate household income in Harlingen in 2022: $1,881,332,900
Median family income in Harlingen in 2022:
Harlingen:
$58,649
State:
$86,267
Number of families with income < $10k:
Harlingen:
6.2% (1,159)
State:
4.0% (297,884)
Number of families with income $10k - 20k:
Harlingen:
5.9% (1,115)
Texas:
4.3% (324,514)
Number of families with income $20k - 30k:
Harlingen:
9.9% (1,850)
State:
5.8% (430,949)
Number of families with income $30k - 40k:
Harlingen:
13.8% (2,592)
State:
6.6% (493,535)
Number of families with income $40k - 50k:
Harlingen:
7.9% (1,485)
State:
6.7% (499,663)
Number of families with income $50k - 60k:
Harlingen:
8.1% (1,522)
State:
6.6% (492,203)
Number of families with income $60k - 75k:
Harlingen:
11.0% (2,056)
State:
9.5% (710,229)
Number of families with income $75k - 100k:
Harlingen:
14.0% (2,632)
State:
13.6% (1,015,480)
Number of families with income $100k - 125k:
Harlingen:
4.9% (919)
State:
10.7% (797,961)
Number of families with income $125k - 150k:
Harlingen:
8.9% (1,661)
State:
8.1% (602,985)
Number of families with income $150k - 200k:
Harlingen:
6.0% (1,126)
Texas:
10.7% (804,459)
Number of families with income > $200k:
Harlingen:
3.4% (635)
State:
13.5% (1,013,514)
Median non-family income in Harlingen in 2022:
Harlingen:
$31,602
State:
$45,999
Change in median non-family income between 2000 and 2022:
Harlingen, Texas:
+73.3%
State:
+79.5%
Median per capita income in Harlingen in 2022:
Harlingen:
$26,136
State:
$38,123
Change in median per capita income between 2000 and 2022:
Harlingen, Texas:
+88.2%
Texas:
+94.3%
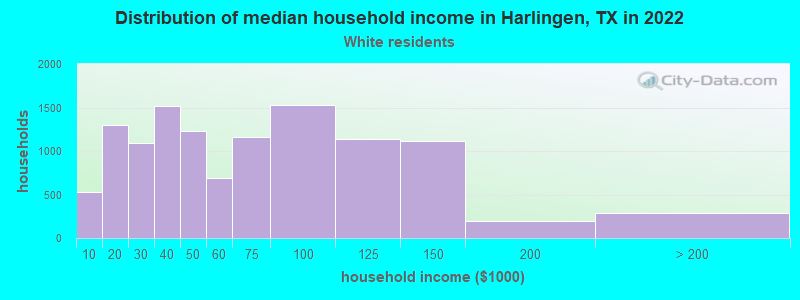
Income statistics for White residents
Median household income in Harlingen, TX in 2022:
Harlingen:
$55,037
State:
$82,032
Change in median household income between 2000 and 2022:
Harlingen, Texas:
+74.3%
Texas:
+91.0%
Number of households with income < $10k:
Harlingen:
4.5% (532)
State:
4.7% (273,716)
Number of households with income $10k - 20k:
Harlingen:
11.1% (1,303)
State:
5.5% (322,702)
Number of households with income $20k - 30k:
Harlingen:
9.2% (1,089)
Texas:
6.2% (363,947)
Number of households with income $30k - 40k:
Harlingen:
12.8% (1,512)
State:
6.8% (399,275)
Number of households with income $40k - 50k:
Harlingen:
10.4% (1,226)
State:
6.5% (383,417)
Number of households with income $50k - 60k:
Harlingen:
5.9% (693)
State:
6.6% (388,535)
Number of households with income $60k - 75k:
Harlingen:
9.9% (1,166)
Texas:
9.7% (566,295)
Number of households with income $75k - 100k:
Harlingen:
12.9% (1,525)
State:
13.0% (760,276)
Number of households with income $100k - 125k:
Harlingen:
9.7% (1,142)
State:
10.2% (597,596)
Number of households with income $125k - 150k:
Harlingen:
9.4% (1,110)
State:
7.4% (436,830)
Number of households with income $150k - 200k:
Harlingen:
1.6% (194)
State:
9.9% (583,067)
Number of households with income > $200k:
Harlingen:
2.5% (292)
State:
13.5% (792,647)
Aggregate household income in Harlingen in 2022: $844,600,100
Median family income in Harlingen in 2022:
Harlingen:
$64,353
State:
$101,788
Number of families with income < $10k:
Harlingen:
3.9% (284)
State:
2.8% (108,142)
Number of families with income $10k - 20k:
Harlingen:
8.2% (603)
State:
2.9% (113,421)
Number of families with income $20k - 30k:
Harlingen:
7.5% (553)
State:
4.1% (157,688)
Number of families with income $30k - 40k:
Harlingen:
11.7% (857)
State:
5.2% (198,847)
Number of families with income $40k - 50k:
Harlingen:
8.2% (600)
State:
5.6% (216,490)
Number of families with income $50k - 60k:
Harlingen:
5.1% (377)
State:
5.7% (220,689)
Number of families with income $60k - 75k:
Harlingen:
11.3% (833)
State:
9.0% (346,106)
Number of families with income $75k - 100k:
Harlingen:
13.9% (1,020)
Texas:
13.7% (527,363)
Number of families with income $100k - 125k:
Harlingen:
8.9% (657)
State:
11.6% (448,411)
Number of families with income $125k - 150k:
Harlingen:
15.1% (1,110)
Texas:
9.2% (355,798)
Number of families with income $150k - 200k:
Harlingen:
2.6% (194)
State:
12.5% (480,185)
Number of families with income > $200k:
Harlingen:
3.5% (255)
State:
17.6% (677,490)
Median non-family income in Harlingen in 2022:
Harlingen:
$33,238
Texas:
$50,587
Change in median non-family income between 2000 and 2022:
Harlingen, Texas:
+65.5%
State:
+87.7%
Median per capita income in Harlingen in 2022:
Harlingen:
$30,471
State:
$47,740
Change in median per capita income between 2000 and 2022:
Harlingen, Texas:
+104.3%
Texas:
+114.3%
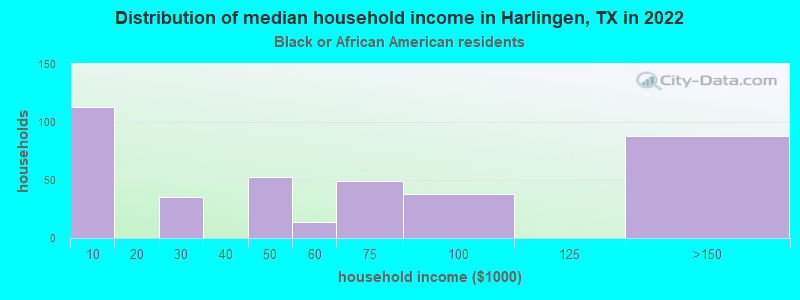
Income statistics for Black or African American residents
Number of households with income < $10k:
Harlingen:
29.0% (113)
State:
8.9% (126,378)
Number of households with income $10k - 20k:
Harlingen:
0.0% (0)
State:
9.9% (140,369)
Number of households with income $20k - 30k:
Harlingen:
9.0% (35)
Texas:
8.5% (120,639)
Number of households with income $30k - 40k:
Harlingen:
0.0% (0)
Texas:
9.7% (137,517)
Number of households with income $40k - 50k:
Harlingen:
13.6% (53)
State:
8.0% (112,973)
Number of households with income $50k - 60k:
Harlingen:
3.6% (14)
Texas:
8.3% (117,156)
Number of households with income $60k - 75k:
Harlingen:
12.6% (49)
State:
10.4% (147,462)
Number of households with income $75k - 100k:
Harlingen:
9.7% (38)
State:
11.5% (162,718)
Number of households with income $100k - 125k:
Harlingen:
0.0% (0)
State:
8.2% (115,829)
Number of households with income $125k - 150k:
Harlingen:
22.6% (88)
State:
4.9% (69,556)
Number of households with income $150k - 200k:
Harlingen:
0.0% (0)
State:
6.4% (90,701)
Number of households with income > $200k:
Harlingen:
0.0% (0)
Texas:
5.5% (77,988)
Aggregate household income in Harlingen in 2022: $23,786,173
Median per capita income in Harlingen in 2022:
Harlingen:
$10,876
State:
$30,490
Change in median per capita income between 2000 and 2022:: -33.3%
Harlingen, Texas:
-33.3%
Texas:
+113.9%
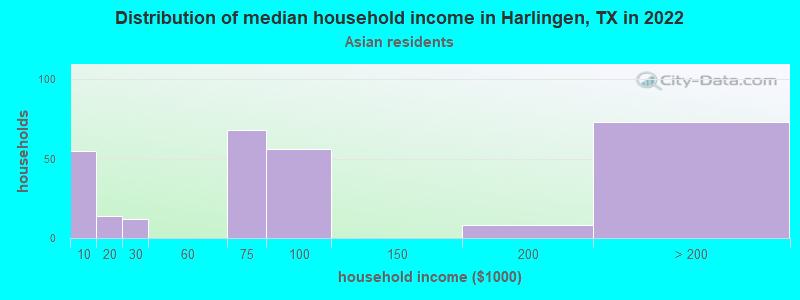
Income statistics for Asian residents
Median household income in Harlingen, TX in 2022:
Harlingen:
$64,531
State:
$107,673
Change in median household income between 2000 and 2022:: -12.3%
Harlingen, Texas:
-12.3%
State:
+115.1%
Number of households with income < $10k:
Harlingen:
19.2% (55)
State:
5.2% (29,885)
Number of households with income $10k - 20k:
Harlingen:
4.9% (14)
State:
4.7% (27,044)
Number of households with income $20k - 30k:
Harlingen:
4.2% (12)
State:
4.1% (23,363)
Number of households with income $30k - 40k:
Harlingen:
0.0% (0)
Texas:
4.1% (23,309)
Number of households with income $40k - 50k:
Harlingen:
0.0% (0)
Texas:
5.2% (29,826)
Number of households with income $50k - 60k:
Harlingen:
0.0% (0)
State:
4.7% (26,512)
Number of households with income $60k - 75k:
Harlingen:
23.8% (68)
State:
6.5% (36,905)
Number of households with income $75k - 100k:
Harlingen:
19.6% (56)
Texas:
11.3% (64,350)
Number of households with income $100k - 125k:
Harlingen:
0.0% (0)
Texas:
11.4% (64,714)
Number of households with income $125k - 150k:
Harlingen:
0.0% (0)
State:
9.3% (52,719)
Number of households with income $150k - 200k:
Harlingen:
2.8% (8)
Texas:
12.5% (70,953)
Number of households with income > $200k:
Harlingen:
25.5% (73)
State:
21.1% (120,260)
Aggregate household income in Harlingen in 2022: $53,365,700
Median family income in Harlingen in 2022:
Harlingen:
$244,250
State:
$123,328
Number of families with income $10k - 20k:
Harlingen:
7.0% (13)
State:
3.0% (13,043)
Number of families with income $60k - 75k:
Harlingen:
18.4% (34)
State:
6.1% (26,637)
Number of families with income $75k - 100k:
Harlingen:
30.0% (56)
State:
10.7% (46,626)
Number of families with income $150k - 200k:
Harlingen:
4.3% (8)
Texas:
14.7% (64,203)
Number of families with income > $200k:
Harlingen:
40.2% (74)
State:
24.8% (108,511)
Median per capita income in Harlingen in 2022:
Harlingen:
$56,015
Texas:
$48,626
Change in median per capita income between 2000 and 2022:
Harlingen, Texas:
+23.6%
State:
+132.0%
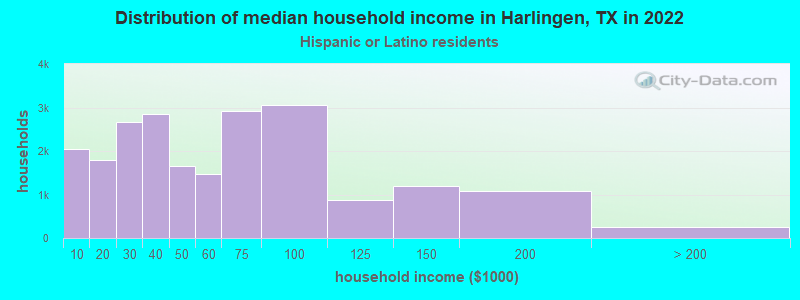
Income statistics for Hispanic or Latino residents
Median household income in Harlingen, TX in 2022:
Harlingen:
$48,542
Texas:
$60,504
Change in median household income between 2000 and 2022:
Harlingen, Texas:
+102.9%
State:
+102.5%
Number of households with income < $10k:
Harlingen:
9.4% (2,054)
Texas:
5.8% (213,953)
Number of households with income $10k - 20k:
Harlingen:
8.2% (1,798)
Texas:
8.0% (297,456)
Number of households with income $20k - 30k:
Harlingen:
12.2% (2,665)
Texas:
9.2% (340,166)
Number of households with income $30k - 40k:
Harlingen:
13.0% (2,845)
Texas:
9.5% (354,336)
Number of households with income $40k - 50k:
Harlingen:
7.6% (1,653)
State:
8.8% (327,013)
Number of households with income $50k - 60k:
Harlingen:
6.7% (1,464)
State:
8.3% (308,818)
Number of households with income $60k - 75k:
Harlingen:
13.4% (2,931)
State:
10.9% (405,109)
Number of households with income $75k - 100k:
Harlingen:
14.0% (3,058)
State:
13.8% (511,639)
Number of households with income $100k - 125k:
Harlingen:
4.0% (867)
State:
8.6% (319,728)
Number of households with income $125k - 150k:
Harlingen:
5.5% (1,196)
Texas:
5.7% (210,932)
Number of households with income $150k - 200k:
Harlingen:
5.0% (1,084)
State:
6.4% (236,055)
Number of households with income > $200k:
Harlingen:
1.1% (247)
State:
5.1% (189,259)
Aggregate household income in Harlingen in 2022: $1,328,546,900
Median family income in Harlingen in 2022:
Harlingen:
$53,421
State:
$65,080
Number of families with income < $10k:
Harlingen:
6.8% (1,018)
Texas:
5.3% (147,493)
Number of families with income $10k - 20k:
Harlingen:
6.1% (922)
State:
6.3% (174,531)
Number of families with income $20k - 30k:
Harlingen:
11.7% (1,757)
State:
8.6% (238,528)
Number of families with income $30k - 40k:
Harlingen:
16.0% (2,405)
State:
9.1% (251,999)
Number of families with income $40k - 50k:
Harlingen:
7.6% (1,143)
Texas:
8.6% (240,188)
Number of families with income $50k - 60k:
Harlingen:
7.7% (1,154)
State:
8.0% (223,566)
Number of families with income $60k - 75k:
Harlingen:
10.2% (1,543)
State:
10.9% (302,688)
Number of families with income $75k - 100k:
Harlingen:
15.8% (2,388)
State:
14.3% (398,554)
Number of families with income $100k - 125k:
Harlingen:
3.5% (530)
Texas:
9.5% (264,007)
Number of families with income $125k - 150k:
Harlingen:
6.5% (975)
State:
6.2% (171,274)
Number of families with income $150k - 200k:
Harlingen:
6.5% (985)
State:
7.3% (202,259)
Number of families with income > $200k:
Harlingen:
1.6% (247)
State:
5.9% (165,129)
Median non-family income in Harlingen in 2022:
Harlingen:
$31,086
Texas:
$39,934
Median per capita income in Harlingen in 2022:
Harlingen:
$22,621
Texas:
$24,862
Change in median per capita income between 2000 and 2022:
Harlingen, Texas:
+128.8%
State:
+130.8%
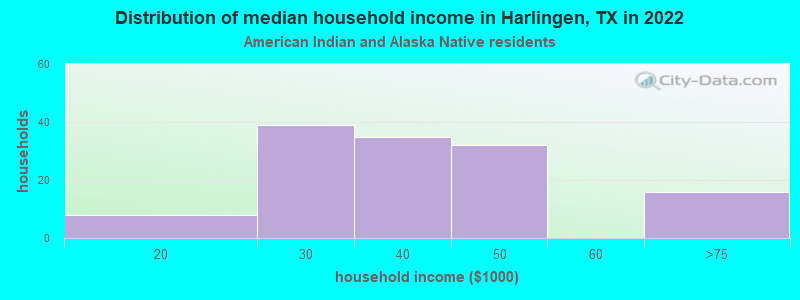
Income statistics for American Indian and Alaska Native residents
Median household income in Harlingen, TX in 2022:
Harlingen:
$29,066
State:
$65,765
Change in median household income between 2000 and 2022:: -3.8%
Harlingen, Texas:
-3.8%
State:
+88.3%
Number of households with income < $10k:
Harlingen:
0.0% (0)
State:
4.1% (3,398)
Number of households with income $10k - 20k:
Harlingen:
6.2% (8)
State:
8.3% (6,949)
Number of households with income $20k - 30k:
Harlingen:
30.0% (39)
State:
9.3% (7,742)
Number of households with income $30k - 40k:
Harlingen:
26.9% (35)
Texas:
9.1% (7,627)
Number of households with income $40k - 50k:
Harlingen:
24.6% (32)
Texas:
7.1% (5,922)
Number of households with income $50k - 60k:
Harlingen:
0.0% (0)
State:
8.1% (6,761)
Number of households with income $60k - 75k:
Harlingen:
12.3% (16)
State:
12.7% (10,588)
Number of households with income $75k - 100k:
Harlingen:
0.0% (0)
State:
13.0% (10,903)
Number of households with income $100k - 125k:
Harlingen:
0.0% (0)
State:
9.9% (8,256)
Number of households with income $125k - 150k:
Harlingen:
0.0% (0)
State:
5.2% (4,355)
Number of households with income $150k - 200k:
Harlingen:
0.0% (0)
Texas:
6.7% (5,623)
Number of households with income > $200k:
Harlingen:
0.0% (0)
Texas:
6.6% (5,522)
Aggregate household income in Harlingen in 2022: $5,003,466
Median non-family income in Harlingen in 2022:
Harlingen:
$28,906
State:
$40,351
Median per capita income in Harlingen in 2022:
Harlingen:
$22,323
Texas:
$28,166
Change in median per capita income between 2000 and 2022:
Harlingen, Texas:
+137.7%
State:
+77.2%
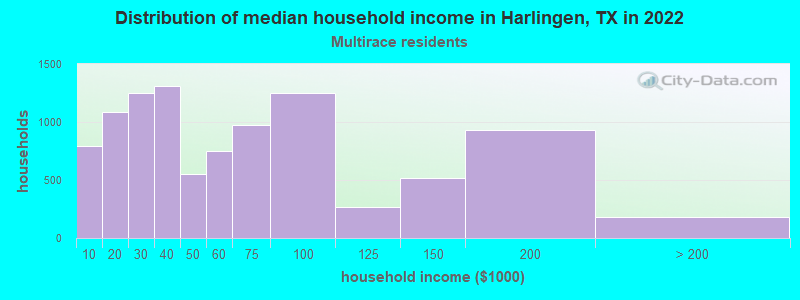
Income statistics for Multirace residents
Median household income in Harlingen, TX in 2022:
Harlingen:
$47,414
Texas:
$62,748
Change in median household income between 2000 and 2022:
Harlingen, Texas:
+100.9%
State:
+92.3%
Number of households with income < $10k:
Harlingen:
8.0% (791)
State:
5.5% (122,324)
Number of households with income $10k - 20k:
Harlingen:
11.0% (1,084)
State:
8.2% (182,232)
Number of households with income $20k - 30k:
Harlingen:
12.7% (1,251)
State:
8.5% (189,456)
Number of households with income $30k - 40k:
Harlingen:
13.3% (1,313)
State:
8.9% (197,499)
Number of households with income $40k - 50k:
Harlingen:
5.6% (551)
Texas:
8.7% (191,735)
Number of households with income $50k - 60k:
Harlingen:
7.6% (753)
State:
8.0% (177,535)
Number of households with income $60k - 75k:
Harlingen:
9.9% (974)
Texas:
10.5% (232,479)
Number of households with income $75k - 100k:
Harlingen:
12.7% (1,254)
State:
13.1% (290,448)
Number of households with income $100k - 125k:
Harlingen:
2.7% (263)
State:
8.6% (191,595)
Number of households with income $125k - 150k:
Harlingen:
5.2% (517)
Texas:
6.0% (133,361)
Number of households with income $150k - 200k:
Harlingen:
9.4% (932)
State:
7.2% (159,195)
Number of households with income > $200k:
Harlingen:
1.9% (183)
Texas:
6.7% (148,064)
Aggregate household income in Harlingen in 2022: $646,015,300
Median family income in Harlingen in 2022:
Harlingen:
$55,166
State:
$69,780
Number of families with income < $10k:
Harlingen:
6.7% (447)
Texas:
4.4% (70,825)
Number of families with income $10k - 20k:
Harlingen:
2.0% (130)
State:
5.9% (95,279)
Number of families with income $20k - 30k:
Harlingen:
10.6% (703)
State:
7.8% (126,627)
Number of families with income $30k - 40k:
Harlingen:
19.6% (1,295)
State:
8.5% (137,626)
Number of families with income $40k - 50k:
Harlingen:
5.5% (362)
Texas:
8.4% (135,809)
Number of families with income $50k - 60k:
Harlingen:
9.2% (612)
State:
7.9% (127,739)
Number of families with income $60k - 75k:
Harlingen:
4.6% (305)
Texas:
10.5% (169,549)
Number of families with income $75k - 100k:
Harlingen:
15.3% (1,014)
State:
14.0% (226,284)
Number of families with income $100k - 125k:
Harlingen:
3.3% (220)
Texas:
9.5% (153,597)
Number of families with income $125k - 150k:
Harlingen:
6.3% (420)
Texas:
6.7% (107,900)
Number of families with income $150k - 200k:
Harlingen:
14.1% (932)
State:
8.5% (137,607)
Number of families with income > $200k:
Harlingen:
2.8% (183)
State:
7.9% (127,299)
Median non-family income in Harlingen in 2022:
Harlingen:
$28,284
State:
$40,634
Median per capita income in Harlingen in 2022:
Harlingen:
$24,968
State:
$26,785
Change in median per capita income between 2000 and 2022:
Harlingen, Texas:
+135.1%
Texas:
+110.9%
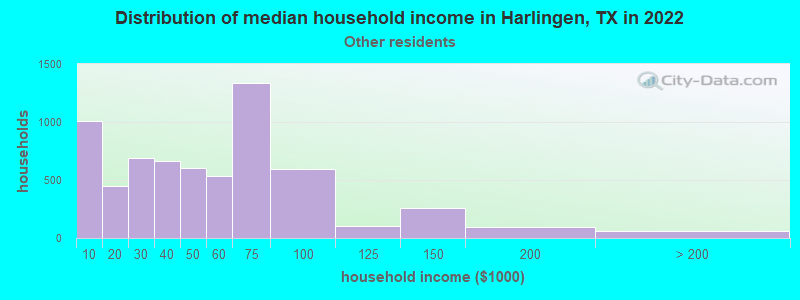
Income statistics for other residents
Median household income in Harlingen, TX in 2022:
Harlingen:
$45,230
State:
$57,114
Number of households with income < $10k:
Harlingen:
15.7% (1,006)
Texas:
5.9% (54,162)
Number of households with income $10k - 20k:
Harlingen:
7.0% (448)
State:
6.8% (62,891)
Number of households with income $20k - 30k:
Harlingen:
10.7% (688)
State:
10.6% (97,294)
Number of households with income $30k - 40k:
Harlingen:
10.4% (666)
State:
10.8% (99,670)
Number of households with income $40k - 50k:
Harlingen:
9.5% (605)
State:
9.3% (85,548)
Number of households with income $50k - 60k:
Harlingen:
8.3% (533)
Texas:
9.0% (82,757)
Number of households with income $60k - 75k:
Harlingen:
20.8% (1,333)
State:
10.9% (100,326)
Number of households with income $75k - 100k:
Harlingen:
9.3% (598)
Texas:
14.0% (128,767)
Number of households with income $100k - 125k:
Harlingen:
1.7% (106)
State:
8.2% (75,218)
Number of households with income $125k - 150k:
Harlingen:
4.0% (255)
Texas:
4.8% (44,223)
Number of households with income $150k - 200k:
Harlingen:
1.5% (99)
State:
5.6% (51,376)
Number of households with income > $200k:
Harlingen:
1.0% (64)
State:
4.0% (36,393)
Aggregate household income in Harlingen in 2022: $321,170,700
Median family income in Harlingen in 2022:
Harlingen:
$47,355
State:
$60,064
Number of families with income < $10k:
Harlingen:
14.4% (361)
State:
6.8% (47,502)
Number of families with income $10k - 20k:
Harlingen:
13.3% (332)
State:
6.0% (41,763)
Number of families with income $20k - 30k:
Harlingen:
6.9% (172)
State:
9.9% (68,761)
Number of families with income $30k - 40k:
Harlingen:
7.1% (179)
State:
9.7% (67,685)
Number of families with income $40k - 50k:
Harlingen:
8.4% (211)
State:
9.0% (62,441)
Number of families with income $50k - 60k:
Harlingen:
19.4% (485)
Texas:
8.5% (59,321)
Number of families with income $60k - 75k:
Harlingen:
13.8% (345)
Texas:
11.2% (77,588)
Number of families with income $75k - 100k:
Harlingen:
10.5% (263)
State:
14.5% (101,032)
Number of families with income $100k - 125k:
Harlingen:
2.8% (71)
Texas:
8.8% (61,439)
Number of families with income $125k - 150k:
Harlingen:
2.8% (69)
State:
5.1% (35,727)
Number of families with income > $200k:
Harlingen:
0.5% (13)
State:
4.5% (31,243)
Median non-family income in Harlingen in 2022:
Harlingen:
$41,239
State:
$38,690
Median per capita income in Harlingen in 2022:
Harlingen:
$19,285
State:
$23,899
Change in median per capita income between 2000 and 2022:
Harlingen, Texas:
+145.5%
Texas:
+135.2%
Discuss Harlingen, Texas (TX) on our hugely popular Texas forum.