East Colusa, California (CA) income map, earnings map, and wages data
The median household income in East Colusa, CA in 2022 was $63,730, which was 43.7% less than the median annual income of $91,551 across the entire state of California. Compared to the median income of $33,789 in 2000 this represents an increase of 47.0%. The per capita income in 2022 was $29,646, which means an increase of 49.0% compared to 2000 when it was $15,115.
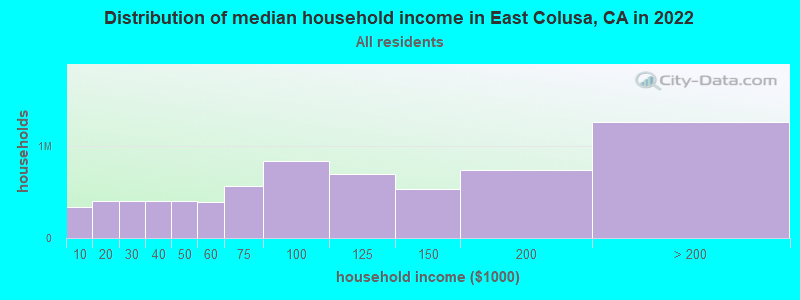
Income statistics for all residents
Median household income in East Colusa, CA in 2022:| East Colusa: | $63,730 |
| State: | $91,551 |
Change in median household income between 2000 and 2022:| East Colusa, California: | +88.6% |
| State: | +92.8% |
Number of households with income < $10k:| East Colusa: | 4.8% (232,694) |
| California: | 4.8% (654,370) |
Number of households with income $10k - 20k:| East Colusa: | 5.8% (280,772) |
| California: | 5.8% (789,493) |
Number of households with income $20k - 30k:| East Colusa: | 5.7% (276,828) |
| State: | 5.7% (778,318) |
Number of households with income $30k - 40k:| East Colusa: | 5.8% (278,525) |
| State: | 5.8% (783,170) |
Number of households with income $40k - 50k:| East Colusa: | 5.8% (277,892) |
| California: | 5.8% (781,352) |
Number of households with income $50k - 60k:| East Colusa: | 5.6% (270,299) |
| State: | 5.6% (760,175) |
Number of households with income $60k - 75k:| East Colusa: | 8.2% (392,832) |
| State: | 8.2% (1,104,699) |
Number of households with income $75k - 100k:| East Colusa: | 12.0% (578,649) |
| State: | 12.0% (1,627,633) |
Number of households with income $100k - 125k:| East Colusa: | 10.0% (483,072) |
| State: | 10.0% (1,358,619) |
Number of households with income $125k - 150k:| East Colusa: | 7.6% (365,305) |
| State: | 7.6% (1,027,455) |
Number of households with income $150k - 200k:| East Colusa: | 10.6% (511,901) |
| California: | 10.6% (1,439,811) |
Number of households with income > $200k:| East Colusa: | 18.0% (869,269) |
| State: | 18.0% (2,445,491) |
Aggregate household income in East Colusa in 2022: $51,169,250,762
Median family income in East Colusa in 2022:| East Colusa: | $78,695 |
| California: | $104,823 |
Median non-family income in East Colusa in 2022:| East Colusa: | $36,217 |
| State: | $59,348 |
Change in median non-family income between 2000 and 2022:| East Colusa, California: | +76.6% |
| California: | +85.3% |
Median per capita income in East Colusa in 2022:| East Colusa: | $29,646 |
| State: | $46,661 |
Change in median per capita income between 2000 and 2022:| East Colusa, California: | +96.1% |
| State: | +105.5% |
Income statistics for White residents
Median household income in East Colusa, CA in 2022:| East Colusa: | $68,080 |
| State: | $100,917 |
Change in median household income between 2000 and 2022:| East Colusa, California: | +92.1% |
| State: | +96.8% |
Number of households with income < $10k:| East Colusa: | 4.4% (98,428) |
| State: | 4.4% (284,109) |
Number of households with income $10k - 20k:| East Colusa: | 5.3% (117,998) |
| California: | 5.3% (340,330) |
Number of households with income $20k - 30k:| East Colusa: | 5.3% (118,925) |
| State: | 5.3% (343,145) |
Number of households with income $30k - 40k:| East Colusa: | 5.1% (114,425) |
| State: | 5.1% (330,146) |
Number of households with income $40k - 50k:| East Colusa: | 5.2% (116,217) |
| California: | 5.2% (335,310) |
Number of households with income $50k - 60k:| East Colusa: | 5.1% (112,973) |
| State: | 5.1% (326,299) |
Number of households with income $60k - 75k:| East Colusa: | 7.6% (168,951) |
| California: | 7.6% (487,640) |
Number of households with income $75k - 100k:| East Colusa: | 11.5% (255,062) |
| State: | 11.5% (736,578) |
Number of households with income $100k - 125k:| East Colusa: | 10.1% (224,581) |
| State: | 10.1% (648,782) |
Number of households with income $125k - 150k:| East Colusa: | 7.8% (173,049) |
| State: | 7.8% (499,671) |
Number of households with income $150k - 200k:| East Colusa: | 11.3% (252,496) |
| State: | 11.4% (729,603) |
Number of households with income > $200k:| East Colusa: | 21.2% (471,658) |
| California: | 21.2% (1,364,246) |
Aggregate household income in East Colusa in 2022: $21,790,970,985
Median family income in East Colusa in 2022:| East Colusa: | $88,898 |
| State: | $125,379 |
Number of families with income < $10k:| East Colusa: | 3.6% (31) |
| State: | 2.2% (87,079) |
Number of families with income $10k - 20k:| East Colusa: | 4.9% (42) |
| State: | 2.5% (97,716) |
Number of families with income $20k - 30k:| East Colusa: | 5.9% (49) |
| State: | 3.5% (137,295) |
Number of families with income $30k - 40k:| East Colusa: | 10.2% (86) |
| California: | 3.9% (152,947) |
Number of families with income $40k - 50k:| East Colusa: | 8.0% (67) |
| California: | 4.3% (169,197) |
Number of families with income $50k - 60k:| East Colusa: | 7.6% (64) |
| California: | 4.5% (176,192) |
Number of families with income $60k - 75k:| East Colusa: | 12.0% (101) |
| California: | 7.0% (274,752) |
Number of families with income $75k - 100k:| East Colusa: | 13.8% (116) |
| California: | 11.3% (445,632) |
Number of families with income $100k - 125k:| East Colusa: | 5.6% (47) |
| California: | 10.7% (423,630) |
Number of families with income $125k - 150k:| East Colusa: | 11.3% (95) |
| State: | 9.1% (357,408) |
Number of families with income $150k - 200k:| East Colusa: | 5.7% (48) |
| State: | 13.5% (532,693) |
Number of families with income > $200k:| East Colusa: | 11.4% (96) |
| State: | 27.6% (1,086,948) |
Median non-family income in East Colusa in 2022:| East Colusa: | $36,888 |
| State: | $62,819 |
Change in median non-family income between 2000 and 2022:| East Colusa, California: | +75.2% |
| State: | +84.4% |
Median per capita income in East Colusa in 2022:| East Colusa: | $38,461 |
| California: | $61,706 |
Change in median per capita income between 2000 and 2022:| East Colusa, California: | +113.4% |
| State: | +122.7% |
Income statistics for Black or African American residents
Median household income in East Colusa, CA in 2022:| East Colusa: | $52,172 |
| State: | $63,268 |
Change in median household income between 2000 and 2022:| East Colusa, California: | +81.5% |
| State: | +81.0% |
Number of households with income < $10k:| East Colusa: | 9.0% (30,097) |
| State: | 9.0% (73,219) |
Number of households with income $10k - 20k:| East Colusa: | 10.6% (35,622) |
| State: | 10.6% (86,666) |
Number of households with income $20k - 30k:| East Colusa: | 7.1% (23,722) |
| State: | 7.1% (57,719) |
Number of households with income $30k - 40k:| East Colusa: | 7.2% (24,152) |
| State: | 7.2% (58,714) |
Number of households with income $40k - 50k:| East Colusa: | 7.1% (23,859) |
| State: | 7.1% (58,075) |
Number of households with income $50k - 60k:| East Colusa: | 6.8% (22,723) |
| California: | 6.8% (55,229) |
Number of households with income $60k - 75k:| East Colusa: | 8.8% (29,528) |
| State: | 8.8% (71,895) |
Number of households with income $75k - 100k:| East Colusa: | 11.9% (39,822) |
| State: | 11.9% (96,893) |
Number of households with income $100k - 125k:| East Colusa: | 8.7% (29,044) |
| California: | 8.7% (70,729) |
Number of households with income $125k - 150k:| East Colusa: | 6.3% (21,059) |
| State: | 6.3% (51,211) |
Number of households with income $150k - 200k:| East Colusa: | 7.2% (24,123) |
| State: | 7.2% (58,687) |
Number of households with income > $200k:| East Colusa: | 9.3% (31,004) |
| State: | 9.3% (75,487) |
Aggregate household income in East Colusa in 2022: $3,075,432
Median family income in East Colusa in 2022:| East Colusa: | $54,749 |
| California: | $77,263 |
Median per capita income in East Colusa in 2022:| East Colusa: | $39,672 |
| State: | $36,708 |
Change in median per capita income between 2000 and 2022:| East Colusa, California: | +75.5% |
| State: | +110.4% |
Income statistics for Asian residents
Median household income in East Colusa, CA in 2022:| East Colusa: | $87,860 |
| State: | $119,861 |
Change in median household income between 2000 and 2022:| East Colusa, California: | +119.6% |
| California: | +116.5% |
Number of households with income < $10k:| East Colusa: | 5.1% (38,379) |
| State: | 5.1% (106,273) |
Number of households with income $10k - 20k:| East Colusa: | 4.9% (36,786) |
| California: | 4.9% (101,815) |
Number of households with income $20k - 30k:| East Colusa: | 4.6% (34,097) |
| State: | 4.6% (94,414) |
Number of households with income $30k - 40k:| East Colusa: | 4.1% (30,521) |
| California: | 4.1% (84,491) |
Number of households with income $40k - 50k:| East Colusa: | 4.0% (29,528) |
| California: | 4.0% (81,758) |
Number of households with income $50k - 60k:| East Colusa: | 3.9% (29,231) |
| State: | 3.9% (80,971) |
Number of households with income $60k - 75k:| East Colusa: | 6.0% (44,848) |
| State: | 6.0% (124,194) |
Number of households with income $75k - 100k:| East Colusa: | 9.7% (72,381) |
| State: | 9.7% (200,337) |
Number of households with income $100k - 125k:| East Colusa: | 9.4% (69,876) |
| State: | 9.4% (193,488) |
Number of households with income $125k - 150k:| East Colusa: | 7.7% (57,165) |
| State: | 7.7% (158,253) |
Number of households with income $150k - 200k:| East Colusa: | 12.2% (91,052) |
| State: | 12.2% (252,139) |
Number of households with income > $200k:| East Colusa: | 28.4% (211,833) |
| State: | 28.4% (586,641) |
Aggregate household income in East Colusa in 2022: $90,004,188
Median family income in East Colusa in 2022:| East Colusa: | $86,429 |
| California: | $136,040 |
Number of families with income $10k - 20k:| East Colusa: | 22.5% (5) |
| State: | 3.1% (46,821) |
Number of families with income $30k - 40k:| East Colusa: | 12.9% (3) |
| California: | 3.7% (55,234) |
Number of families with income $40k - 50k:| East Colusa: | 8.0% (2) |
| California: | 3.9% (58,471) |
Number of families with income $60k - 75k:| East Colusa: | 56.6% (13) |
| State: | 5.9% (88,675) |
Median per capita income in East Colusa in 2022:| East Colusa: | $23,964 |
| State: | $58,824 |
Change in median per capita income between 2000 and 2022:| East Colusa, California: | +135.2% |
| State: | +166.8% |
Income statistics for Hispanic or Latino residents
Median household income in East Colusa, CA in 2022:| East Colusa: | $64,569 |
| California: | $75,698 |
Change in median household income between 2000 and 2022:| East Colusa, California: | +106.9% |
| California: | +107.2% |
Number of households with income < $10k:| East Colusa: | 4.3% (78,511) |
| State: | 4.3% (183,294) |
Number of households with income $10k - 20k:| East Colusa: | 6.0% (108,644) |
| State: | 6.0% (253,903) |
Number of households with income $20k - 30k:| East Colusa: | 6.8% (122,586) |
| California: | 6.8% (286,386) |
Number of households with income $30k - 40k:| East Colusa: | 7.4% (134,260) |
| State: | 7.4% (313,728) |
Number of households with income $40k - 50k:| East Colusa: | 7.4% (134,070) |
| California: | 7.4% (313,199) |
Number of households with income $50k - 60k:| East Colusa: | 7.2% (130,703) |
| California: | 7.2% (305,366) |
Number of households with income $60k - 75k:| East Colusa: | 10.3% (186,067) |
| State: | 10.3% (434,937) |
Number of households with income $75k - 100k:| East Colusa: | 14.4% (259,547) |
| California: | 14.4% (607,302) |
Number of households with income $100k - 125k:| East Colusa: | 10.6% (191,367) |
| State: | 10.6% (447,424) |
Number of households with income $125k - 150k:| East Colusa: | 7.5% (134,998) |
| California: | 7.5% (316,022) |
Number of households with income $150k - 200k:| East Colusa: | 9.1% (165,159) |
| State: | 9.2% (386,269) |
Number of households with income > $200k:| East Colusa: | 8.8% (159,476) |
| State: | 8.8% (372,651) |
Aggregate household income in East Colusa in 2022: $2,709,353,230
Median family income in East Colusa in 2022:| East Colusa: | $68,941 |
| State: | $77,589 |
Number of families with income < $10k:| East Colusa: | 5.6% (35) |
| California: | 3.9% (129,468) |
Number of families with income $10k - 20k:| East Colusa: | 7.0% (44) |
| State: | 4.6% (151,997) |
Number of families with income $20k - 30k:| East Colusa: | 8.3% (53) |
| State: | 6.6% (216,764) |
Number of families with income $30k - 40k:| East Colusa: | 14.0% (89) |
| California: | 7.6% (249,849) |
Number of families with income $40k - 50k:| East Colusa: | 9.5% (60) |
| State: | 7.7% (254,822) |
Number of families with income $50k - 60k:| East Colusa: | 11.0% (70) |
| State: | 7.4% (244,815) |
Number of families with income $60k - 75k:| East Colusa: | 13.4% (86) |
| State: | 10.5% (345,838) |
Number of families with income $75k - 100k:| East Colusa: | 12.9% (82) |
| State: | 14.9% (491,589) |
Number of families with income $100k - 125k:| East Colusa: | 4.6% (29) |
| State: | 10.7% (355,400) |
Number of families with income $125k - 150k:| East Colusa: | 7.1% (45) |
| State: | 7.8% (259,317) |
Number of families with income $150k - 200k:| East Colusa: | 3.2% (20) |
| California: | 9.3% (306,566) |
Number of families with income > $200k:| East Colusa: | 3.7% (23) |
| State: | 9.1% (299,984) |
Median non-family income in East Colusa in 2022:| East Colusa: | $39,875 |
| California: | $49,746 |
Change in median non-family income between 2000 and 2022:| East Colusa, California: | +97.9% |
| California: | +100.7% |
Median per capita income in East Colusa in 2022:| East Colusa: | $20,625 |
| California: | $27,240 |
Change in median per capita income between 2000 and 2022:| East Colusa, California: | +130.5% |
| State: | +133.3% |
Income statistics for American Indian and Alaska Native residents
Median household income in East Colusa, CA in 2022:| East Colusa: | $47,732 |
| California: | $76,752 |
Change in median household income between 2000 and 2022:| East Colusa, California: | +113.8% |
| California: | +110.0% |
Number of households with income < $10k:| East Colusa: | 5.4% (2,576) |
| California: | 5.4% (8,471) |
Number of households with income $10k - 20k:| East Colusa: | 6.0% (2,842) |
| California: | 6.0% (9,381) |
Number of households with income $20k - 30k:| East Colusa: | 5.6% (2,670) |
| State: | 5.5% (8,668) |
Number of households with income $30k - 40k:| East Colusa: | 8.2% (3,916) |
| State: | 8.3% (13,030) |
Number of households with income $40k - 50k:| East Colusa: | 7.0% (3,314) |
| California: | 6.9% (10,908) |
Number of households with income $50k - 60k:| East Colusa: | 7.1% (3,387) |
| State: | 7.1% (11,198) |
Number of households with income $60k - 75k:| East Colusa: | 9.6% (4,575) |
| State: | 9.6% (15,190) |
Number of households with income $75k - 100k:| East Colusa: | 14.0% (6,683) |
| State: | 14.1% (22,274) |
Number of households with income $100k - 125k:| East Colusa: | 11.3% (5,369) |
| California: | 11.2% (17,643) |
Number of households with income $125k - 150k:| East Colusa: | 8.3% (3,934) |
| State: | 8.3% (13,117) |
Number of households with income $150k - 200k:| East Colusa: | 8.8% (4,181) |
| California: | 8.8% (13,853) |
Number of households with income > $200k:| East Colusa: | 8.8% (4,198) |
| State: | 8.8% (13,925) |
Aggregate household income in East Colusa in 2022: $10,869,378
Median family income in East Colusa in 2022:| East Colusa: | $59,833 |
| State: | $81,108 |
Number of families with income < $10k:| East Colusa: | 13.2% (7) |
| California: | 5.0% (5,711) |
Number of families with income $10k - 20k:| East Colusa: | 5.1% (3) |
| State: | 3.7% (4,148) |
Number of families with income $20k - 30k:| East Colusa: | 13.4% (7) |
| State: | 4.3% (4,876) |
Number of families with income $30k - 40k:| East Colusa: | 3.1% (2) |
| State: | 8.8% (9,994) |
Number of families with income $50k - 60k:| East Colusa: | 31.5% (17) |
| California: | 6.9% (7,834) |
Number of families with income $60k - 75k:| East Colusa: | 4.3% (2) |
| State: | 9.1% (10,247) |
Number of families with income $75k - 100k:| East Colusa: | 29.4% (16) |
| State: | 14.8% (16,731) |
Median non-family income in East Colusa in 2022:| East Colusa: | $19,693 |
| California: | $51,296 |
Change in median non-family income between 2000 and 2022:| East Colusa, California: | +80.0% |
| State: | +114.0% |
Median per capita income in East Colusa in 2022:| East Colusa: | $18,469 |
| State: | $30,289 |
Change in median per capita income between 2000 and 2022:| East Colusa, California: | +99.9% |
| State: | +98.9% |
Income statistics for Multirace residents
Median household income in East Colusa, CA in 2022:| East Colusa: | $43,189 |
| State: | $83,153 |
Change in median household income between 2000 and 2022:| East Colusa, California: | +99.3% |
| State: | +106.0% |
Number of households with income < $10k:| East Colusa: | 4.2% (22,942) |
| State: | 4.2% (85,299) |
Number of households with income $10k - 20k:| East Colusa: | 6.1% (33,052) |
| State: | 6.1% (122,966) |
Number of households with income $20k - 30k:| East Colusa: | 6.4% (34,803) |
| California: | 6.4% (129,328) |
Number of households with income $30k - 40k:| East Colusa: | 6.4% (34,988) |
| State: | 6.4% (130,070) |
Number of households with income $40k - 50k:| East Colusa: | 6.5% (35,290) |
| State: | 6.5% (131,254) |
Number of households with income $50k - 60k:| East Colusa: | 6.5% (35,594) |
| State: | 6.5% (132,382) |
Number of households with income $60k - 75k:| East Colusa: | 9.4% (51,448) |
| California: | 9.4% (191,472) |
Number of households with income $75k - 100k:| East Colusa: | 13.3% (72,406) |
| State: | 13.3% (269,691) |
Number of households with income $100k - 125k:| East Colusa: | 10.2% (55,705) |
| State: | 10.2% (207,286) |
Number of households with income $125k - 150k:| East Colusa: | 7.8% (42,475) |
| California: | 7.8% (158,259) |
Number of households with income $150k - 200k:| East Colusa: | 10.3% (56,206) |
| State: | 10.3% (209,227) |
Number of households with income > $200k:| East Colusa: | 13.0% (70,729) |
| State: | 13.0% (263,210) |
Aggregate household income in East Colusa in 2022: $154,091,634
Median family income in East Colusa in 2022:| East Colusa: | $77,145 |
| California: | $87,642 |
Number of families with income < $10k:| East Colusa: | 11.5% (26) |
| State: | 3.2% (48,017) |
Number of families with income $10k - 20k:| East Colusa: | 8.4% (19) |
| State: | 4.1% (60,419) |
Number of families with income $20k - 30k:| East Colusa: | 14.8% (33) |
| California: | 6.1% (89,742) |
Number of families with income $30k - 40k:| East Colusa: | 7.7% (17) |
| State: | 6.2% (91,415) |
Number of families with income $40k - 50k:| East Colusa: | 29.6% (67) |
| State: | 6.8% (100,085) |
Number of families with income $50k - 60k:| East Colusa: | 20.2% (45) |
| State: | 6.7% (98,298) |
Number of families with income $60k - 75k:| East Colusa: | 7.7% (17) |
| California: | 9.5% (140,131) |
Median non-family income in East Colusa in 2022:| East Colusa: | $20,850 |
| State: | $56,558 |
Change in median non-family income between 2000 and 2022:| East Colusa, California: | +99.2% |
| State: | +100.2% |
Median per capita income in East Colusa in 2022:| East Colusa: | $18,159 |
| State: | $32,124 |
Change in median per capita income between 2000 and 2022:| East Colusa, California: | +111.2% |
| State: | +120.4% |
Income statistics for other residents
Number of households with income < $10k:| East Colusa: | 4.6% (348) |
| California: | 4.6% (93,035) |
Number of households with income $10k - 20k:| East Colusa: | 6.3% (473) |
| California: | 6.3% (126,222) |
Number of households with income $20k - 30k:| East Colusa: | 7.1% (533) |
| California: | 7.1% (142,656) |
Number of households with income $30k - 40k:| East Colusa: | 8.2% (618) |
| California: | 8.2% (165,018) |
Number of households with income $40k - 50k:| East Colusa: | 8.1% (605) |
| State: | 8.0% (161,732) |
Number of households with income $50k - 60k:| East Colusa: | 7.6% (569) |
| State: | 7.6% (152,152) |
Number of households with income $60k - 75k:| East Colusa: | 10.4% (784) |
| State: | 10.4% (209,951) |
Number of households with income $75k - 100k:| East Colusa: | 14.7% (1,105) |
| California: | 14.7% (296,102) |
Number of households with income $100k - 125k:| East Colusa: | 10.7% (801) |
| State: | 10.7% (214,281) |
Number of households with income $125k - 150k:| East Colusa: | 7.1% (534) |
| California: | 7.1% (143,092) |
Number of households with income $150k - 200k:| East Colusa: | 8.6% (644) |
| State: | 8.6% (172,215) |
Number of households with income > $200k:| East Colusa: | 6.7% (501) |
| State: | 6.7% (134,102) |
Aggregate household income in East Colusa in 2022: $670,072,641
Median family income in East Colusa in 2022:| East Colusa: | $68,893 |
| State: | $72,756 |
Number of families with income < $10k:| East Colusa: | 9.3% (49) |
| State: | 4.3% (69,090) |
Number of families with income $10k - 20k:| East Colusa: | 8.6% (45) |
| State: | 5.1% (82,116) |
Number of families with income $20k - 30k:| East Colusa: | 5.0% (26) |
| State: | 7.0% (112,854) |
Number of families with income $30k - 40k:| East Colusa: | 13.1% (68) |
| California: | 8.4% (135,938) |
Number of families with income $40k - 50k:| East Colusa: | 13.7% (71) |
| State: | 8.4% (135,353) |
Number of families with income $50k - 60k:| East Colusa: | 11.8% (62) |
| State: | 7.7% (124,826) |
Number of families with income $60k - 75k:| East Colusa: | 5.1% (26) |
| State: | 10.7% (173,628) |
Number of families with income $75k - 100k:| East Colusa: | 10.7% (55) |
| California: | 15.2% (245,724) |
Number of families with income $125k - 150k:| East Colusa: | 22.7% (118) |
| State: | 7.4% (119,985) |
Median non-family income in East Colusa in 2022:| East Colusa: | $42,764 |
| State: | $43,881 |
Change in median non-family income between 2000 and 2022:| East Colusa, California: | +99.5% |
| State: | +84.6% |
Median per capita income in East Colusa in 2022:| East Colusa: | $21,301 |
| State: | $25,164 |
Change in median per capita income between 2000 and 2022:| East Colusa, California: | +138.7% |
| California: | +137.9% |