Dartmouth, Massachusetts (MA) income map, earnings map, and wages data
The median household income in Dartmouth, MA in 2022 was $95,136, which was about the same as the median annual income of $94,488 across the entire state of Massachusetts. Compared to the median income of $50,742 in 2000 this represents an increase of 46.7%. The per capita income in 2022 was $49,602, which means an increase of 51.0% compared to 2000 when it was $24,326.
Income statistics for all residents
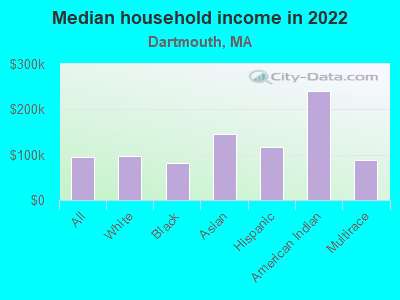
Median household income in Dartmouth, MA in 2022:| Dartmouth: | $95,137 |
| Massachusetts: | $94,488 |
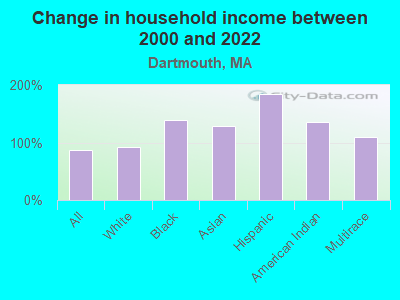
Change in median household income between 2000 and 2022:| Dartmouth, Massachusetts: | +87.5% |
| State: | +87.1% |
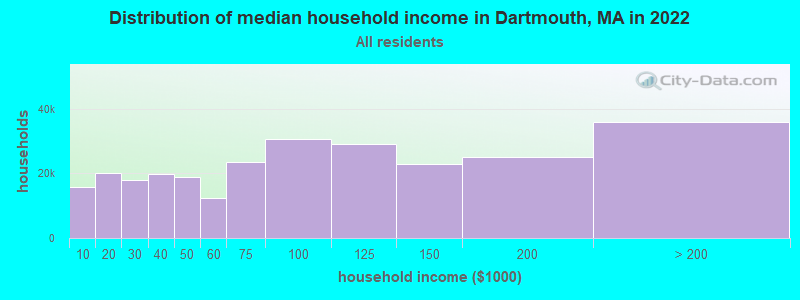
Number of households with income < $10k:| Dartmouth: | 5.8% (15,869) |
| State: | 5.2% (146,170) |
Number of households with income $10k - 20k:| Dartmouth: | 7.3% (19,943) |
| State: | 6.4% (180,001) |
Number of households with income $20k - 30k:| Dartmouth: | 6.6% (17,946) |
| State: | 5.6% (156,667) |
Number of households with income $30k - 40k:| Dartmouth: | 7.3% (19,918) |
| State: | 5.6% (157,168) |
Number of households with income $40k - 50k:| Dartmouth: | 6.9% (18,735) |
| State: | 5.4% (151,455) |
Number of households with income $50k - 60k:| Dartmouth: | 4.6% (12,430) |
| State: | 5.1% (142,726) |
Number of households with income $60k - 75k:| Dartmouth: | 8.6% (23,426) |
| State: | 7.6% (212,203) |
Number of households with income $75k - 100k:| Dartmouth: | 11.3% (30,652) |
| Massachusetts: | 11.3% (317,064) |
Number of households with income $100k - 125k:| Dartmouth: | 10.7% (29,090) |
| State: | 9.7% (270,603) |
Number of households with income $125k - 150k:| Dartmouth: | 8.5% (23,010) |
| State: | 8.0% (223,140) |
Number of households with income $150k - 200k:| Dartmouth: | 9.2% (25,162) |
| Massachusetts: | 11.0% (308,695) |
Number of households with income > $200k:| Dartmouth: | 13.2% (35,860) |
| State: | 19.0% (531,884) |
Aggregate household income in Dartmouth in 2022: $8,038,065,413
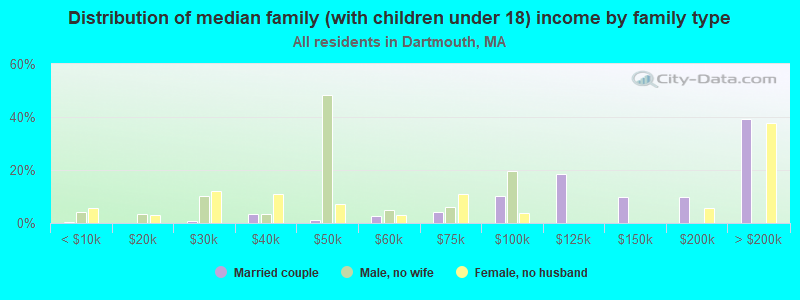
Median family income in Dartmouth in 2022:| Dartmouth: | $121,439 |
| Massachusetts: | $120,263 |
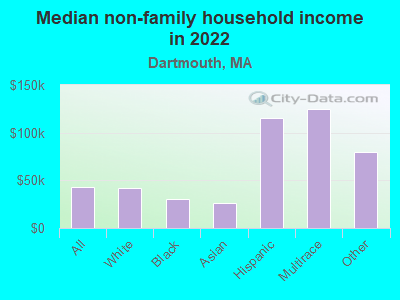
Median non-family income in Dartmouth in 2022:| Dartmouth: | $42,617 |
| State: | $55,979 |
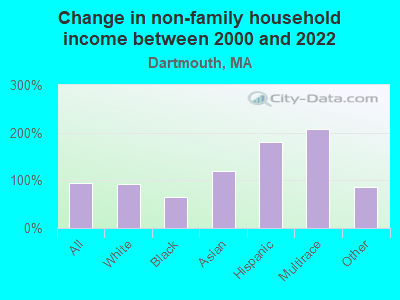
Change in median non-family income between 2000 and 2022:| Dartmouth, Massachusetts: | +93.6% |
| Massachusetts: | +88.0% |
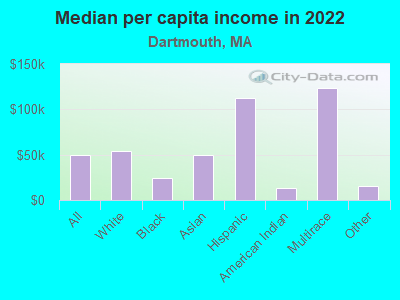
Median per capita income in Dartmouth in 2022:| Dartmouth: | $49,603 |
| Massachusetts: | $54,025 |
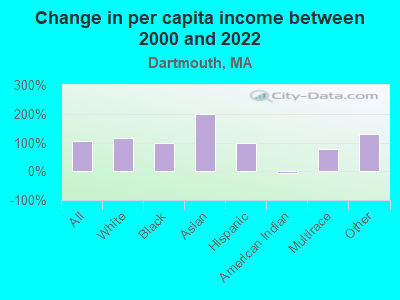
Change in median per capita income between 2000 and 2022:| Dartmouth, Massachusetts: | +103.9% |
| State: | +108.2% |
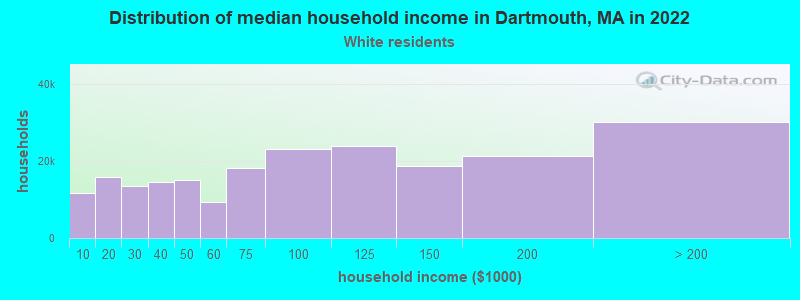
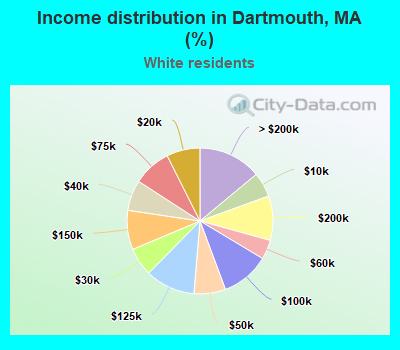
Income statistics for White residents
Median household income in Dartmouth, MA in 2022:| Dartmouth: | $97,380 |
| State: | $101,391 |
Change in median household income between 2000 and 2022:| Dartmouth, Massachusetts: | +92.2% |
| State: | +93.3% |
Number of households with income < $10k:| Dartmouth: | 5.5% (11,783) |
| State: | 4.4% (91,120) |
Number of households with income $10k - 20k:| Dartmouth: | 7.4% (15,926) |
| State: | 5.9% (122,055) |
Number of households with income $20k - 30k:| Dartmouth: | 6.3% (13,494) |
| State: | 5.1% (105,311) |
Number of households with income $30k - 40k:| Dartmouth: | 6.8% (14,594) |
| Massachusetts: | 5.3% (110,239) |
Number of households with income $40k - 50k:| Dartmouth: | 7.0% (15,061) |
| Massachusetts: | 5.0% (104,636) |
Number of households with income $50k - 60k:| Dartmouth: | 4.3% (9,293) |
| Massachusetts: | 4.8% (99,486) |
Number of households with income $60k - 75k:| Dartmouth: | 8.5% (18,201) |
| State: | 7.5% (155,124) |
Number of households with income $75k - 100k:| Dartmouth: | 10.7% (23,088) |
| Massachusetts: | 11.4% (236,252) |
Number of households with income $100k - 125k:| Dartmouth: | 11.0% (23,767) |
| State: | 9.9% (204,731) |
Number of households with income $125k - 150k:| Dartmouth: | 8.7% (18,703) |
| Massachusetts: | 8.5% (175,324) |
Number of households with income $150k - 200k:| Dartmouth: | 9.8% (21,152) |
| State: | 11.7% (242,980) |
Number of households with income > $200k:| Dartmouth: | 14.0% (30,085) |
| State: | 20.5% (425,966) |
Aggregate household income in Dartmouth in 2022: $6,408,001,418
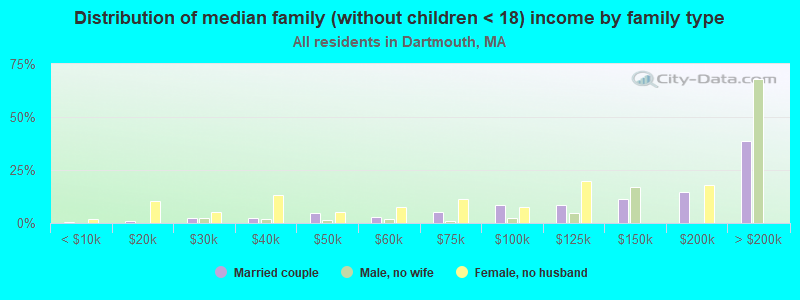
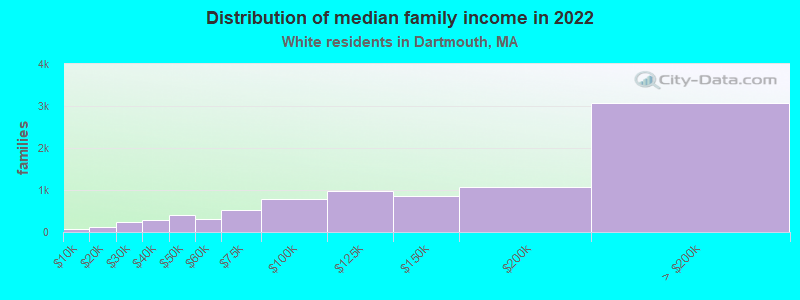
Median family income in Dartmouth in 2022:| Dartmouth: | $125,197 |
| State: | $133,153 |
Number of families with income < $10k:| Dartmouth: | 0.9% (83) |
| Massachusetts: | 2.0% (25,038) |
Number of families with income $10k - 20k:| Dartmouth: | 1.5% (130) |
| State: | 2.1% (26,403) |
Number of families with income $20k - 30k:| Dartmouth: | 2.7% (232) |
| State: | 2.6% (32,525) |
Number of families with income $30k - 40k:| Dartmouth: | 3.4% (296) |
| State: | 3.9% (48,079) |
Number of families with income $40k - 50k:| Dartmouth: | 4.6% (405) |
| State: | 3.8% (46,908) |
Number of families with income $50k - 60k:| Dartmouth: | 3.6% (314) |
| State: | 3.8% (46,476) |
Number of families with income $60k - 75k:| Dartmouth: | 5.9% (518) |
| State: | 6.4% (79,040) |
Number of families with income $75k - 100k:| Dartmouth: | 8.8% (774) |
| Massachusetts: | 11.1% (137,395) |
Number of families with income $100k - 125k:| Dartmouth: | 11.2% (981) |
| State: | 11.1% (136,771) |
Number of families with income $125k - 150k:| Dartmouth: | 9.9% (863) |
| State: | 10.0% (123,709) |
Number of families with income $150k - 200k:| Dartmouth: | 12.3% (1,079) |
| Massachusetts: | 14.7% (181,602) |
Number of families with income > $200k:| Dartmouth: | 35.2% (3,082) |
| Massachusetts: | 28.5% (351,887) |
Median non-family income in Dartmouth in 2022:| Dartmouth: | $42,242 |
| Massachusetts: | $59,323 |
Change in median non-family income between 2000 and 2022:| Dartmouth, Massachusetts: | +92.7% |
| Massachusetts: | +94.3% |
Median per capita income in Dartmouth in 2022:| Dartmouth: | $53,509 |
| State: | $60,804 |
Change in median per capita income between 2000 and 2022:| Dartmouth, Massachusetts: | +115.0% |
| State: | +118.7% |
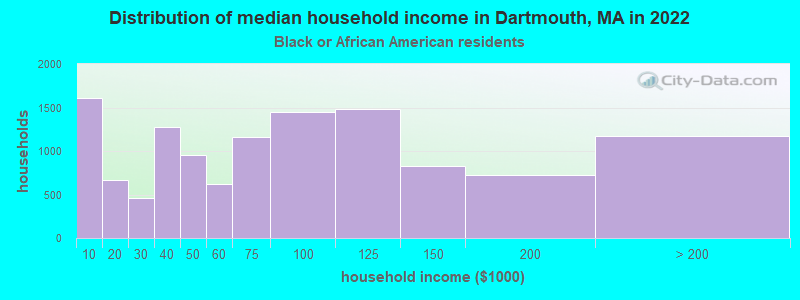
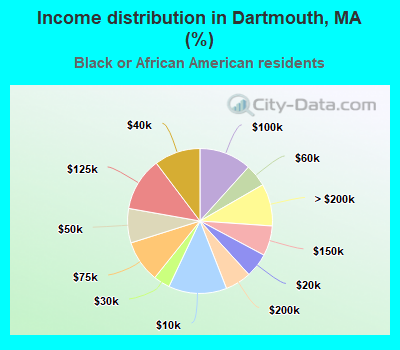
Income statistics for Black or African American residents
Median household income in Dartmouth, MA in 2022:| Dartmouth: | $81,926 |
| State: | $63,189 |
Change in median household income between 2000 and 2022:| Dartmouth, Massachusetts: | +138.9% |
| State: | +87.4% |
Number of households with income < $10k:| Dartmouth: | 13.0% (1,612) |
| State: | 9.1% (15,797) |
Number of households with income $10k - 20k:| Dartmouth: | 5.4% (672) |
| State: | 9.4% (16,267) |
Number of households with income $20k - 30k:| Dartmouth: | 3.7% (458) |
| State: | 7.8% (13,520) |
Number of households with income $30k - 40k:| Dartmouth: | 10.3% (1,277) |
| Massachusetts: | 8.3% (14,412) |
Number of households with income $40k - 50k:| Dartmouth: | 7.7% (951) |
| Massachusetts: | 7.9% (13,790) |
Number of households with income $50k - 60k:| Dartmouth: | 5.0% (622) |
| State: | 5.8% (10,041) |
Number of households with income $60k - 75k:| Dartmouth: | 9.4% (1,165) |
| State: | 8.5% (14,822) |
Number of households with income $75k - 100k:| Dartmouth: | 11.7% (1,446) |
| State: | 11.0% (19,122) |
Number of households with income $100k - 125k:| Dartmouth: | 11.9% (1,478) |
| Massachusetts: | 8.4% (14,575) |
Number of households with income $125k - 150k:| Dartmouth: | 6.7% (832) |
| State: | 6.0% (10,429) |
Number of households with income $150k - 200k:| Dartmouth: | 5.8% (722) |
| State: | 7.2% (12,539) |
Number of households with income > $200k:| Dartmouth: | 9.4% (1,171) |
| State: | 10.5% (18,185) |
Aggregate household income in Dartmouth in 2022: $21,629,682
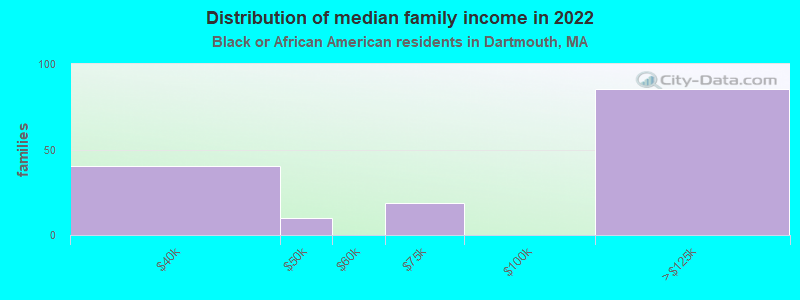
Median family income in Dartmouth in 2022:| Dartmouth: | $125,082 |
| Massachusetts: | $79,815 |
Number of families with income $30k - 40k:| Dartmouth: | 26.1% (40) |
| State: | 6.4% (7,002) |
Number of families with income $40k - 50k:| Dartmouth: | 6.4% (10) |
| Massachusetts: | 7.9% (8,656) |
Number of families with income $60k - 75k:| Dartmouth: | 12.2% (19) |
| State: | 7.9% (8,699) |
Number of families with income $100k - 125k:| Dartmouth: | 55.2% (85) |
| State: | 10.4% (11,452) |
Median non-family income in Dartmouth in 2022:| Dartmouth: | $30,807 |
| State: | $38,934 |
Change in median non-family income between 2000 and 2022:| Dartmouth, Massachusetts: | +64.3% |
| State: | +69.2% |
Median per capita income in Dartmouth in 2022:| Dartmouth: | $24,452 |
| State: | $33,524 |
Change in median per capita income between 2000 and 2022:| Dartmouth, Massachusetts: | +99.0% |
| State: | +109.4% |
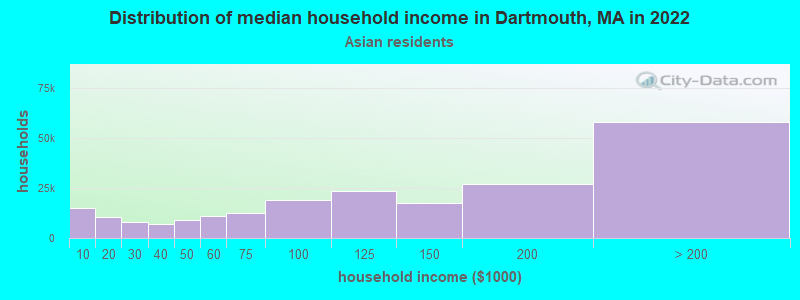
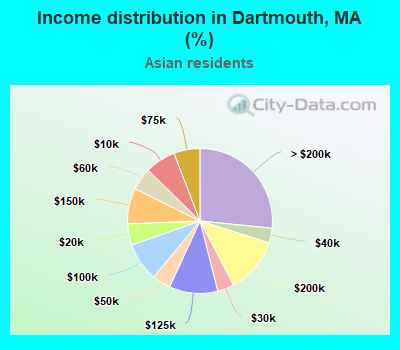
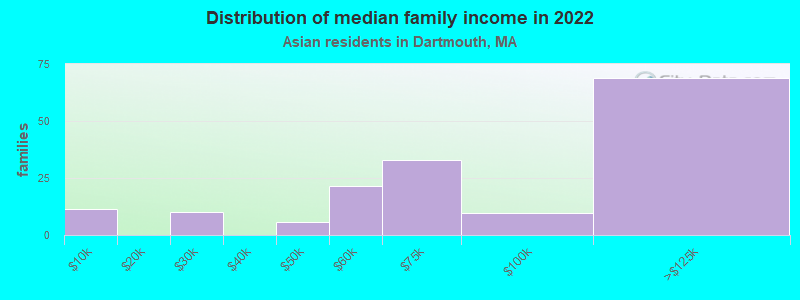
Income statistics for Asian residents
Median household income in Dartmouth, MA in 2022:| Dartmouth: | $145,384 |
| State: | $117,855 |
Change in median household income between 2000 and 2022:| Dartmouth, Massachusetts: | +127.6% |
| Massachusetts: | +129.9% |
Number of households with income < $10k:| Dartmouth: | 6.8% (14,924) |
| State: | 6.8% (11,982) |
Number of households with income $10k - 20k:| Dartmouth: | 4.8% (10,433) |
| Massachusetts: | 4.8% (8,376) |
Number of households with income $20k - 30k:| Dartmouth: | 3.7% (8,169) |
| State: | 3.7% (6,558) |
Number of households with income $30k - 40k:| Dartmouth: | 3.3% (7,160) |
| Massachusetts: | 3.3% (5,748) |
Number of households with income $40k - 50k:| Dartmouth: | 4.1% (8,958) |
| State: | 4.1% (7,192) |
Number of households with income $50k - 60k:| Dartmouth: | 5.0% (10,879) |
| State: | 5.0% (8,734) |
Number of households with income $60k - 75k:| Dartmouth: | 5.8% (12,709) |
| State: | 5.8% (10,203) |
Number of households with income $75k - 100k:| Dartmouth: | 8.6% (18,875) |
| State: | 8.6% (15,154) |
Number of households with income $100k - 125k:| Dartmouth: | 10.8% (23,594) |
| State: | 10.8% (18,942) |
Number of households with income $125k - 150k:| Dartmouth: | 8.0% (17,484) |
| State: | 8.0% (14,037) |
Number of households with income $150k - 200k:| Dartmouth: | 12.5% (27,223) |
| Massachusetts: | 12.5% (21,856) |
Number of households with income > $200k:| Dartmouth: | 26.6% (58,161) |
| State: | 26.6% (46,694) |
Aggregate household income in Dartmouth in 2022: $47,629,713
Median family income in Dartmouth in 2022:| Dartmouth: | $137,899 |
| State: | $140,113 |
Number of families with income < $10k:| Dartmouth: | 7.2% (11) |
| State: | 3.2% (3,752) |
Number of families with income $20k - 30k:| Dartmouth: | 6.2% (10) |
| Massachusetts: | 2.3% (2,708) |
Number of families with income $40k - 50k:| Dartmouth: | 3.5% (6) |
| State: | 3.9% (4,621) |
Number of families with income $50k - 60k:| Dartmouth: | 13.4% (21) |
| State: | 3.9% (4,606) |
Number of families with income $60k - 75k:| Dartmouth: | 20.6% (33) |
| State: | 6.1% (7,105) |
Number of families with income $75k - 100k:| Dartmouth: | 6.1% (10) |
| State: | 8.5% (10,022) |
Number of families with income $100k - 125k:| Dartmouth: | 43.1% (69) |
| State: | 10.0% (11,697) |
Median non-family income in Dartmouth in 2022:| Dartmouth: | $26,265 |
| State: | $71,440 |
Change in median non-family income between 2000 and 2022:| Dartmouth, Massachusetts: | +118.9% |
| Massachusetts: | +128.0% |
Median per capita income in Dartmouth in 2022:| Dartmouth: | $49,925 |
| Massachusetts: | $58,900 |
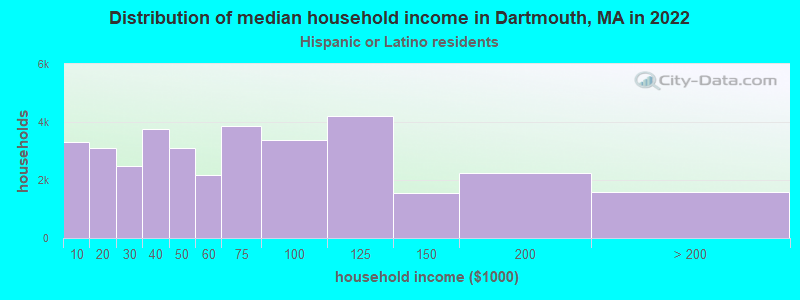
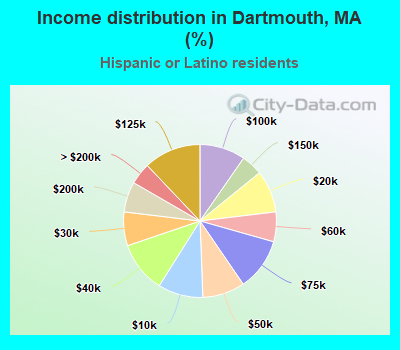
Income statistics for Hispanic or Latino residents
Median household income in Dartmouth, MA in 2022:| Dartmouth: | $117,035 |
| State: | $61,523 |
Number of households with income < $10k:| Dartmouth: | 9.5% (3,316) |
| State: | 8.8% (25,307) |
Number of households with income $10k - 20k:| Dartmouth: | 8.9% (3,107) |
| State: | 10.0% (28,653) |
Number of households with income $20k - 30k:| Dartmouth: | 7.1% (2,478) |
| State: | 8.8% (25,189) |
Number of households with income $30k - 40k:| Dartmouth: | 10.8% (3,767) |
| State: | 7.2% (20,822) |
Number of households with income $40k - 50k:| Dartmouth: | 9.0% (3,110) |
| State: | 7.2% (20,817) |
Number of households with income $50k - 60k:| Dartmouth: | 6.3% (2,185) |
| State: | 6.5% (18,748) |
Number of households with income $60k - 75k:| Dartmouth: | 11.1% (3,845) |
| Massachusetts: | 8.8% (25,390) |
Number of households with income $75k - 100k:| Dartmouth: | 9.7% (3,363) |
| State: | 12.0% (34,488) |
Number of households with income $100k - 125k:| Dartmouth: | 12.1% (4,201) |
| Massachusetts: | 8.6% (24,599) |
Number of households with income $125k - 150k:| Dartmouth: | 4.5% (1,558) |
| State: | 6.2% (17,743) |
Number of households with income $150k - 200k:| Dartmouth: | 6.4% (2,232) |
| State: | 7.3% (21,017) |
Number of households with income > $200k:| Dartmouth: | 4.6% (1,586) |
| State: | 8.6% (24,606) |
Aggregate household income in Dartmouth in 2022: $13,747,468
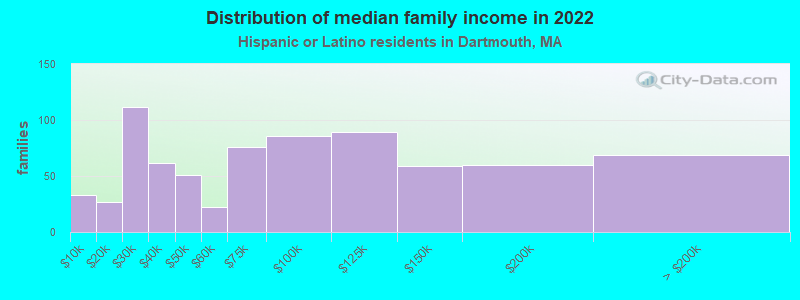
Median family income in Dartmouth in 2022:| Dartmouth: | $13,020 |
| State: | $66,072 |
Number of families with income < $10k:| Dartmouth: | 4.4% (33) |
| Massachusetts: | 6.2% (12,456) |
Number of families with income $10k - 20k:| Dartmouth: | 3.6% (27) |
| State: | 6.0% (12,071) |
Number of families with income $20k - 30k:| Dartmouth: | 15.0% (112) |
| State: | 10.1% (20,376) |
Number of families with income $30k - 40k:| Dartmouth: | 8.3% (62) |
| Massachusetts: | 8.2% (16,470) |
Number of families with income $40k - 50k:| Dartmouth: | 6.9% (51) |
| State: | 7.4% (14,829) |
Number of families with income $50k - 60k:| Dartmouth: | 3.0% (22) |
| State: | 7.3% (14,643) |
Number of families with income $60k - 75k:| Dartmouth: | 10.2% (76) |
| State: | 10.6% (21,252) |
Number of families with income $75k - 100k:| Dartmouth: | 11.5% (86) |
| Massachusetts: | 12.0% (24,088) |
Number of families with income $100k - 125k:| Dartmouth: | 12.0% (89) |
| State: | 8.9% (17,954) |
Number of families with income $125k - 150k:| Dartmouth: | 7.9% (59) |
| State: | 6.9% (13,837) |
Number of families with income $150k - 200k:| Dartmouth: | 8.1% (60) |
| State: | 7.3% (14,683) |
Number of families with income > $200k:| Dartmouth: | 9.3% (69) |
| Massachusetts: | 9.3% (18,741) |
Median non-family income in Dartmouth in 2022:| Dartmouth: | $115,840 |
| State: | $37,563 |
Median per capita income in Dartmouth in 2022:| Dartmouth: | $112,287 |
| State: | $28,993 |
Change in median per capita income between 2000 and 2022:| Dartmouth, Massachusetts: | +98.7% |
| State: | +142.4% |
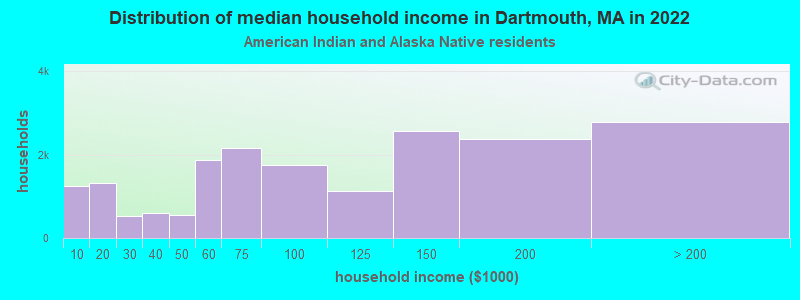
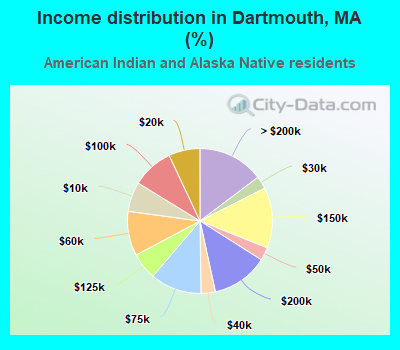
Income statistics for American Indian and Alaska Native residents
Median household income in Dartmouth, MA in 2022:| Dartmouth: | $239,948 |
| State: | $87,730 |
Change in median household income between 2000 and 2022:| Dartmouth, Massachusetts: | +134.6% |
| State: | +138.3% |
Number of households with income < $10k:| Dartmouth: | 6.6% (1,253) |
| Massachusetts: | 6.6% (451) |
Number of households with income $10k - 20k:| Dartmouth: | 7.0% (1,323) |
| Massachusetts: | 7.0% (476) |
Number of households with income $20k - 30k:| Dartmouth: | 2.8% (534) |
| Massachusetts: | 2.8% (192) |
Number of households with income $30k - 40k:| Dartmouth: | 3.2% (606) |
| State: | 3.2% (218) |
Number of households with income $40k - 50k:| Dartmouth: | 2.9% (553) |
| Massachusetts: | 2.9% (199) |
Number of households with income $50k - 60k:| Dartmouth: | 9.9% (1,881) |
| State: | 9.9% (677) |
Number of households with income $60k - 75k:| Dartmouth: | 11.5% (2,170) |
| State: | 11.5% (781) |
Number of households with income $75k - 100k:| Dartmouth: | 9.2% (1,747) |
| Massachusetts: | 9.2% (629) |
Number of households with income $100k - 125k:| Dartmouth: | 6.0% (1,128) |
| State: | 6.0% (406) |
Number of households with income $125k - 150k:| Dartmouth: | 13.5% (2,559) |
| Massachusetts: | 13.5% (921) |
Number of households with income $150k - 200k:| Dartmouth: | 12.6% (2,386) |
| State: | 12.6% (859) |
Number of households with income > $200k:| Dartmouth: | 14.7% (2,786) |
| State: | 14.7% (1,003) |
Aggregate household income in Dartmouth in 2022: $968,129
Median per capita income in Dartmouth in 2022:| Dartmouth: | $13,064 |
| State: | $39,434 |
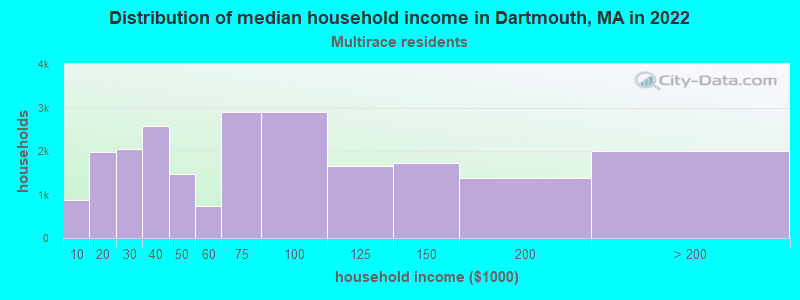
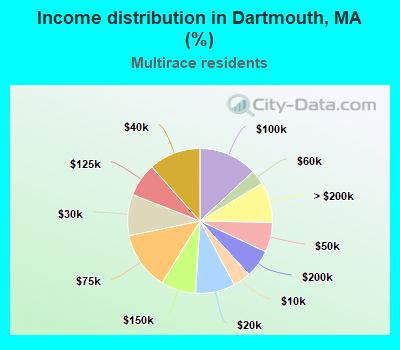
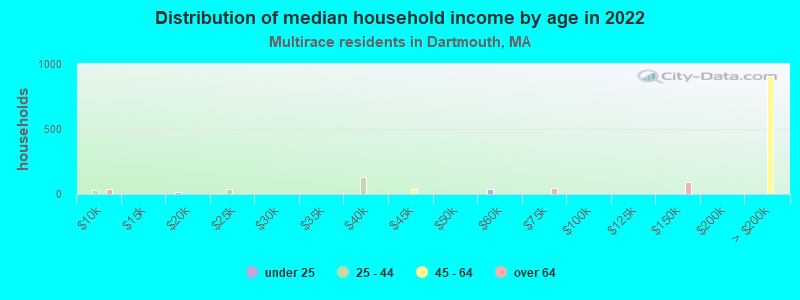
Income statistics for Multirace residents
Median household income in Dartmouth, MA in 2022:| Dartmouth: | $87,174 |
| State: | $71,552 |
Change in median household income between 2000 and 2022:| Dartmouth, Massachusetts: | +110.4% |
| State: | +109.0% |
Number of households with income < $10k:| Dartmouth: | 4.0% (880) |
| Massachusetts: | 6.6% (15,127) |
Number of households with income $10k - 20k:| Dartmouth: | 8.9% (1,971) |
| State: | 9.2% (21,158) |
Number of households with income $20k - 30k:| Dartmouth: | 9.2% (2,045) |
| State: | 7.8% (18,016) |
Number of households with income $30k - 40k:| Dartmouth: | 11.6% (2,570) |
| State: | 7.9% (18,260) |
Number of households with income $40k - 50k:| Dartmouth: | 6.6% (1,475) |
| State: | 5.6% (13,027) |
Number of households with income $50k - 60k:| Dartmouth: | 3.3% (729) |
| State: | 5.6% (12,909) |
Number of households with income $60k - 75k:| Dartmouth: | 13.0% (2,892) |
| State: | 9.0% (20,800) |
Number of households with income $75k - 100k:| Dartmouth: | 13.1% (2,905) |
| Massachusetts: | 12.1% (27,875) |
Number of households with income $100k - 125k:| Dartmouth: | 7.5% (1,663) |
| Massachusetts: | 8.1% (18,754) |
Number of households with income $125k - 150k:| Dartmouth: | 7.7% (1,721) |
| State: | 6.8% (15,621) |
Number of households with income $150k - 200k:| Dartmouth: | 6.2% (1,379) |
| Massachusetts: | 9.4% (21,618) |
Number of households with income > $200k:| Dartmouth: | 9.0% (2,003) |
| State: | 12.0% (27,592) |
Aggregate household income in Dartmouth in 2022: $78,105,314
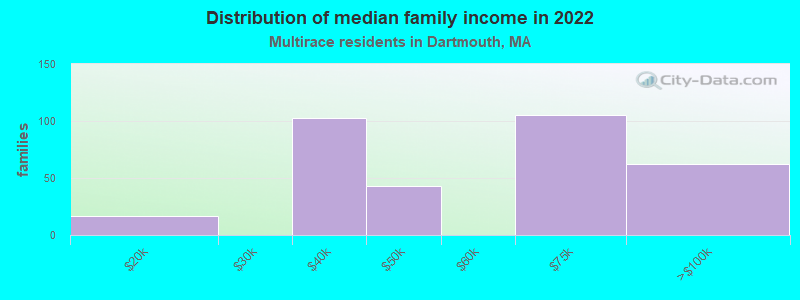
Median family income in Dartmouth in 2022:| Dartmouth: | $100,954 |
| State: | $78,380 |
Number of families with income $10k - 20k:| Dartmouth: | 5.3% (17) |
| State: | 4.9% (7,678) |
Number of families with income $30k - 40k:| Dartmouth: | 31.2% (103) |
| State: | 8.2% (12,705) |
Number of families with income $40k - 50k:| Dartmouth: | 13.1% (43) |
| State: | 5.3% (8,255) |
Number of families with income $60k - 75k:| Dartmouth: | 31.7% (105) |
| Massachusetts: | 10.3% (16,064) |
Number of families with income $75k - 100k:| Dartmouth: | 18.7% (62) |
| State: | 12.1% (18,758) |
Median non-family income in Dartmouth in 2022:| Dartmouth: | $124,468 |
| State: | $42,253 |
Median per capita income in Dartmouth in 2022:| Dartmouth: | $123,452 |
| State: | $34,029 |
Change in median per capita income between 2000 and 2022:| Dartmouth, Massachusetts: | +76.3% |
| State: | +132.1% |
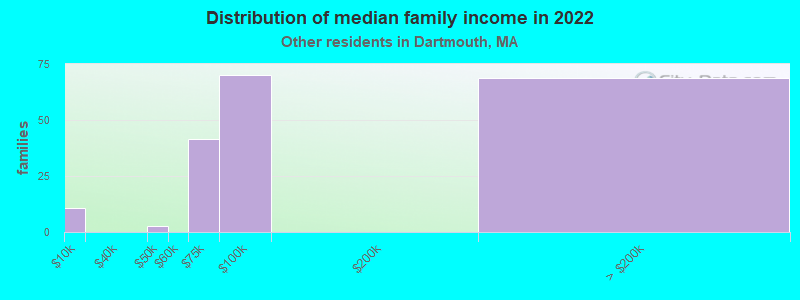
Income statistics for other residents
Number of households with income < $10k:| Dartmouth: | 9.8% (63) |
| State: | 8.4% (11,559) |
Number of households with income $10k - 20k:| Dartmouth: | 8.4% (54) |
| State: | 8.4% (11,499) |
Number of households with income $20k - 30k:| Dartmouth: | 12.5% (80) |
| State: | 9.5% (13,070) |
Number of households with income $30k - 40k:| Dartmouth: | 7.5% (48) |
| Massachusetts: | 6.0% (8,291) |
Number of households with income $40k - 50k:| Dartmouth: | 5.9% (38) |
| State: | 9.2% (12,611) |
Number of households with income $50k - 60k:| Dartmouth: | 10.6% (68) |
| State: | 7.9% (10,879) |
Number of households with income $60k - 75k:| Dartmouth: | 5.5% (35) |
| State: | 7.5% (10,239) |
Number of households with income $75k - 100k:| Dartmouth: | 11.1% (71) |
| State: | 13.1% (18,032) |
Number of households with income $100k - 125k:| Dartmouth: | 8.9% (57) |
| State: | 9.6% (13,141) |
Number of households with income $125k - 150k:| Dartmouth: | 7.6% (49) |
| State: | 5.0% (6,808) |
Number of households with income $150k - 200k:| Dartmouth: | 8.9% (57) |
| Massachusetts: | 6.4% (8,843) |
Number of households with income > $200k:| Dartmouth: | 3.3% (21) |
| State: | 9.0% (12,396) |
Aggregate household income in Dartmouth in 2022: $48,836,260
Median family income in Dartmouth in 2022:| Dartmouth: | $201,280 |
| State: | $66,840 |
Number of families with income < $10k:| Dartmouth: | 5.6% (11) |
| State: | 6.7% (6,769) |
Number of families with income $40k - 50k:| Dartmouth: | 1.3% (3) |
| State: | 8.9% (9,052) |
Number of families with income $60k - 75k:| Dartmouth: | 21.4% (41) |
| State: | 8.5% (8,683) |
Number of families with income $75k - 100k:| Dartmouth: | 36.3% (70) |
| Massachusetts: | 12.8% (12,997) |
Number of families with income > $200k:| Dartmouth: | 35.5% (69) |
| State: | 10.0% (10,188) |
Median non-family income in Dartmouth in 2022:| Dartmouth: | $80,002 |
| Massachusetts: | $36,127 |
Change in median non-family income between 2000 and 2022:| Dartmouth, Massachusetts: | +85.1% |
| Massachusetts: | +123.4% |
Median per capita income in Dartmouth in 2022:| Dartmouth: | $15,032 |
| State: | $30,797 |
Change in median per capita income between 2000 and 2022:| Dartmouth, Massachusetts: | +128.7% |
| Massachusetts: | +188.5% |