Chance-Loeb, Texas (TX) income map, earnings map, and wages data
The median household income in Chance-Loeb, TX in 2022 was $74,667, which was 3.2% greater than the median annual income of $72,284 across the entire state of Texas. Compared to the median income of $40,501 in 2000 this represents an increase of 45.8%. The per capita income in 2022 was $36,643, which means an increase of 48.5% compared to 2000 when it was $18,868.
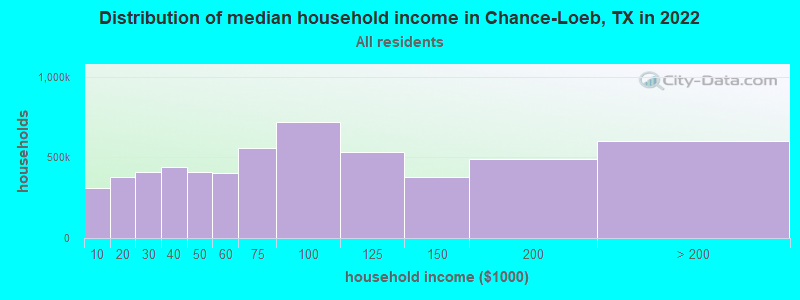
Income statistics for all residents
Median household income in Chance-Loeb, TX in 2022:| Chance-Loeb: | $74,667 |
| Texas: | $72,284 |
Change in median household income between 2000 and 2022:| Chance-Loeb, Texas: | +84.4% |
| State: | +81.0% |
Number of households with income < $10k:| Chance-Loeb: | 5.5% (309,728) |
| State: | 5.5% (611,011) |
Number of households with income $10k - 20k:| Chance-Loeb: | 6.7% (376,909) |
| State: | 6.7% (743,157) |
Number of households with income $20k - 30k:| Chance-Loeb: | 7.2% (407,466) |
| Texas: | 7.2% (803,381) |
Number of households with income $30k - 40k:| Chance-Loeb: | 7.8% (439,216) |
| State: | 7.8% (866,080) |
Number of households with income $40k - 50k:| Chance-Loeb: | 7.3% (411,016) |
| Texas: | 7.3% (810,440) |
Number of households with income $50k - 60k:| Chance-Loeb: | 7.2% (405,557) |
| State: | 7.2% (799,783) |
Number of households with income $60k - 75k:| Chance-Loeb: | 9.9% (555,480) |
| State: | 9.9% (1,095,384) |
Number of households with income $75k - 100k:| Chance-Loeb: | 12.8% (719,813) |
| State: | 12.8% (1,419,057) |
Number of households with income $100k - 125k:| Chance-Loeb: | 9.5% (534,986) |
| State: | 9.5% (1,054,577) |
Number of households with income $125k - 150k:| Chance-Loeb: | 6.7% (376,265) |
| State: | 6.7% (741,518) |
Number of households with income $150k - 200k:| Chance-Loeb: | 8.7% (487,757) |
| State: | 8.7% (961,776) |
Number of households with income > $200k:| Chance-Loeb: | 10.7% (598,964) |
| Texas: | 10.7% (1,181,544) |
Aggregate household income in Chance-Loeb in 2022: $68,140,881,713
Median family income in Chance-Loeb in 2022:| Chance-Loeb: | $86,651 |
| State: | $86,267 |
Median non-family income in Chance-Loeb in 2022:| Chance-Loeb: | $40,964 |
| State: | $45,999 |
Change in median non-family income between 2000 and 2022:| Chance-Loeb, Texas: | +85.2% |
| State: | +79.5% |
Median per capita income in Chance-Loeb in 2022:| Chance-Loeb: | $36,644 |
| State: | $38,123 |
Change in median per capita income between 2000 and 2022:| Chance-Loeb, Texas: | +94.2% |
| Texas: | +94.3% |
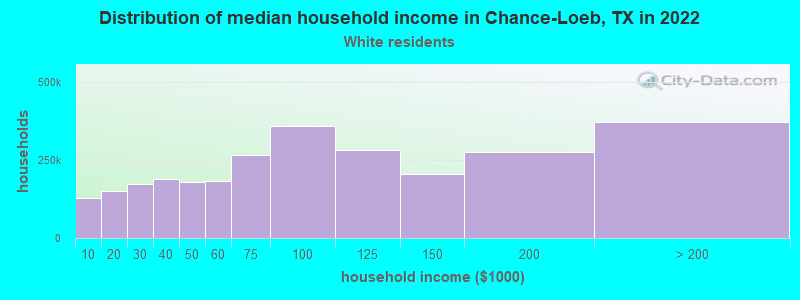
Income statistics for White residents
Median household income in Chance-Loeb, TX in 2022:| Chance-Loeb: | $77,202 |
| State: | $82,032 |
Change in median household income between 2000 and 2022:| Chance-Loeb, Texas: | +90.4% |
| State: | +91.0% |
Number of households with income < $10k:| Chance-Loeb: | 4.7% (128,837) |
| Texas: | 4.7% (273,716) |
Number of households with income $10k - 20k:| Chance-Loeb: | 5.5% (152,173) |
| State: | 5.5% (322,702) |
Number of households with income $20k - 30k:| Chance-Loeb: | 6.2% (171,717) |
| State: | 6.2% (363,947) |
Number of households with income $30k - 40k:| Chance-Loeb: | 6.8% (188,223) |
| Texas: | 6.8% (399,275) |
Number of households with income $40k - 50k:| Chance-Loeb: | 6.5% (180,682) |
| State: | 6.5% (383,417) |
Number of households with income $50k - 60k:| Chance-Loeb: | 6.6% (183,060) |
| Texas: | 6.6% (388,535) |
Number of households with income $60k - 75k:| Chance-Loeb: | 9.6% (266,461) |
| State: | 9.7% (566,295) |
Number of households with income $75k - 100k:| Chance-Loeb: | 13.0% (358,079) |
| Texas: | 13.0% (760,276) |
Number of households with income $100k - 125k:| Chance-Loeb: | 10.2% (281,464) |
| State: | 10.2% (597,596) |
Number of households with income $125k - 150k:| Chance-Loeb: | 7.4% (205,686) |
| Texas: | 7.4% (436,830) |
Number of households with income $150k - 200k:| Chance-Loeb: | 9.9% (274,326) |
| State: | 9.9% (583,067) |
Number of households with income > $200k:| Chance-Loeb: | 13.5% (371,958) |
| State: | 13.5% (792,647) |
Aggregate household income in Chance-Loeb in 2022: $40,733,728,705
Median family income in Chance-Loeb in 2022:| Chance-Loeb: | $91,951 |
| Texas: | $101,788 |
Number of families with income < $10k:| Chance-Loeb: | 2.2% (70) |
| State: | 2.8% (108,142) |
Number of families with income $10k - 20k:| Chance-Loeb: | 2.8% (91) |
| State: | 2.9% (113,421) |
Number of families with income $20k - 30k:| Chance-Loeb: | 6.7% (213) |
| Texas: | 4.1% (157,688) |
Number of families with income $30k - 40k:| Chance-Loeb: | 9.0% (286) |
| Texas: | 5.2% (198,847) |
Number of families with income $40k - 50k:| Chance-Loeb: | 9.5% (302) |
| State: | 5.6% (216,490) |
Number of families with income $50k - 60k:| Chance-Loeb: | 6.6% (211) |
| State: | 5.7% (220,689) |
Number of families with income $60k - 75k:| Chance-Loeb: | 11.1% (353) |
| Texas: | 9.0% (346,106) |
Number of families with income $75k - 100k:| Chance-Loeb: | 22.4% (713) |
| Texas: | 13.7% (527,363) |
Number of families with income $100k - 125k:| Chance-Loeb: | 12.8% (407) |
| State: | 11.6% (448,411) |
Number of families with income $125k - 150k:| Chance-Loeb: | 8.8% (280) |
| State: | 9.2% (355,798) |
Number of families with income $150k - 200k:| Chance-Loeb: | 2.2% (70) |
| State: | 12.5% (480,185) |
Number of families with income > $200k:| Chance-Loeb: | 6.0% (190) |
| Texas: | 17.6% (677,490) |
Median non-family income in Chance-Loeb in 2022:| Chance-Loeb: | $41,334 |
| State: | $50,587 |
Change in median non-family income between 2000 and 2022:| Chance-Loeb, Texas: | +85.8% |
| State: | +87.7% |
Median per capita income in Chance-Loeb in 2022:| Chance-Loeb: | $40,393 |
| Texas: | $47,740 |
Change in median per capita income between 2000 and 2022:| Chance-Loeb, Texas: | +112.1% |
| State: | +114.3% |
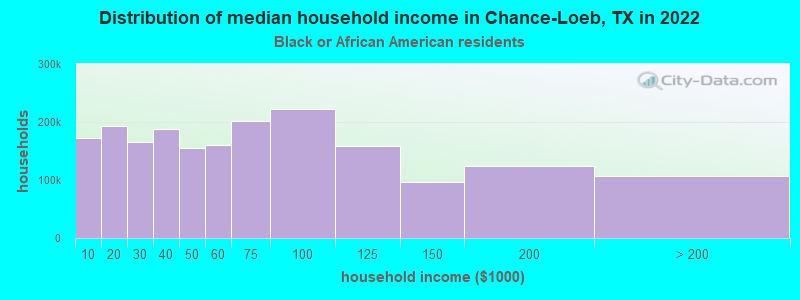
Income statistics for Black or African American residents
Median household income in Chance-Loeb, TX in 2022:| Chance-Loeb: | $171,875 |
| State: | $55,759 |
Change in median household income between 2000 and 2022:| Chance-Loeb, Texas: | +113.5% |
| State: | +90.3% |
Number of households with income < $10k:| Chance-Loeb: | 8.9% (172,917) |
| State: | 8.9% (126,378) |
Number of households with income $10k - 20k:| Chance-Loeb: | 9.9% (193,320) |
| Texas: | 9.9% (140,369) |
Number of households with income $20k - 30k:| Chance-Loeb: | 8.5% (166,322) |
| Texas: | 8.5% (120,639) |
Number of households with income $30k - 40k:| Chance-Loeb: | 9.7% (188,045) |
| State: | 9.7% (137,517) |
Number of households with income $40k - 50k:| Chance-Loeb: | 7.9% (154,483) |
| State: | 8.0% (112,973) |
Number of households with income $50k - 60k:| Chance-Loeb: | 8.2% (160,073) |
| State: | 8.3% (117,156) |
Number of households with income $60k - 75k:| Chance-Loeb: | 10.4% (202,068) |
| State: | 10.4% (147,462) |
Number of households with income $75k - 100k:| Chance-Loeb: | 11.5% (223,117) |
| Texas: | 11.5% (162,718) |
Number of households with income $100k - 125k:| Chance-Loeb: | 8.1% (158,415) |
| Texas: | 8.2% (115,829) |
Number of households with income $125k - 150k:| Chance-Loeb: | 4.9% (95,996) |
| State: | 4.9% (69,556) |
Number of households with income $150k - 200k:| Chance-Loeb: | 6.4% (124,332) |
| Texas: | 6.4% (90,701) |
Number of households with income > $200k:| Chance-Loeb: | 5.5% (106,816) |
| State: | 5.5% (77,988) |
Aggregate household income in Chance-Loeb in 2022: $17,685,490
Median family income in Chance-Loeb in 2022:| Chance-Loeb: | $180,128 |
| Texas: | $69,134 |
Number of families with income $75k - 100k:| Chance-Loeb: | 100.0% (20) |
| Texas: | 12.7% (103,723) |
Median per capita income in Chance-Loeb in 2022:| Chance-Loeb: | $37,228 |
| State: | $30,490 |
Change in median per capita income between 2000 and 2022:| Chance-Loeb, Texas: | +116.3% |
| Texas: | +113.9% |
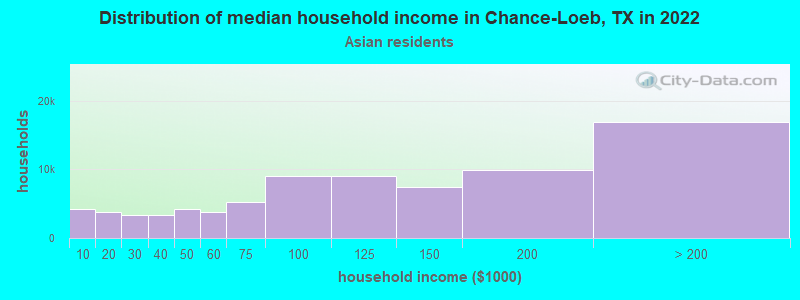
Income statistics for Asian residents
Median household income in Chance-Loeb, TX in 2022:| Chance-Loeb: | $28,959 |
| Texas: | $107,673 |
Change in median household income between 2000 and 2022:| Chance-Loeb, Texas: | +105.9% |
| Texas: | +115.1% |
Number of households with income < $10k:| Chance-Loeb: | 5.3% (4,204) |
| Texas: | 5.2% (29,885) |
Number of households with income $10k - 20k:| Chance-Loeb: | 4.8% (3,804) |
| Texas: | 4.7% (27,044) |
Number of households with income $20k - 30k:| Chance-Loeb: | 4.1% (3,279) |
| Texas: | 4.1% (23,363) |
Number of households with income $30k - 40k:| Chance-Loeb: | 4.1% (3,278) |
| State: | 4.1% (23,309) |
Number of households with income $40k - 50k:| Chance-Loeb: | 5.2% (4,190) |
| State: | 5.2% (29,826) |
Number of households with income $50k - 60k:| Chance-Loeb: | 4.6% (3,717) |
| State: | 4.7% (26,512) |
Number of households with income $60k - 75k:| Chance-Loeb: | 6.5% (5,191) |
| State: | 6.5% (36,905) |
Number of households with income $75k - 100k:| Chance-Loeb: | 11.3% (9,026) |
| State: | 11.3% (64,350) |
Number of households with income $100k - 125k:| Chance-Loeb: | 11.3% (9,084) |
| State: | 11.4% (64,714) |
Number of households with income $125k - 150k:| Chance-Loeb: | 9.3% (7,406) |
| State: | 9.3% (52,719) |
Number of households with income $150k - 200k:| Chance-Loeb: | 12.5% (9,969) |
| Texas: | 12.5% (70,953) |
Number of households with income > $200k:| Chance-Loeb: | 21.1% (16,895) |
| State: | 21.1% (120,260) |
Aggregate household income in Chance-Loeb in 2022: $12,169,594
Median family income in Chance-Loeb in 2022:| Chance-Loeb: | $30,014 |
| State: | $123,328 |
Number of families with income $10k - 20k:| Chance-Loeb: | 26.6% (7) |
| State: | 3.0% (13,043) |
Number of families with income $100k - 125k:| Chance-Loeb: | 73.4% (18) |
| State: | 11.3% (49,585) |
Median per capita income in Chance-Loeb in 2022:| Chance-Loeb: | $28,336 |
| State: | $48,626 |
Change in median per capita income between 2000 and 2022:| Chance-Loeb, Texas: | +127.1% |
| State: | +132.0% |
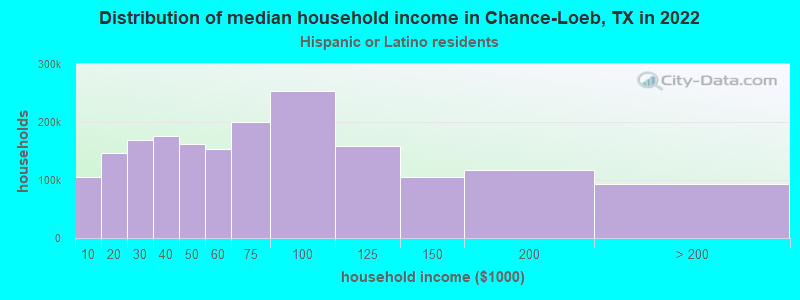
Income statistics for Hispanic or Latino residents
Median household income in Chance-Loeb, TX in 2022:| Chance-Loeb: | $62,943 |
| State: | $60,504 |
Change in median household income between 2000 and 2022:| Chance-Loeb, Texas: | +112.9% |
| State: | +102.5% |
Number of households with income < $10k:| Chance-Loeb: | 5.8% (105,991) |
| Texas: | 5.8% (213,953) |
Number of households with income $10k - 20k:| Chance-Loeb: | 8.0% (147,408) |
| State: | 8.0% (297,456) |
Number of households with income $20k - 30k:| Chance-Loeb: | 9.2% (168,424) |
| State: | 9.2% (340,166) |
Number of households with income $30k - 40k:| Chance-Loeb: | 9.5% (175,599) |
| Texas: | 9.5% (354,336) |
Number of households with income $40k - 50k:| Chance-Loeb: | 8.8% (161,949) |
| State: | 8.8% (327,013) |
Number of households with income $50k - 60k:| Chance-Loeb: | 8.3% (152,848) |
| Texas: | 8.3% (308,818) |
Number of households with income $60k - 75k:| Chance-Loeb: | 10.9% (200,683) |
| State: | 10.9% (405,109) |
Number of households with income $75k - 100k:| Chance-Loeb: | 13.8% (253,569) |
| Texas: | 13.8% (511,639) |
Number of households with income $100k - 125k:| Chance-Loeb: | 8.6% (158,468) |
| State: | 8.6% (319,728) |
Number of households with income $125k - 150k:| Chance-Loeb: | 5.7% (104,635) |
| State: | 5.7% (210,932) |
Number of households with income $150k - 200k:| Chance-Loeb: | 6.4% (116,858) |
| State: | 6.4% (236,055) |
Number of households with income > $200k:| Chance-Loeb: | 5.1% (93,821) |
| Texas: | 5.1% (189,259) |
Aggregate household income in Chance-Loeb in 2022: $145,305,884
Median family income in Chance-Loeb in 2022:| Chance-Loeb: | $62,407 |
| State: | $65,080 |
Number of families with income < $10k:| Chance-Loeb: | 5.1% (144) |
| State: | 5.3% (147,493) |
Number of families with income $10k - 20k:| Chance-Loeb: | 7.7% (217) |
| State: | 6.3% (174,531) |
Number of families with income $20k - 30k:| Chance-Loeb: | 13.7% (385) |
| Texas: | 8.6% (238,528) |
Number of families with income $30k - 40k:| Chance-Loeb: | 14.4% (405) |
| State: | 9.1% (251,999) |
Number of families with income $40k - 50k:| Chance-Loeb: | 12.2% (342) |
| State: | 8.6% (240,188) |
Number of families with income $50k - 60k:| Chance-Loeb: | 7.2% (201) |
| State: | 8.0% (223,566) |
Number of families with income $60k - 75k:| Chance-Loeb: | 10.2% (287) |
| Texas: | 10.9% (302,688) |
Number of families with income $75k - 100k:| Chance-Loeb: | 16.5% (463) |
| State: | 14.3% (398,554) |
Number of families with income $100k - 125k:| Chance-Loeb: | 6.9% (194) |
| State: | 9.5% (264,007) |
Number of families with income $125k - 150k:| Chance-Loeb: | 4.0% (111) |
| State: | 6.2% (171,274) |
Number of families with income $150k - 200k:| Chance-Loeb: | 0.8% (22) |
| Texas: | 7.3% (202,259) |
Number of families with income > $200k:| Chance-Loeb: | 1.5% (41) |
| State: | 5.9% (165,129) |
Median non-family income in Chance-Loeb in 2022:| Chance-Loeb: | $62,104 |
| State: | $39,934 |
Change in median non-family income between 2000 and 2022:| Chance-Loeb, Texas: | +120.8% |
| State: | +109.1% |
Median per capita income in Chance-Loeb in 2022:| Chance-Loeb: | $26,490 |
| State: | $24,862 |
Change in median per capita income between 2000 and 2022:| Chance-Loeb, Texas: | +128.5% |
| Texas: | +130.8% |
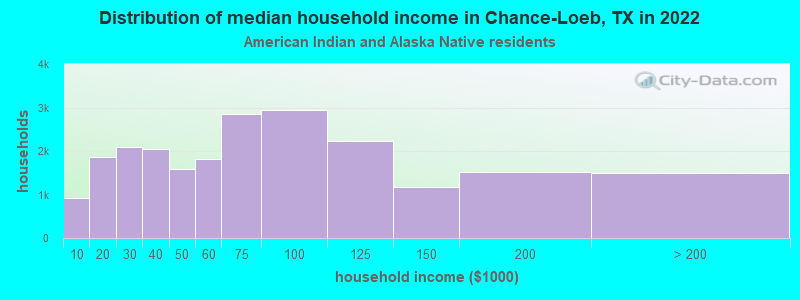
Income statistics for American Indian and Alaska Native residents
Median household income in Chance-Loeb, TX in 2022:| Chance-Loeb: | $36,323 |
| Texas: | $65,765 |
Change in median household income between 2000 and 2022:| Chance-Loeb, Texas: | +93.7% |
| Texas: | +88.3% |
Number of households with income < $10k:| Chance-Loeb: | 4.1% (914) |
| State: | 4.1% (3,398) |
Number of households with income $10k - 20k:| Chance-Loeb: | 8.3% (1,868) |
| Texas: | 8.3% (6,949) |
Number of households with income $20k - 30k:| Chance-Loeb: | 9.3% (2,082) |
| State: | 9.3% (7,742) |
Number of households with income $30k - 40k:| Chance-Loeb: | 9.1% (2,049) |
| Texas: | 9.1% (7,627) |
Number of households with income $40k - 50k:| Chance-Loeb: | 7.1% (1,594) |
| Texas: | 7.1% (5,922) |
Number of households with income $50k - 60k:| Chance-Loeb: | 8.1% (1,818) |
| Texas: | 8.1% (6,761) |
Number of households with income $60k - 75k:| Chance-Loeb: | 12.7% (2,846) |
| State: | 12.7% (10,588) |
Number of households with income $75k - 100k:| Chance-Loeb: | 13.0% (2,932) |
| Texas: | 13.0% (10,903) |
Number of households with income $100k - 125k:| Chance-Loeb: | 9.9% (2,220) |
| State: | 9.9% (8,256) |
Number of households with income $125k - 150k:| Chance-Loeb: | 5.2% (1,170) |
| Texas: | 5.2% (4,355) |
Number of households with income $150k - 200k:| Chance-Loeb: | 6.7% (1,510) |
| State: | 6.7% (5,623) |
Number of households with income > $200k:| Chance-Loeb: | 6.6% (1,483) |
| Texas: | 6.6% (5,522) |
Aggregate household income in Chance-Loeb in 2022: $681,403
Median family income in Chance-Loeb in 2022:| Chance-Loeb: | $35,754 |
| Texas: | $72,369 |
Median per capita income in Chance-Loeb in 2022:| Chance-Loeb: | $20,698 |
| State: | $28,166 |
Change in median per capita income between 2000 and 2022:| Chance-Loeb, Texas: | +95.5% |
| Texas: | +77.2% |
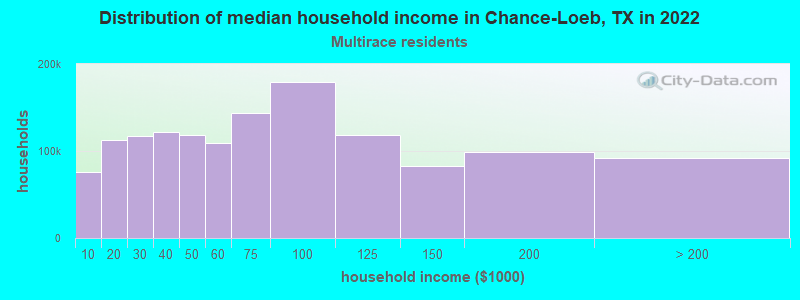
Income statistics for Multirace residents
Median household income in Chance-Loeb, TX in 2022:| Chance-Loeb: | $79,949 |
| State: | $62,748 |
Change in median household income between 2000 and 2022:| Chance-Loeb, Texas: | +97.9% |
| State: | +92.3% |
Number of households with income < $10k:| Chance-Loeb: | 5.5% (75,633) |
| Texas: | 5.5% (122,324) |
Number of households with income $10k - 20k:| Chance-Loeb: | 8.2% (112,677) |
| State: | 8.2% (182,232) |
Number of households with income $20k - 30k:| Chance-Loeb: | 8.5% (117,022) |
| State: | 8.5% (189,456) |
Number of households with income $30k - 40k:| Chance-Loeb: | 8.9% (122,083) |
| State: | 8.9% (197,499) |
Number of households with income $40k - 50k:| Chance-Loeb: | 8.7% (118,583) |
| Texas: | 8.7% (191,735) |
Number of households with income $50k - 60k:| Chance-Loeb: | 8.0% (109,679) |
| State: | 8.0% (177,535) |
Number of households with income $60k - 75k:| Chance-Loeb: | 10.5% (143,758) |
| Texas: | 10.5% (232,479) |
Number of households with income $75k - 100k:| Chance-Loeb: | 13.1% (179,545) |
| State: | 13.1% (290,448) |
Number of households with income $100k - 125k:| Chance-Loeb: | 8.7% (118,490) |
| State: | 8.6% (191,595) |
Number of households with income $125k - 150k:| Chance-Loeb: | 6.0% (82,532) |
| Texas: | 6.0% (133,361) |
Number of households with income $150k - 200k:| Chance-Loeb: | 7.2% (98,299) |
| State: | 7.2% (159,195) |
Number of households with income > $200k:| Chance-Loeb: | 6.7% (91,523) |
| State: | 6.7% (148,064) |
Aggregate household income in Chance-Loeb in 2022: $65,610,042
Median family income in Chance-Loeb in 2022:| Chance-Loeb: | $36,322 |
| Texas: | $69,780 |
Number of families with income < $10k:| Chance-Loeb: | 26.0% (75) |
| State: | 4.4% (70,825) |
Number of families with income $10k - 20k:| Chance-Loeb: | 23.0% (66) |
| Texas: | 5.9% (95,279) |
Number of families with income $40k - 50k:| Chance-Loeb: | 18.4% (53) |
| State: | 8.4% (135,809) |
Number of families with income $50k - 60k:| Chance-Loeb: | 32.6% (94) |
| State: | 7.9% (127,739) |
Median non-family income in Chance-Loeb in 2022:| Chance-Loeb: | $7,243 |
| Texas: | $40,634 |
Change in median non-family income between 2000 and 2022:| Chance-Loeb, Texas: | +93.2% |
| Texas: | +77.2% |
Median per capita income in Chance-Loeb in 2022:| Chance-Loeb: | $23,165 |
| State: | $26,785 |
Change in median per capita income between 2000 and 2022:| Chance-Loeb, Texas: | +108.4% |
| Texas: | +110.9% |
Income statistics for other residents
Number of households with income < $10k:| Chance-Loeb: | 4.3% (1) |
| State: | 5.9% (54,162) |
Number of households with income $10k - 20k:| Chance-Loeb: | 8.7% (2) |
| State: | 6.8% (62,891) |
Number of households with income $20k - 30k:| Chance-Loeb: | 8.7% (2) |
| State: | 10.6% (97,294) |
Number of households with income $30k - 40k:| Chance-Loeb: | 8.7% (2) |
| Texas: | 10.8% (99,670) |
Number of households with income $40k - 50k:| Chance-Loeb: | 8.7% (2) |
| State: | 9.3% (85,548) |
Number of households with income $50k - 60k:| Chance-Loeb: | 8.7% (2) |
| State: | 9.0% (82,757) |
Number of households with income $60k - 75k:| Chance-Loeb: | 13.0% (3) |
| State: | 10.9% (100,326) |
Number of households with income $75k - 100k:| Chance-Loeb: | 17.4% (4) |
| Texas: | 14.0% (128,767) |
Number of households with income $100k - 125k:| Chance-Loeb: | 8.7% (2) |
| State: | 8.2% (75,218) |
Number of households with income $125k - 150k:| Chance-Loeb: | 4.3% (1) |
| State: | 4.8% (44,223) |
Number of households with income $150k - 200k:| Chance-Loeb: | 4.3% (1) |
| Texas: | 5.6% (51,376) |
Number of households with income > $200k:| Chance-Loeb: | 4.3% (1) |
| State: | 4.0% (36,393) |
Aggregate household income in Chance-Loeb in 2022: $1,833,937
Median family income in Chance-Loeb in 2022:| Chance-Loeb: | $60,321 |
| State: | $60,064 |
Median per capita income in Chance-Loeb in 2022:| Chance-Loeb: | $38,153 |
| State: | $23,899 |
Change in median per capita income between 2000 and 2022:| Chance-Loeb, Texas: | +141.8% |
| State: | +135.2% |