Central Colusa, California (CA) income map, earnings map, and wages data
The median household income in Central Colusa, CA in 2022 was $69,035, which was 32.6% less than the median annual income of $91,551 across the entire state of California. Compared to the median income of $36,602 in 2000 this represents an increase of 47.0%. The per capita income in 2022 was $28,181, which means an increase of 49.0% compared to 2000 when it was $14,368.
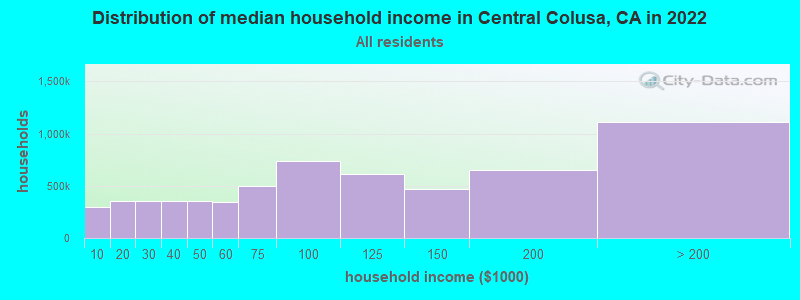
Income statistics for all residents
Median household income in Central Colusa, CA in 2022:| Central Colusa: | $69,036 |
| State: | $91,551 |
Change in median household income between 2000 and 2022:| Central Colusa, California: | +88.6% |
| State: | +92.8% |
Number of households with income < $10k:| Central Colusa: | 4.8% (252,066) |
| State: | 4.8% (654,370) |
Number of households with income $10k - 20k:| Central Colusa: | 5.8% (304,146) |
| California: | 5.8% (789,493) |
Number of households with income $20k - 30k:| Central Colusa: | 5.7% (299,874) |
| California: | 5.7% (778,318) |
Number of households with income $30k - 40k:| Central Colusa: | 5.8% (301,713) |
| State: | 5.8% (783,170) |
Number of households with income $40k - 50k:| Central Colusa: | 5.8% (301,027) |
| State: | 5.8% (781,352) |
Number of households with income $50k - 60k:| Central Colusa: | 5.6% (292,802) |
| State: | 5.6% (760,175) |
Number of households with income $60k - 75k:| Central Colusa: | 8.2% (425,537) |
| State: | 8.2% (1,104,699) |
Number of households with income $75k - 100k:| Central Colusa: | 12.0% (626,823) |
| California: | 12.0% (1,627,633) |
Number of households with income $100k - 125k:| Central Colusa: | 10.0% (523,289) |
| State: | 10.0% (1,358,619) |
Number of households with income $125k - 150k:| Central Colusa: | 7.6% (395,717) |
| State: | 7.6% (1,027,455) |
Number of households with income $150k - 200k:| Central Colusa: | 10.6% (554,518) |
| State: | 10.6% (1,439,811) |
Number of households with income > $200k:| Central Colusa: | 18.0% (941,637) |
| State: | 18.0% (2,445,491) |
Aggregate household income in Central Colusa in 2022: $57,152,566,496
Median family income in Central Colusa in 2022:| Central Colusa: | $79,033 |
| State: | $104,823 |
Median non-family income in Central Colusa in 2022:| Central Colusa: | $35,329 |
| California: | $59,348 |
Change in median non-family income between 2000 and 2022:| Central Colusa, California: | +76.6% |
| State: | +85.3% |
Median per capita income in Central Colusa in 2022:| Central Colusa: | $28,181 |
| State: | $46,661 |
Change in median per capita income between 2000 and 2022:| Central Colusa, California: | +96.1% |
| California: | +105.5% |
Income statistics for White residents
Median household income in Central Colusa, CA in 2022:| Central Colusa: | $78,056 |
| State: | $100,917 |
Change in median household income between 2000 and 2022:| Central Colusa, California: | +92.1% |
| State: | +96.8% |
Number of households with income < $10k:| Central Colusa: | 4.4% (112,851) |
| California: | 4.4% (284,109) |
Number of households with income $10k - 20k:| Central Colusa: | 5.3% (135,289) |
| State: | 5.3% (340,330) |
Number of households with income $20k - 30k:| Central Colusa: | 5.3% (136,352) |
| State: | 5.3% (343,145) |
Number of households with income $30k - 40k:| Central Colusa: | 5.1% (131,191) |
| State: | 5.1% (330,146) |
Number of households with income $40k - 50k:| Central Colusa: | 5.2% (133,246) |
| State: | 5.2% (335,310) |
Number of households with income $50k - 60k:| Central Colusa: | 5.1% (129,527) |
| California: | 5.1% (326,299) |
Number of households with income $60k - 75k:| Central Colusa: | 7.6% (193,708) |
| State: | 7.6% (487,640) |
Number of households with income $75k - 100k:| Central Colusa: | 11.5% (292,437) |
| California: | 11.5% (736,578) |
Number of households with income $100k - 125k:| Central Colusa: | 10.1% (257,489) |
| State: | 10.1% (648,782) |
Number of households with income $125k - 150k:| Central Colusa: | 7.8% (198,406) |
| State: | 7.8% (499,671) |
Number of households with income $150k - 200k:| Central Colusa: | 11.3% (289,494) |
| State: | 11.4% (729,603) |
Number of households with income > $200k:| Central Colusa: | 21.2% (540,770) |
| California: | 21.2% (1,364,246) |
Aggregate household income in Central Colusa in 2022: $22,764,561,099
Median family income in Central Colusa in 2022:| Central Colusa: | $96,585 |
| State: | $125,379 |
Number of families with income < $10k:| Central Colusa: | 3.6% (30) |
| State: | 2.2% (87,079) |
Number of families with income $10k - 20k:| Central Colusa: | 4.9% (41) |
| California: | 2.5% (97,716) |
Number of families with income $20k - 30k:| Central Colusa: | 6.5% (55) |
| State: | 3.5% (137,295) |
Number of families with income $30k - 40k:| Central Colusa: | 7.7% (65) |
| State: | 3.9% (152,947) |
Number of families with income $40k - 50k:| Central Colusa: | 8.8% (74) |
| California: | 4.3% (169,197) |
Number of families with income $50k - 60k:| Central Colusa: | 7.7% (65) |
| California: | 4.5% (176,192) |
Number of families with income $60k - 75k:| Central Colusa: | 11.6% (98) |
| State: | 7.0% (274,752) |
Number of families with income $75k - 100k:| Central Colusa: | 16.5% (139) |
| State: | 11.3% (445,632) |
Number of families with income $100k - 125k:| Central Colusa: | 8.3% (70) |
| State: | 10.7% (423,630) |
Number of families with income $125k - 150k:| Central Colusa: | 4.0% (34) |
| State: | 9.1% (357,408) |
Number of families with income $150k - 200k:| Central Colusa: | 10.0% (84) |
| State: | 13.5% (532,693) |
Number of families with income > $200k:| Central Colusa: | 10.4% (88) |
| California: | 27.6% (1,086,948) |
Median non-family income in Central Colusa in 2022:| Central Colusa: | $35,583 |
| California: | $62,819 |
Change in median non-family income between 2000 and 2022:| Central Colusa, California: | +75.2% |
| State: | +84.4% |
Median per capita income in Central Colusa in 2022:| Central Colusa: | $39,020 |
| California: | $61,706 |
Change in median per capita income between 2000 and 2022:| Central Colusa, California: | +113.4% |
| California: | +122.7% |
Income statistics for Black or African American residents
Median household income in Central Colusa, CA in 2022:| Central Colusa: | $64,647 |
| State: | $63,268 |
Change in median household income between 2000 and 2022:| Central Colusa, California: | +81.5% |
| California: | +81.0% |
Number of households with income < $10k:| Central Colusa: | 9.0% (37,294) |
| State: | 9.0% (73,219) |
Number of households with income $10k - 20k:| Central Colusa: | 10.6% (44,141) |
| State: | 10.6% (86,666) |
Number of households with income $20k - 30k:| Central Colusa: | 7.1% (29,394) |
| California: | 7.1% (57,719) |
Number of households with income $30k - 40k:| Central Colusa: | 7.2% (29,928) |
| State: | 7.2% (58,714) |
Number of households with income $40k - 50k:| Central Colusa: | 7.1% (29,564) |
| State: | 7.1% (58,075) |
Number of households with income $50k - 60k:| Central Colusa: | 6.8% (28,157) |
| California: | 6.8% (55,229) |
Number of households with income $60k - 75k:| Central Colusa: | 8.8% (36,590) |
| California: | 8.8% (71,895) |
Number of households with income $75k - 100k:| Central Colusa: | 11.9% (49,344) |
| State: | 11.9% (96,893) |
Number of households with income $100k - 125k:| Central Colusa: | 8.7% (35,990) |
| California: | 8.7% (70,729) |
Number of households with income $125k - 150k:| Central Colusa: | 6.3% (26,095) |
| State: | 6.3% (51,211) |
Number of households with income $150k - 200k:| Central Colusa: | 7.2% (29,892) |
| State: | 7.2% (58,687) |
Number of households with income > $200k:| Central Colusa: | 9.3% (38,418) |
| California: | 9.3% (75,487) |
Aggregate household income in Central Colusa in 2022: $1,814,139
Median family income in Central Colusa in 2022:| Central Colusa: | $69,031 |
| California: | $77,263 |
Median non-family income in Central Colusa in 2022:| Central Colusa: | $54,581 |
| State: | $41,942 |
Change in median non-family income between 2000 and 2022:| Central Colusa, California: | +89.8% |
| State: | +72.0% |
Median per capita income in Central Colusa in 2022:| Central Colusa: | $7,787 |
| State: | $36,708 |
Change in median per capita income between 2000 and 2022:| Central Colusa, California: | +75.5% |
| California: | +110.4% |
Income statistics for Asian residents
Median household income in Central Colusa, CA in 2022:| Central Colusa: | $81,975 |
| State: | $119,861 |
Change in median household income between 2000 and 2022:| Central Colusa, California: | +119.6% |
| California: | +116.5% |
Number of households with income < $10k:| Central Colusa: | 5.1% (35,808) |
| State: | 5.1% (106,273) |
Number of households with income $10k - 20k:| Central Colusa: | 4.9% (34,323) |
| State: | 4.9% (101,815) |
Number of households with income $20k - 30k:| Central Colusa: | 4.6% (31,813) |
| State: | 4.6% (94,414) |
Number of households with income $30k - 40k:| Central Colusa: | 4.1% (28,476) |
| State: | 4.1% (84,491) |
Number of households with income $40k - 50k:| Central Colusa: | 4.0% (27,551) |
| State: | 4.0% (81,758) |
Number of households with income $50k - 60k:| Central Colusa: | 3.9% (27,273) |
| State: | 3.9% (80,971) |
Number of households with income $60k - 75k:| Central Colusa: | 6.0% (41,845) |
| California: | 6.0% (124,194) |
Number of households with income $75k - 100k:| Central Colusa: | 9.7% (67,534) |
| State: | 9.7% (200,337) |
Number of households with income $100k - 125k:| Central Colusa: | 9.4% (65,196) |
| State: | 9.4% (193,488) |
Number of households with income $125k - 150k:| Central Colusa: | 7.7% (53,337) |
| State: | 7.7% (158,253) |
Number of households with income $150k - 200k:| Central Colusa: | 12.2% (84,954) |
| State: | 12.2% (252,139) |
Number of households with income > $200k:| Central Colusa: | 28.4% (197,646) |
| California: | 28.4% (586,641) |
Aggregate household income in Central Colusa in 2022: $153,660,891
Median family income in Central Colusa in 2022:| Central Colusa: | $83,728 |
| State: | $136,040 |
Number of families with income < $10k:| Central Colusa: | 14.9% (6) |
| State: | 2.8% (42,046) |
Number of families with income $20k - 30k:| Central Colusa: | 7.2% (3) |
| California: | 4.1% (61,519) |
Number of families with income $30k - 40k:| Central Colusa: | 14.9% (6) |
| State: | 3.7% (55,234) |
Number of families with income $40k - 50k:| Central Colusa: | 13.5% (6) |
| State: | 3.9% (58,471) |
Number of families with income $60k - 75k:| Central Colusa: | 6.4% (3) |
| California: | 5.9% (88,675) |
Number of families with income $100k - 125k:| Central Colusa: | 43.1% (18) |
| State: | 9.4% (142,085) |
Median non-family income in Central Colusa in 2022:| Central Colusa: | $45,382 |
| California: | $74,216 |
Change in median non-family income between 2000 and 2022:| Central Colusa, California: | +113.6% |
| State: | +136.3% |
Median per capita income in Central Colusa in 2022:| Central Colusa: | $40,530 |
| California: | $58,824 |
Change in median per capita income between 2000 and 2022:| Central Colusa, California: | +135.2% |
| State: | +166.8% |
Income statistics for Hispanic or Latino residents
Median household income in Central Colusa, CA in 2022:| Central Colusa: | $66,849 |
| California: | $75,698 |
Change in median household income between 2000 and 2022:| Central Colusa, California: | +106.9% |
| State: | +107.2% |
Number of households with income < $10k:| Central Colusa: | 4.3% (81,283) |
| State: | 4.3% (183,294) |
Number of households with income $10k - 20k:| Central Colusa: | 6.0% (112,479) |
| California: | 6.0% (253,903) |
Number of households with income $20k - 30k:| Central Colusa: | 6.8% (126,914) |
| State: | 6.8% (286,386) |
Number of households with income $30k - 40k:| Central Colusa: | 7.4% (139,001) |
| State: | 7.4% (313,728) |
Number of households with income $40k - 50k:| Central Colusa: | 7.4% (138,804) |
| California: | 7.4% (313,199) |
Number of households with income $50k - 60k:| Central Colusa: | 7.2% (135,318) |
| California: | 7.2% (305,366) |
Number of households with income $60k - 75k:| Central Colusa: | 10.3% (192,638) |
| State: | 10.3% (434,937) |
Number of households with income $75k - 100k:| Central Colusa: | 14.4% (268,712) |
| State: | 14.4% (607,302) |
Number of households with income $100k - 125k:| Central Colusa: | 10.6% (198,124) |
| California: | 10.6% (447,424) |
Number of households with income $125k - 150k:| Central Colusa: | 7.5% (139,765) |
| California: | 7.5% (316,022) |
Number of households with income $150k - 200k:| Central Colusa: | 9.1% (170,991) |
| State: | 9.2% (386,269) |
Number of households with income > $200k:| Central Colusa: | 8.8% (165,108) |
| State: | 8.8% (372,651) |
Aggregate household income in Central Colusa in 2022: $4,293,235,079
Median family income in Central Colusa in 2022:| Central Colusa: | $71,965 |
| State: | $77,589 |
Number of families with income < $10k:| Central Colusa: | 4.9% (30) |
| California: | 3.9% (129,468) |
Number of families with income $10k - 20k:| Central Colusa: | 7.9% (48) |
| State: | 4.6% (151,997) |
Number of families with income $20k - 30k:| Central Colusa: | 9.4% (58) |
| State: | 6.6% (216,764) |
Number of families with income $30k - 40k:| Central Colusa: | 8.3% (51) |
| California: | 7.6% (249,849) |
Number of families with income $40k - 50k:| Central Colusa: | 11.3% (69) |
| State: | 7.7% (254,822) |
Number of families with income $50k - 60k:| Central Colusa: | 11.4% (70) |
| State: | 7.4% (244,815) |
Number of families with income $60k - 75k:| Central Colusa: | 13.0% (80) |
| State: | 10.5% (345,838) |
Number of families with income $75k - 100k:| Central Colusa: | 16.6% (102) |
| State: | 14.9% (491,589) |
Number of families with income $100k - 125k:| Central Colusa: | 7.0% (43) |
| California: | 10.7% (355,400) |
Number of families with income $125k - 150k:| Central Colusa: | 2.6% (16) |
| California: | 7.8% (259,317) |
Number of families with income $150k - 200k:| Central Colusa: | 4.7% (29) |
| State: | 9.3% (306,566) |
Number of families with income > $200k:| Central Colusa: | 2.9% (18) |
| State: | 9.1% (299,984) |
Median non-family income in Central Colusa in 2022:| Central Colusa: | $22,269 |
| State: | $49,746 |
Change in median non-family income between 2000 and 2022:| Central Colusa, California: | +97.9% |
| State: | +100.7% |
Median per capita income in Central Colusa in 2022:| Central Colusa: | $20,374 |
| California: | $27,240 |
Change in median per capita income between 2000 and 2022:| Central Colusa, California: | +130.5% |
| California: | +133.3% |
Income statistics for American Indian and Alaska Native residents
Median household income in Central Colusa, CA in 2022:| Central Colusa: | $59,477 |
| State: | $76,752 |
Change in median household income between 2000 and 2022:| Central Colusa, California: | +113.8% |
| California: | +110.0% |
Number of households with income < $10k:| Central Colusa: | 5.4% (3,209) |
| State: | 5.4% (8,471) |
Number of households with income $10k - 20k:| Central Colusa: | 6.0% (3,541) |
| California: | 6.0% (9,381) |
Number of households with income $20k - 30k:| Central Colusa: | 5.6% (3,327) |
| California: | 5.5% (8,668) |
Number of households with income $30k - 40k:| Central Colusa: | 8.2% (4,880) |
| State: | 8.3% (13,030) |
Number of households with income $40k - 50k:| Central Colusa: | 7.0% (4,130) |
| California: | 6.9% (10,908) |
Number of households with income $50k - 60k:| Central Colusa: | 7.1% (4,221) |
| California: | 7.1% (11,198) |
Number of households with income $60k - 75k:| Central Colusa: | 9.6% (5,701) |
| California: | 9.6% (15,190) |
Number of households with income $75k - 100k:| Central Colusa: | 14.0% (8,328) |
| California: | 14.1% (22,274) |
Number of households with income $100k - 125k:| Central Colusa: | 11.3% (6,690) |
| California: | 11.2% (17,643) |
Number of households with income $125k - 150k:| Central Colusa: | 8.3% (4,902) |
| California: | 8.3% (13,117) |
Number of households with income $150k - 200k:| Central Colusa: | 8.8% (5,210) |
| State: | 8.8% (13,853) |
Number of households with income > $200k:| Central Colusa: | 8.8% (5,231) |
| State: | 8.8% (13,925) |
Aggregate household income in Central Colusa in 2022: $5,978,775
Median family income in Central Colusa in 2022:| Central Colusa: | $61,898 |
| State: | $81,108 |
Number of families with income $20k - 30k:| Central Colusa: | 65.1% (12) |
| State: | 4.3% (4,876) |
Number of families with income $30k - 40k:| Central Colusa: | 7.5% (1) |
| State: | 8.8% (9,994) |
Number of families with income $50k - 60k:| Central Colusa: | 27.3% (5) |
| State: | 6.9% (7,834) |
Median non-family income in Central Colusa in 2022:| Central Colusa: | $54,763 |
| State: | $51,296 |
Change in median non-family income between 2000 and 2022:| Central Colusa, California: | +80.0% |
| California: | +114.0% |
Median per capita income in Central Colusa in 2022:| Central Colusa: | $15,367 |
| State: | $30,289 |
Change in median per capita income between 2000 and 2022:| Central Colusa, California: | +99.9% |
| State: | +98.9% |
Income statistics for Multirace residents
Median household income in Central Colusa, CA in 2022:| Central Colusa: | $42,882 |
| State: | $83,153 |
Change in median household income between 2000 and 2022:| Central Colusa, California: | +99.3% |
| State: | +106.0% |
Number of households with income < $10k:| Central Colusa: | 4.2% (22,779) |
| State: | 4.2% (85,299) |
Number of households with income $10k - 20k:| Central Colusa: | 6.1% (32,817) |
| State: | 6.1% (122,966) |
Number of households with income $20k - 30k:| Central Colusa: | 6.4% (34,555) |
| State: | 6.4% (129,328) |
Number of households with income $30k - 40k:| Central Colusa: | 6.4% (34,739) |
| State: | 6.4% (130,070) |
Number of households with income $40k - 50k:| Central Colusa: | 6.5% (35,040) |
| California: | 6.5% (131,254) |
Number of households with income $50k - 60k:| Central Colusa: | 6.5% (35,341) |
| State: | 6.5% (132,382) |
Number of households with income $60k - 75k:| Central Colusa: | 9.4% (51,082) |
| State: | 9.4% (191,472) |
Number of households with income $75k - 100k:| Central Colusa: | 13.3% (71,891) |
| California: | 13.3% (269,691) |
Number of households with income $100k - 125k:| Central Colusa: | 10.2% (55,309) |
| State: | 10.2% (207,286) |
Number of households with income $125k - 150k:| Central Colusa: | 7.8% (42,173) |
| California: | 7.8% (158,259) |
Number of households with income $150k - 200k:| Central Colusa: | 10.3% (55,806) |
| State: | 10.3% (209,227) |
Number of households with income > $200k:| Central Colusa: | 13.0% (70,226) |
| California: | 13.0% (263,210) |
Aggregate household income in Central Colusa in 2022: $219,876,091
Median family income in Central Colusa in 2022:| Central Colusa: | $42,610 |
| State: | $87,642 |
Number of families with income < $10k:| Central Colusa: | 4.5% (17) |
| State: | 3.2% (48,017) |
Number of families with income $10k - 20k:| Central Colusa: | 13.4% (52) |
| State: | 4.1% (60,419) |
Number of families with income $20k - 30k:| Central Colusa: | 7.9% (31) |
| California: | 6.1% (89,742) |
Number of families with income $30k - 40k:| Central Colusa: | 4.5% (17) |
| State: | 6.2% (91,415) |
Number of families with income $40k - 50k:| Central Colusa: | 3.0% (11) |
| State: | 6.8% (100,085) |
Number of families with income $50k - 60k:| Central Colusa: | 12.8% (49) |
| State: | 6.7% (98,298) |
Number of families with income $75k - 100k:| Central Colusa: | 14.8% (57) |
| California: | 13.8% (203,439) |
Number of families with income $150k - 200k:| Central Colusa: | 39.1% (150) |
| State: | 10.9% (161,643) |
Median non-family income in Central Colusa in 2022:| Central Colusa: | $39,831 |
| State: | $56,558 |
Change in median non-family income between 2000 and 2022:| Central Colusa, California: | +99.2% |
| State: | +100.2% |
Median per capita income in Central Colusa in 2022:| Central Colusa: | $17,760 |
| California: | $32,124 |
Change in median per capita income between 2000 and 2022:| Central Colusa, California: | +111.2% |
| State: | +120.4% |
Income statistics for other residents
Number of households with income < $10k:| Central Colusa: | 4.6% (560) |
| State: | 4.6% (93,035) |
Number of households with income $10k - 20k:| Central Colusa: | 6.3% (760) |
| State: | 6.3% (126,222) |
Number of households with income $20k - 30k:| Central Colusa: | 7.1% (859) |
| California: | 7.1% (142,656) |
Number of households with income $30k - 40k:| Central Colusa: | 8.2% (994) |
| State: | 8.2% (165,018) |
Number of households with income $40k - 50k:| Central Colusa: | 8.1% (974) |
| State: | 8.0% (161,732) |
Number of households with income $50k - 60k:| Central Colusa: | 7.6% (916) |
| State: | 7.6% (152,152) |
Number of households with income $60k - 75k:| Central Colusa: | 10.4% (1,262) |
| State: | 10.4% (209,951) |
Number of households with income $75k - 100k:| Central Colusa: | 14.7% (1,779) |
| California: | 14.7% (296,102) |
Number of households with income $100k - 125k:| Central Colusa: | 10.6% (1,288) |
| California: | 10.7% (214,281) |
Number of households with income $125k - 150k:| Central Colusa: | 7.1% (860) |
| California: | 7.1% (143,092) |
Number of households with income $150k - 200k:| Central Colusa: | 8.6% (1,036) |
| State: | 8.6% (172,215) |
Number of households with income > $200k:| Central Colusa: | 6.7% (807) |
| California: | 6.7% (134,102) |
Aggregate household income in Central Colusa in 2022: $1,078,412,493
Median family income in Central Colusa in 2022:| Central Colusa: | $73,160 |
| State: | $72,756 |
Number of families with income < $10k:| Central Colusa: | 4.7% (36) |
| California: | 4.3% (69,090) |
Number of families with income $10k - 20k:| Central Colusa: | 7.0% (54) |
| California: | 5.1% (82,116) |
Number of families with income $20k - 30k:| Central Colusa: | 7.6% (59) |
| California: | 7.0% (112,854) |
Number of families with income $30k - 40k:| Central Colusa: | 16.4% (127) |
| State: | 8.4% (135,938) |
Number of families with income $40k - 50k:| Central Colusa: | 10.4% (81) |
| California: | 8.4% (135,353) |
Number of families with income $50k - 60k:| Central Colusa: | 10.4% (81) |
| State: | 7.7% (124,826) |
Number of families with income $60k - 75k:| Central Colusa: | 8.9% (69) |
| California: | 10.7% (173,628) |
Number of families with income $75k - 100k:| Central Colusa: | 20.2% (157) |
| State: | 15.2% (245,724) |
Number of families with income $100k - 125k:| Central Colusa: | 4.5% (35) |
| California: | 10.9% (176,716) |
Number of families with income $125k - 150k:| Central Colusa: | 6.5% (51) |
| California: | 7.4% (119,985) |
Number of families with income > $200k:| Central Colusa: | 3.3% (25) |
| State: | 6.6% (106,346) |
Median non-family income in Central Colusa in 2022:| Central Colusa: | $14,823 |
| California: | $43,881 |
Change in median non-family income between 2000 and 2022:| Central Colusa, California: | +99.5% |
| State: | +84.6% |
Median per capita income in Central Colusa in 2022:| Central Colusa: | $20,320 |
| State: | $25,164 |
Change in median per capita income between 2000 and 2022:| Central Colusa, California: | +138.7% |
| California: | +137.9% |