Housing density: 685 houses/condos per square mile
Median price asked for vacant for-sale houses and condos in 2022 in this county: $590,409.
Median contract rent in 2022: $1,559 (lower quartile is $941, upper quartile is $1,925)
Median rent asked for vacant for-rent units in 2022: $1,308
Median gross rent in Yarmouth, MA in 2022: $1,712
Housing units in Yarmouth with a mortgage: 4,432 (361 second mortgage, 537 home equity loan, 8 both second mortgage and home equity loan) Houses without a mortgage: 3,560
In family households: 166,746 (39,293 male householders, 19,431 female householders)
46,263 spouses, 49,194 children (46,119 natural, 1,413 adopted, 1,662 stepchildren), 2,708 grandchildren, 1,389 brothers or sisters, 1,739 parents, foster children, 1,437 other relatives, 4,251 non-relatives
In nonfamily households: 45,181 (14,943 male householders (11,462 living alone)), 22,088 female householders (18,982 living alone)), 8,150 nonrelatives
In group quarters: 3,961 (2,283 institutionalized population)
31,865 married couples with children.
10,220 single-parent households (1,900 men, 8,320 women).
92.6% of residents of Yarmouth speak English at home.
1.0% of residents speak Spanish at home (79% speak English very well, 14% speak English well, 7% speak English not well).
5.6% of residents speak other Indo-European language at home (60% speak English very well, 15% speak English well, 20% speak English not well, 6% don't speak English at all).
0.4% of residents speak Asian or Pacific Island language at home (55% speak English very well, 35% speak English well, 10% speak English not well).
0.3% of residents speak other language at home (65% speak English very well, 9% speak English well, 27% speak English not well).
Foreign born population: 2,702 (10.4%)
(50.4% of them are naturalized citizens)
Year of entry for the foreign-born population in Yarmouth, Massachusetts
4301995 to March 2000
1341990 to 1994
1521985 to 1989
921980 to 1984
231975 to 1979
231970 to 1974
271965 to 1969
539Before 1965
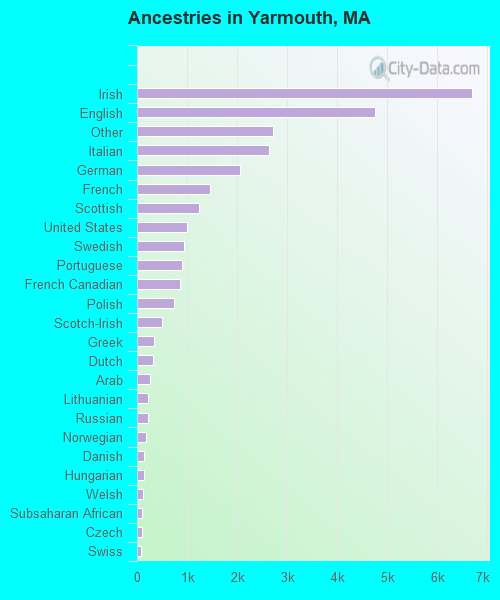
First ancestries reported:
Irish: 6,696 (23.3%)
English: 4,759 (16.6%)
Other: 2,711 (9.4%)
Italian: 2,638 (9.2%)
German: 2,063 (7.2%)
French: 1,454 (5.1%)
Scottish: 1,231 (4.3%)
United States: 996 (3.5%)
Swedish: 944 (3.3%)
Portuguese: 889 (3.1%)
French Canadian: 854 (3.0%)
Polish: 734 (2.6%)
Scotch-Irish: 496 (1.7%)
Greek: 330 (1.1%)
Dutch: 321 (1.1%)
Arab: 266 (0.9%)
Lithuanian: 227 (0.8%)
Russian: 219 (0.8%)
Norwegian: 173 (0.6%)
Danish: 145 (0.5%)
Hungarian: 131 (0.5%)
Welsh: 116 (0.4%)
Subsaharan African: 105 (0.4%)
Czech: 93 (0.3%)
Swiss: 74 (0.3%)
Ukrainian: 67 (0.2%)
West Indian: 5 (0.02%)
Most common places of birth for foreign-born residents (%):
Brazil
Yarmouth:
35.2% (500)
Massachusetts:
4.7% (36,669)
Canada
Yarmouth:
9.3% (132)
Massachusetts:
5.2% (40,247)
United Kingdom
Yarmouth:
8.8% (125)
Massachusetts:
3.3% (25,403)
Germany
Yarmouth:
8.4% (119)
Massachusetts:
1.9% (14,883)
Ireland
Yarmouth:
6.8% (97)
Massachusetts:
2.3% (17,987)
Pakistan
Yarmouth:
3.6% (51)
Massachusetts:
0.5% (3,660)
Netherlands
Yarmouth:
2.9% (41)
Massachusetts:
0.3% (2,470)
Greece
Yarmouth:
2.9% (41)
Massachusetts:
1.7% (12,975)
Portugal
Yarmouth:
2.0% (29)
Massachusetts:
8.6% (66,627)
Egypt
Yarmouth:
1.8% (26)
Massachusetts:
0.4% (2,726)
China, excluding Hong Kong and Taiwan
Yarmouth:
1.7% (24)
Massachusetts:
5.1% (39,255)
Other Northern Africa
Yarmouth:
1.5% (22)
Massachusetts:
0.5% (3,810)
Place of birth for U.S.-born residents:
This state: 16,496
Other state: 6,741
Northeast: 4,909
Midwest: 748
South: 657
West: 427
57% of Yarmouth residents lived in the same house 5 years ago. Out of people who lived in different houses, 55% lived in this county. Out of people who lived in different counties, 57% lived in Massachusetts.
Education attainment for males 25 years and older:
No schooling: 67
Nursery to 4th grade: 6
5th and 6th grade: 50
7th and 8th grade: 110
9th grade: 143
10th grade: 203
11th grade: 116
12th grade, no diploma: 271
High school graduate (or equivalency): 2,364
Less than 1 year of college: 547
Some college more than 1 year, no degree: 1,414
Associate degree: 638
Bachelor's degree: 1,680
Master's degree: 639
Professional school degree: 235
Doctorate degree: 88
Education attainment for females 25 years and older:
No schooling: 54
Nursery to 4th grade: 3
5th and 6th grade: 34
7th and 8th grade: 112
9th grade: 133
10th grade: 104
11th grade: 87
12th grade, no diploma: 281
High school graduate (or equivalency): 3,538
Less than 1 year of college: 1,071
Some college more than 1 year, no degree: 1,771
Associate degree: 1,119
Bachelor's degree: 1,541
Master's degree: 707
Professional school degree: 123
Doctorate degree: 43
Housing units in structures:
One, detached: 12,970
One, attached: 1,032
Two: 977
3 or 4: 285
5 to 9: 467
10 to 19: 163
20 to 49: 169
50 or more: 542
Housing units lacking complete plumbing facilities: 0.3%
Housing units lacking complete kitchen facilities: 1.2%