Woodstock, GA (Georgia) Houses and Residents
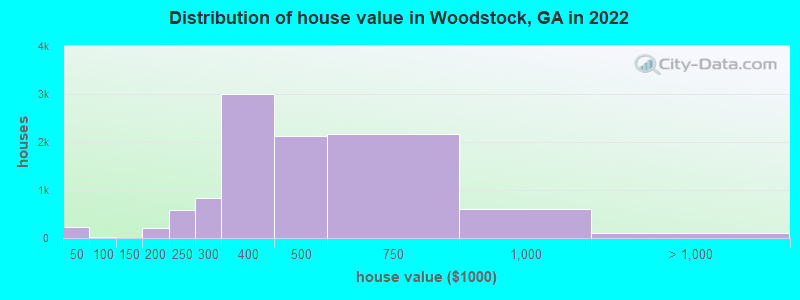
Estimated median house or condo value in 2022: $429,170 (it was $134,000 in 2000 )
Woodstock:
$429,170Georgia:
$297,400
Lower value quartile - upper value quartile: $351,038 - $568,563Mean price in 2022: Detached houses: $432,770 Here:
$432,770State:
$376,364
Townhouses or other attached units: $348,059 Here:
$348,059State:
$341,709
In 5-or-more-unit structures: $348,620 Here:
$348,620State:
$370,730
Total population: 27,823 (Urban population: 9,751, Rural population: 0)
Houses: 14,961 (14,346 occupied: 9,496 owner occupied, 5,061 renter occupied )
% of renters here:
35%State:
34%
Housing density: 1,698 houses/condos per square mile
Median price asked for vacant for-sale houses and condos in 2022: $994,024.
Median contract rent in 2022: $1,540 (lower quartile is $1,351, upper quartile is $1,921)
Median rent asked for vacant for-rent units in 2022: $2,015
Median gross rent in Woodstock, GA in 2022: $1,669
Housing units in Woodstock with a mortgage: 7,976 (335 second mortgage, 65 home equity loan, 242 both second mortgage and home equity loan )Houses without a mortgage: 230
Median household income for houses/condos with a mortgage: $122,476
Median household income for apartments without a mortgage: $95,315
Median monthly housing costs: $1,682
Data:
Median house or condo value ($)
Median house or condo value ($ change since 2000)
Median house or condo value ($) - White
Median house or condo value ($) - Black or African American
Median house or condo value ($) - Asian
Median house or condo value ($) - Hispanic or Latino
Median house or condo value ($) - American Indian and Alaska Native
Median house or condo value ($) - Multirace
Median house or condo value ($) - Other Race
Median price asked for mobile homes ($)
Household density (households per square mile)
Mean house or condo value by units in structure - 1, detached ($)
Mean house or condo value by units in structure - 1, attached ($)
Mean house or condo value by units in structure - 2 ($)
Mean house or condo value by units in structure by units in structure - 3 or 4 ($)
Mean house or condo value by units in structure - 5 or more ($)
Mean house or condo value by units in structure - Boat, RV, van, etc. ($)
Mean house or condo value by units in structure - Mobile home ($)
Median contract rent ($)
Median contract rent - Lower quartile ($)
Median contract rent - Upper quartile ($)
Median gross rent ($)
Urban houses (%)
Rural houses (%)
Houses occupied (%)
Houses occupied (% change since 2000)
Houses owner occupied (%)
Houses owner occupied (% change since 2000)
Houses renter occupied (%)
Houses renter occupied (% change since 2000)
Vacant housing units - For rent (%)
Vacant housing units - For rent (% change since 2000)
Vacant housing units - For sale only (%)
Vacant housing units - For sale only (% change since 2000)
Vacant housing units - Rented or sold, not occupied (%)
Vacant housing units - Rented or sold, not occupied (% change since 2000)
Vacant housing units - For seasonal, recreational, or occasional use (%)
Vacant housing units - For seasonal, recreational, or occasional use (% change since 2000)
Vacant housing units - For migrant workers (%)
Vacant housing units - For migrant workers (% change since 2000)
Vacant housing units - Other vacant (%)
Vacant housing units - Other vacant (% change since 2000)
Median monthly housing costs ($)
Median household income for houses/condos with a mortgage ($)
Median household income for houses/condos without a mortgage ($)
Median household income ($)
Median household income ($) - White
Median household income ($) - Black or African American
Median household income ($) - Asian
Median household income ($) - Hispanic or Latino
Median household income ($) - American Indian and Alaska Native
Median household income ($) - Multirace
Median household income ($) - Other Race
Mortgage status - with mortgage (%)
Mortgage status - with second mortgage (%)
Mortgage status - with home equity loan (%)
Mortgage status - with both second mortgage and home equity loan (%)
Mortgage status - without a mortgage (%)
Median year house/condo built
Median year apartment built
Household type by relationship - Male householder living alone (%)
Household type by relationship - Male householder not living alone (%)
Household type by relationship - Female householder living alone (%)
Household type by relationship - Female householder not living alone (%)
Household type by relationship - Opposite-Sex spouse (%)
Household type by relationship - Same-Sex spouse (%)
Household type by relationship - Opposite-Sex unmarried partner (%)
Household type by relationship - Same-Sex unmarried partner (%)
Household type by relationship - In group quarters (%)
Size of family households - 2-person household (%)
Size of family households - 3-person household (%)
Size of family households - 4-person household (%)
Size of family households - 5-person household (%)
Size of family households - 6-person household (%)
Size of family households - 7-or-more-person household (%)
Size of nonfamily households - 1-person household (%)
Size of nonfamily households - 2-person household (%)
Size of nonfamily households - 3-person household (%)
Size of nonfamily households - 4-person household (%)
Size of nonfamily households - 5-person household (%)
Size of nonfamily households - 6-person household (%)
Size of nonfamily households - 7-or-moreperson household (%)
Year house built - Built 2010 or later (%)
Year house built - Built 2000 to 2009 (%)
Year house built - Built 1990 to 1999 (%)
Year house built - Built 1980 to 1989 (%)
Year house built - Built 1970 to 1979 (%)
Year house built - Built 1960 to 1969 (%)
Year house built - Built 1950 to 1959 (%)
Year house built - Built 1940 to 1949 (%)
Year house built - Built 1939 or earlier (%)
Median number of rooms in houses and condos
Median number of rooms in apartments
Median number of bedrooms in owner occupied houses
Mean number of bedrooms in owner occupied houses
Median number of bedrooms in renter occupied houses
Mean number of bedrooms in renter occupied houses
Median number of vehichles in owner occupied houses
Mean number of vehichles in owner occupied houses
Median number of vehichles in renter occupied houses
Mean number of vehichles in renter occupied houses
Rooms in owner-occupied houses - 1 room (%)
Rooms in owner-occupied houses - 2 rooms (%)
Rooms in owner-occupied houses - 3 rooms (%)
Rooms in owner-occupied houses - 4 rooms (%)
Rooms in owner-occupied houses - 5 rooms (%)
Rooms in owner-occupied houses - 6 rooms (%)
Rooms in owner-occupied houses - 7 rooms (%)
Rooms in owner-occupied houses - 8 rooms (%)
Rooms in owner-occupied houses - 9+ rooms (%)
Rooms in renter-occupied houses - 1 room (%)
Rooms in renter-occupied houses - 2 rooms (%)
Rooms in renter-occupied houses - 3 rooms (%)
Rooms in renter-occupied houses - 4 rooms (%)
Rooms in renter-occupied houses - 5 rooms (%)
Rooms in renter-occupied houses - 6 rooms (%)
Rooms in renter-occupied houses - 7 rooms (%)
Rooms in renter-occupied houses - 8 rooms (%)
Rooms in renter-occupied houses - 9+ rooms (%)
Bedrooms in owner-occupied houses - no bedrooms (%)
Bedrooms in owner-occupied houses - 1 bedroom (%)
Bedrooms in owner-occupied houses - 2 bedrooms (%)
Bedrooms in owner-occupied houses - 3 bedrooms (%)
Bedrooms in owner-occupied houses - 4 bedrooms (%)
Bedrooms in owner-occupied houses - 5+ bedrooms (%)
Bedrooms in renter-occupied houses - no bedrooms (%)
Bedrooms in renter-occupied houses - 1 bedroom (%)
Bedrooms in renter-occupied houses - 2 bedrooms (%)
Bedrooms in renter-occupied houses - 3 bedrooms (%)
Bedrooms in renter-occupied houses - 4 bedrooms (%)
Bedrooms in renter-occupied houses - 5+ bedrooms (%)
Vehicles available in owner-occupied houses - no vehicle available (%)
Vehicles available in owner-occupied houses - 1 vehicle available(%)
Vehicles available in owner-occupied houses - 2 Vehicles available (%)
Vehicles available in owner-occupied houses - 3 Vehicles available (%)
Vehicles available in owner-occupied houses - 4 Vehicles available (%)
Vehicles available in owner-occupied houses - 5+ Vehicles available (%)
Vehicles available in renter-occupied houses - no vehicle available (%)
Vehicles available in renter-occupied houses - 1 vehicle available (%)
Vehicles available in renter-occupied houses - 2 Vehicles available (%)
Vehicles available in renter-occupied houses - 3 Vehicles available (%)
Vehicles available in renter-occupied houses - 4 Vehicles available (%)
Vehicles available in renter-occupied houses - 5+ Vehicles available (%)
Housing units in structures - 1, detached (%)
Housing units in structures - 1, attached (%)
Housing units in structures - 2 (%)
Housing units in structures - 3 or 4 (%)
Housing units in structures - 5 to 9 (%)
Housing units in structures - 10 to 19 (%)
Housing units in structures - 20 to 49 (%)
Housing units in structures - 50 or more (%)
Housing units in structures - Mobile home (%)
Housing units in structures - Boat, RV, van, etc. (%)
Housing units in structures - Owners - 1, detached (%)
Housing units in structures - Owners - 1, attached (%)
Housing units in structures - Owners - 2 (%)
Housing units in structures - Owners - 3 or 4 (%)
Housing units in structures - Owners - 5 to 9 (%)
Housing units in structures - Owners - 10 to 19 (%)
Housing units in structures - Owners - 20 to 49 (%)
Housing units in structures - Owners - 50 or more (%)
Housing units in structures - Owners - Mobile home (%)
Housing units in structures - Owners - Boat, RV, van, etc. (%)
Housing units in structures - Renters - 1, detached (%)
Housing units in structures - Renters - 1, attached (%)
Housing units in structures - Renters - 2 (%)
Housing units in structures - Renters - 3 or 4 (%)
Housing units in structures - Renters - 5 to 9 (%)
Housing units in structures - Renters - 10 to 19 (%)
Housing units in structures - Renters - 20 to 49 (%)
Housing units in structures - Renters - 50 or more (%)
Housing units in structures - Renters - Mobile home (%)
Housing units in structures - Renters - Boat, RV, van, etc. (%)
House/condo owner moved in on average (years ago)
Renter moved in on average (years ago)
Year householder moved into unit - Moved in 1999 to March 2000 (%)
Year householder moved into unit - Moved in 1999 to March 2000 (%) - White
Year householder moved into unit - Moved in 1999 to March 2000 (%) - Black or African American
Year householder moved into unit - Moved in 1999 to March 2000 (%) - Asian
Year householder moved into unit - Moved in 1999 to March 2000 (%) - Hispanic or Latino
Year householder moved into unit - Moved in 1999 to March 2000 (%) - American Indian and Alaska Native
Year householder moved into unit - Moved in 1999 to March 2000 (%) - Multirace
Year householder moved into unit - Moved in 1999 to March 2000 (%) - Other Race
Year householder moved into unit - Moved in 1995 to 1998 (%)
Year householder moved into unit - Moved in 1995 to 1998 (%) - White
Year householder moved into unit - Moved in 1995 to 1998 (%) - Black or African American
Year householder moved into unit - Moved in 1995 to 1998 (%) - Asian
Year householder moved into unit - Moved in 1995 to 1998 (%) - Hispanic or Latino
Year householder moved into unit - Moved in 1995 to 1998 (%) - American Indian and Alaska Native
Year householder moved into unit - Moved in 1995 to 1998 (%) - Multirace
Year householder moved into unit - Moved in 1995 to 1998 (%) - Other Race
Year householder moved into unit - Moved in 1990 to 1994 (%)
Year householder moved into unit - Moved in 1990 to 1994 (%) - White
Year householder moved into unit - Moved in 1990 to 1994 (%) - Black or African American
Year householder moved into unit - Moved in 1990 to 1994 (%) - Asian
Year householder moved into unit - Moved in 1990 to 1994 (%) - Hispanic or Latino
Year householder moved into unit - Moved in 1990 to 1994 (%) - American Indian and Alaska Native
Year householder moved into unit - Moved in 1990 to 1994 (%) - Multirace
Year householder moved into unit - Moved in 1990 to 1994 (%) - Other Race
Year householder moved into unit - Moved in 1980 to 1989 (%)
Year householder moved into unit - Moved in 1980 to 1989 (%) - White
Year householder moved into unit - Moved in 1980 to 1989 (%) - Black or African American
Year householder moved into unit - Moved in 1980 to 1989 (%) - Asian
Year householder moved into unit - Moved in 1980 to 1989 (%) - Hispanic or Latino
Year householder moved into unit - Moved in 1980 to 1989 (%) - American Indian and Alaska Native
Year householder moved into unit - Moved in 1980 to 1989 (%) - Multirace
Year householder moved into unit - Moved in 1980 to 1989 (%) - Other Race
Year householder moved into unit - Moved in 1970 to 1979 (%)
Year householder moved into unit - Moved in 1970 to 1979 (%) - White
Year householder moved into unit - Moved in 1970 to 1979 (%) - Black or African American
Year householder moved into unit - Moved in 1970 to 1979 (%) - Asian
Year householder moved into unit - Moved in 1970 to 1979 (%) - Hispanic or Latino
Year householder moved into unit - Moved in 1970 to 1979 (%) - American Indian and Alaska Native
Year householder moved into unit - Moved in 1970 to 1979 (%) - Multirace
Year householder moved into unit - Moved in 1970 to 1979 (%) - Other Race
Year householder moved into unit - Moved in 1969 or earlier (%)
Year householder moved into unit - Moved in 1969 or earlier (%) - White
Year householder moved into unit - Moved in 1969 or earlier (%) - Black or African American
Year householder moved into unit - Moved in 1969 or earlier (%) - Asian
Year householder moved into unit - Moved in 1969 or earlier (%) - Hispanic or Latino
Year householder moved into unit - Moved in 1969 or earlier (%) - American Indian and Alaska Native
Year householder moved into unit - Moved in 1969 or earlier (%) - Multirace
Year householder moved into unit - Moved in 1969 or earlier (%) - Other Race
Housing units lacking complete plumbing facilities (%)
Housing units lacking complete kitchen facilities (%)
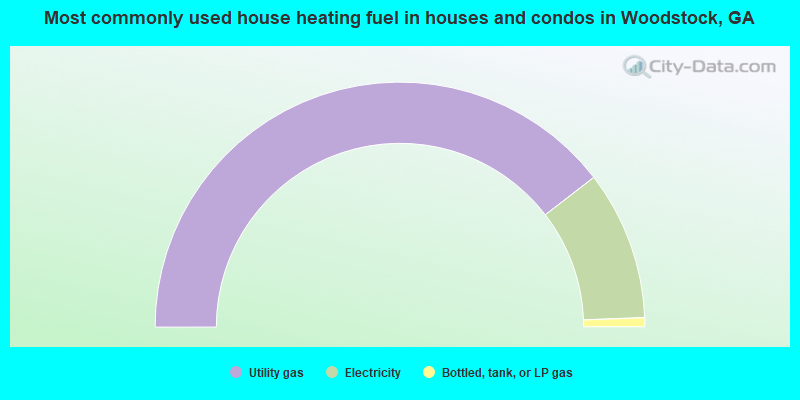
House heating fuel used in houses and condos - Utility gas (%)
House heating fuel used in houses and condos - Bottled, tank, or LP gas (%)
House heating fuel used in houses and condos - Electricity (%)
House heating fuel used in houses and condos - Fuel oil, kerosene, etc. (%)
House heating fuel used in houses and condos - Coal or coke (%)
House heating fuel used in houses and condos - Wood (%)
House heating fuel used in houses and condos - Solar energy (%)
House heating fuel used in houses and condos - Other fuel (%)
House heating fuel used in houses and condos - No fuel used (%)
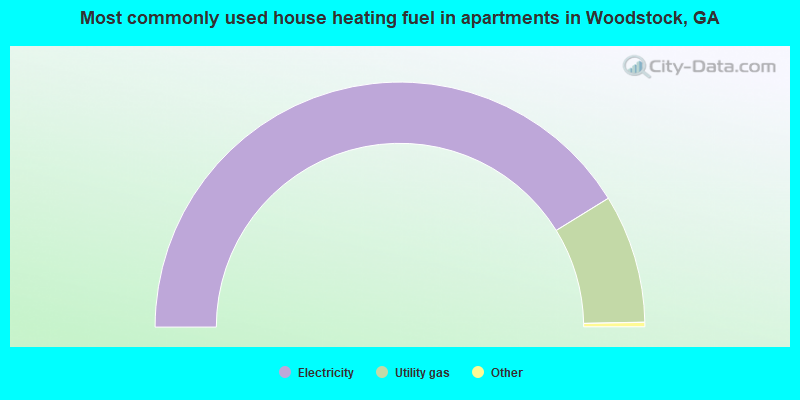
House heating fuel used in apartments - Utility gas (%)
House heating fuel used in apartments - Bottled, tank, or LP gas (%)
House heating fuel used in apartments - Electricity (%)
House heating fuel used in apartments - Fuel oil, kerosene, etc. (%)
House heating fuel used in apartments - Coal or coke (%)
House heating fuel used in apartments - Wood (%)
House heating fuel used in apartments - Solar energy (%)
House heating fuel used in apartments - Other fuel (%)
House heating fuel used in apartments - No fuel used (%)
Latest news about housing in Woodstock, GA collected exclusively by city-data.com from local newspapers, TV, and radio stations
Median year house/condo built: 2007Median year apartment built: 2010Household type by relationship:
Households: 36,835
Male householders: 7,004 (1,326 living alone ), Female householders: 7,281 (2,777 living alone )7,467 spouses (7,397 opposite-sex spouses ), 673 unmarried partners , (666 opposite-sex unmarried partners ), 11,461 children (10,633 natural , 590 adopted , 237 stepchildren ), 394 grandchildren , 271 brothers or sisters , 352 parents , 37 foster children , 600 other relatives , 1,041 non-relatives In group quarters: 249
Size of family households: 3,644 2-persons , 2,700 3-persons , 1,813 4-persons , 681 5-persons , 513 6-persons , 57 7-or-more-persons .
Size of nonfamily households: 4,731 1-person , 504 2-persons , 30 3-persons , 33 4-persons , 45 5-persons .
6,662 married couples with children. single-parent households (637 men , 902 women ).
85.3% of residents of Woodstock speak English at home. of residents speak Spanish at home (59% speak English very well , 24% speak English well , 16% speak English not well , 1% don't speak English at all ).of residents speak other Indo-European language at home (78% speak English very well , 10% speak English well , 11% speak English not well , 1% don't speak English at all ).of residents speak Asian or Pacific Island language at home (45% speak English very well , 30% speak English well , 25% speak English not well ).of residents speak other language at home (89% speak English very well , 11% speak English well ).
Foreign born population: 3,625 (9.8%)of them are naturalized citizens )
Median number of rooms in houses and condos:
Median number of rooms in apartments
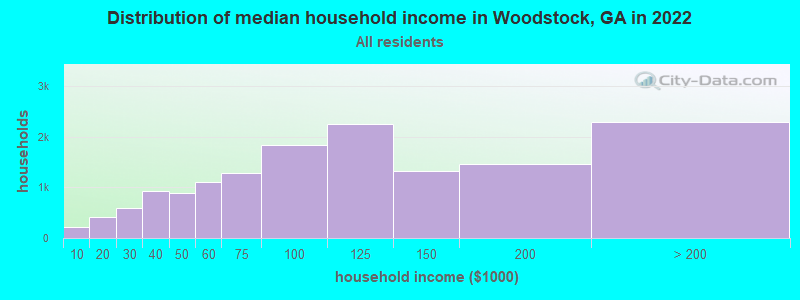
Woodstock, GA household income distribution 222 Less than $10,000407 $10,000 to $19,999600 $20,000 to $29,999919 $30,000 to $39,999887 $40,000 to $49,9991,100 $50,000 to $59,9991,286 $60,000 to $74,9991,831 $75,000 to $99,9992,253 $100,000 to $124,9991,316 $125,000 to $149,9991,470 $150,000 to $199,9992,291 $200,000 or more
Home value of owner - occupied houses in 2022 in Woodstock, GA 67 Less than $10,00012 $15,000 to $19,9994 $20,000 to $24,99962 $25,000 to $29,99969 $30,000 to $34,99919 $35,000 to $39,99918 $50,000 to $59,99950 $150,000 to $174,999151 $175,000 to $199,999575 $200,000 to $249,999825 $250,000 to $299,9993,008 $300,000 to $399,9992,129 $400,000 to $499,9992,162 $500,000 to $749,999601 $750,000 to $999,99998 $1,000,000 to $1,499,999Rent paid by renters in 2022 in Woodstock, GA 37 $200 to $24924 $400 to $44915 $500 to $54930 $600 to $649113 $800 to $899189 $900 to $999549 $1,000 to $1,2491,290 $1,250 to $1,4992,316 $1,500 to $1,999444 $2,000 to $2,49969 $2,500 to $2,99959 $3,000 to $3,49923 $3,500 or more148 No cash rent
Percentage of workers working in this county: 49.0%Number of people working at home: 5,465 (25.3% of all workers )
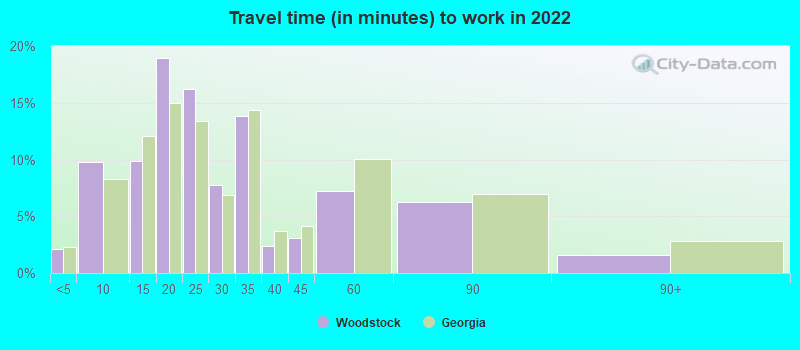
Travel time to work (commute)
Less than 5 minutes: 6705 to 9 minutes: 1,33310 to 14 minutes: 1,15815 to 19 minutes: 2,34420 to 24 minutes: 1,57025 to 29 minutes: 1,31930 to 34 minutes: 2,21435 to 39 minutes: 1,29340 to 44 minutes: 88745 to 59 minutes: 1,82360 to 89 minutes: 1,28390 or more minutes: 434
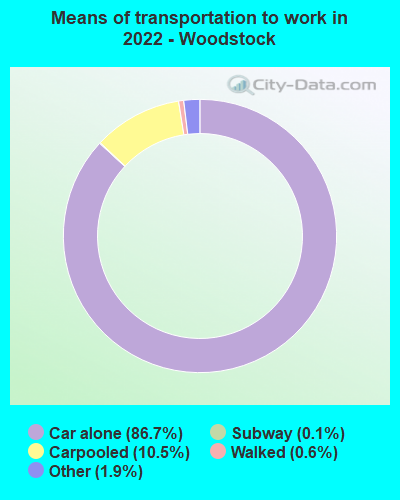
Means of transportation to work:
Drove a car alone: 15,273 (67.2%)Carpooled: 1,941 (8.5%)Long-distance train or commuter rail : 10 (0.0%)Taxi: 363 (1.6%)Bicycle: 8 (0.0%)Walked: 119 (0.5%)Worked at home: 5,640 (24.8%)
Unemployment by race in 2022
Unemployment rate for White non-Hispanic residents 3.8% Males1.3% FemalesUnemployment rate for Black residents 13.5% FemalesUnemployment rate for two or more race residents 1.1% FemalesUnemployment rate for Hispanic or Latino residents 4.0% Females
Year of entry for the foreign-born population in Woodstock, Georgia
1,299 2010 or later 719 2000 to 2009 1,111 1990 to 1999 177 1980 to 1989 50 1970 to 1979 70 Before 1970
First ancestries reported:
English: 1,715 (10.5%)
American: 1,640 (10.0%)
German: 1,481 (9.0%)
Irish: 1,460 (8.9%)
European: 638 (3.9%)
Polish: 459 (2.8%)
Italian: 409 (2.5%)
Yugoslavian: 374 (2.3%)
Scottish: 312 (1.9%)
Brazilian: 234 (1.4%)
Nigerian: 232 (1.4%)
British: 229 (1.4%)
Haitian: 196 (1.2%)
Scotch-Irish: 155 (0.9%)
French: 110 (0.7%)
Iranian: 101 (0.6%)
Palestinian: 100 (0.6%)
Romanian: 77 (0.5%)
Russian: 67 (0.4%)
Norwegian: 65 (0.4%)
Jamaican: 63 (0.4%)
Dutch: 61 (0.4%)
Greek: 53 (0.3%)
African: 46 (0.3%)
French Canadian: 44 (0.3%)
Canadian: 43 (0.3%)
Austrian: 42 (0.3%)
Eastern European: 42 (0.3%)
Finnish: 42 (0.3%)
Welsh: 41 (0.3%)
Turkish: 37 (0.2%)
West Indian: 35 (0.2%)
Danish: 33 (0.2%)
Swedish: 26 (0.2%)
Lebanese: 23 (0.1%)
Cypriot: 20 (0.1%)
Lithuanian: 18 (0.1%)
Portuguese: 15 (0.09%)
Ukrainian: 12 (0.07%)
Israeli: 9 (0.05%)
Czech: 5 (0.03%)
Croatian: 3 (0.02%) Most common places of birth for foreign-born residents (%): Venezuela Woodstock:
14.4% (566)Georgia:
1.7% (19,012)
Brazil Woodstock:
10.1% (398)Georgia:
1.6% (18,211)
Nigeria Woodstock:
8.1% (319)Georgia:
2.5% (27,846)
Mexico Woodstock:
6.8% (267)Georgia:
20.0% (223,400)
Bosnia and Herzegovina Woodstock:
6.8% (267)Georgia:
0.4% (4,775)
India Woodstock:
6.0% (236)Georgia:
9.2% (103,325)
Colombia Woodstock:
4.1% (160)Georgia:
2.1% (23,813)
Algeria Woodstock:
3.5% (136)Georgia:
0.0% (455)
Canada Woodstock:
3.0% (117)Georgia:
1.6% (17,851)
Cambodia Woodstock:
2.8% (109)Georgia:
0.3% (2,808)
China, excluding Hong Kong and Taiwan Woodstock:
2.6% (103)Georgia:
3.5% (39,227)
United Kingdom, excluding England and Scotland Woodstock:
2.5% (97)Georgia:
0.8% (9,101)
Guatemala Woodstock:
2.3% (90)Georgia:
3.6% (39,974)
Peru Woodstock:
2.3% (89)Georgia:
0.8% (8,613)
Ecuador Woodstock:
2.2% (88)Georgia:
0.4% (4,046)
Pakistan Woodstock:
2.2% (85)Georgia:
1.1% (12,223)
Philippines Woodstock:
2.0% (80)Georgia:
1.8% (20,700)
Poland Woodstock:
1.7% (67)Georgia:
0.3% (3,179)
Korea Woodstock:
1.7% (66)Georgia:
3.9% (43,756)
Costa Rica Woodstock:
1.6% (64)Georgia:
0.3% (3,088)
Jamaica Woodstock:
1.5% (59)Georgia:
4.6% (51,270)
Place of birth for U.S.-born residents:
This state: 15,178Other state: 17,619Northeast: 3,954Midwest: 4,533South: 6,931West: 2,050 86.7% of Woodstock residents lived in the same house 1 years ago.
Out of people who lived in different houses, 25.6% lived in this county.
Out of people who lived in different counties, 65.6% lived in Georgia.
Woodstock:
86.7%State average:
86.6%
Education attainment for males 25 years and older:
No schooling: 10Nursery to 4th grade: 05th and 6th grade: 77th and 8th grade: 449th grade: 2910th grade: 5911th grade: 1012th grade, no diploma: 5High school graduate (or equivalency): 1,587Less than 1 year of college: 740Some college more than 1 year, no degree: 1,713Associate degree: 1,112Bachelor's degree: 4,224Master's degree: 1,230Professional school degree: 181Doctorate degree: 381
Education attainment for females 25 years and older:
No schooling: 81Nursery to 4th grade: 265th and 6th grade: 07th and 8th grade: 639th grade: 3610th grade: 6211th grade: 17412th grade, no diploma: 175High school graduate (or equivalency): 2,351Less than 1 year of college: 844Some college more than 1 year, no degree: 1,757Associate degree: 652Bachelor's degree: 5,385Master's degree: 1,819Professional school degree: 272Doctorate degree: 205
Housing units in structures:
One, detached: 9,040One, attached: 1,969Two: 363 or 4: 855 to 9: 49310 to 19: 1,24920 to 49: 1,22350 or more: 863Housing units lacking complete kitchen facilities in 2022: 0.6%House/condo owner moved in on average 7 years ago
Renter moved in on average 3 years ago
Private vs. public school enrollment:
Students in private schools in grades 1 to 8 (elementary and middle school): 971 Students in private schools in grades 9 to 12 (high school): 174 Students in private undergraduate colleges: 274