Housing density: 2,146 houses/condos per square mile
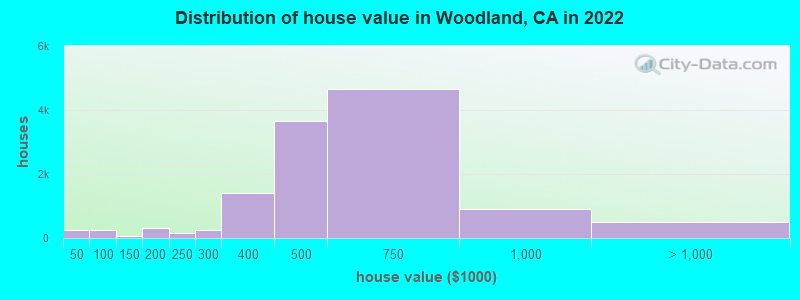
Median price asked for vacant for-sale houses and condos in 2022: $1,718,930.
Median contract rent in 2022: $1,385 (lower quartile is $1,032, upper quartile is $1,755)
Median rent asked for vacant for-rent units in 2022: $1,637
Median gross rent in Woodland, CA in 2022: $1,505
Housing units in Woodland with a mortgage: 8,680 (775 second mortgage, 0 home equity loan, 586 both second mortgage and home equity loan) Houses without a mortgage: 113
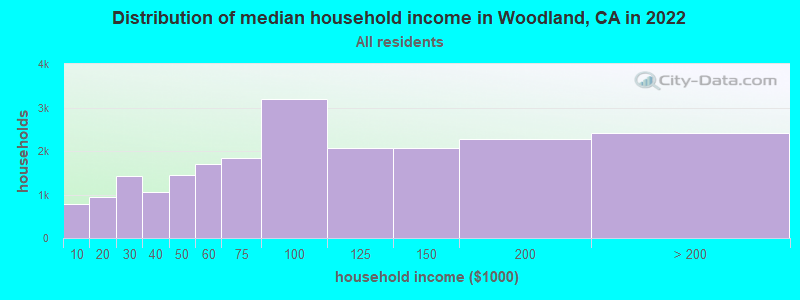
Median household income for houses/condos with a mortgage: $132,393
Median household income for apartments without a mortgage: $61,963
8,557 married couples with children.
3,777 single-parent households (801 men, 2,976 women).
59.5% of residents of Woodland speak English at home.
34.6% of residents speak Spanish at home (58% speak English very well, 20% speak English well, 10% speak English not well, 12% don't speak English at all).
3.8% of residents speak other Indo-European language at home (63% speak English very well, 22% speak English well, 14% speak English not well, 1% don't speak English at all).
3.2% of residents speak Asian or Pacific Island language at home (45% speak English very well, 40% speak English well, 9% speak English not well, 7% don't speak English at all).
0.3% of residents speak other language at home (84% speak English very well, 3% speak English well, 8% speak English not well, 5% don't speak English at all).
Foreign born population: 13,409 (21.4%)
(58.9% of them are naturalized citizens)
Percentage of workers working in this county: 74.7% Number of people working at home: 3,374 (10.7% of all workers)
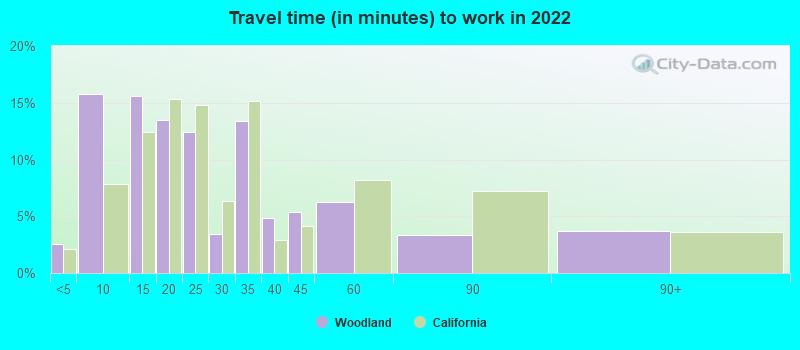
Travel time to work (commute)
Less than 5 minutes: 811
5 to 9 minutes: 4,217
10 to 14 minutes: 4,430
15 to 19 minutes: 4,618
20 to 24 minutes: 3,147
25 to 29 minutes: 1,399
30 to 34 minutes: 3,939
35 to 39 minutes: 927
40 to 44 minutes: 772
45 to 59 minutes: 1,442
60 to 89 minutes: 1,254
90 or more minutes: 981
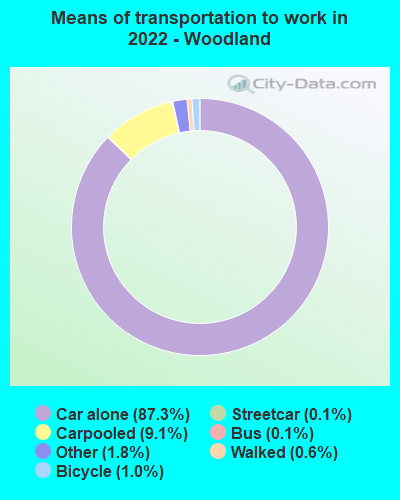
Means of transportation to work:
Drove a car alone: 20,553 (75.4%)
Carpooled: 2,831 (10.4%)
Bus: 18 (0.1%)
Subway or elevated rail: 13 (0.0%)
Long-distance train or commuter rail: 5 (0.0%)
Taxi: 476 (1.7%)
Bicycle: 199 (0.7%)
Walked: 140 (0.5%)
Worked at home: 3,374 (12.4%)
Unemployment by race in 2022
Unemployment rate for White non-Hispanic residents
4.0%Males
2.9%Females
Unemployment rate for Black residents
4.9%Males
16.5%Females
Unemployment rate for American Indian and Alaska Native residents
9.7%Males
3.3%Females
Unemployment rate for Asian residents
2.2%Males
1.4%Females
Unemployment rate for other race residents
3.4%Males
7.4%Females
Unemployment rate for two or more race residents
12.2%Males
15.1%Females
Unemployment rate for Hispanic or Latino residents
6.4%Males
11.8%Females
Year of entry for the foreign-born population in Woodland, California
2,3792010 or later
3,6992000 to 2009
3,0611990 to 1999
2,4921980 to 1989
1,5251970 to 1979
1,259Before 1970
First ancestries reported:
English: 1,611 (4.6%)
German: 1,244 (3.5%)
Irish: 1,145 (3.2%)
European: 1,037 (2.9%)
American: 604 (1.7%)
Italian: 539 (1.5%)
Portuguese: 357 (1.0%)
Scottish: 277 (0.8%)
Swedish: 253 (0.7%)
Norwegian: 165 (0.5%)
Scotch-Irish: 159 (0.4%)
Russian: 112 (0.3%)
Ukrainian: 90 (0.3%)
Dutch: 89 (0.3%)
French: 86 (0.2%)
Nigerian: 84 (0.2%)
French Canadian: 81 (0.2%)
Iranian: 67 (0.2%)
Polish: 56 (0.2%)
Eastern European: 55 (0.2%)
Greek: 55 (0.2%)
Maltese: 44 (0.1%)
Hungarian: 41 (0.1%)
Jamaican: 40 (0.1%)
British: 40 (0.1%)
Danish: 40 (0.1%)
Finnish: 32 (0.09%)
Swiss: 32 (0.09%)
Iraqi: 28 (0.08%)
African: 25 (0.07%)
Armenian: 23 (0.06%)
Canadian: 23 (0.06%)
Northern European: 20 (0.06%)
Slovene: 18 (0.05%)
Scandinavian: 17 (0.05%)
Austrian: 11 (0.03%)
Israeli: 10 (0.03%)
Serbian: 10 (0.03%)
Bulgarian: 10 (0.03%)
Lithuanian: 10 (0.03%)
Brazilian: 9 (0.03%)
Most common places of birth for foreign-born residents (%):
Mexico
Woodland:
68.0% (9,413)
California:
37.2% (3,881,193)
Pakistan
Woodland:
3.8% (530)
California:
0.5% (49,399)
India
Woodland:
3.5% (480)
California:
5.2% (539,184)
China, excluding Hong Kong and Taiwan
Woodland:
3.4% (469)
California:
6.6% (684,672)
Nepal
Woodland:
3.0% (411)
California:
0.2% (16,541)
Korea
Woodland:
1.9% (266)
California:
3.0% (315,248)
Peru
Woodland:
1.8% (246)
California:
0.7% (74,025)
Philippines
Woodland:
1.6% (215)
California:
7.8% (818,297)
Place of birth for U.S.-born residents:
This state: 40,776
Other state: 7,881
Northeast: 1,247
Midwest: 2,036
South: 1,790
West: 2,885
88.3% of Woodland residents lived in the same house 1 years ago. Out of people who lived in different houses, 38.2% lived in this county. Out of people who lived in different counties, 77.6% lived in California.
Woodland:
88.3%
State average:
88.9%
Education attainment for males 25 years and older:
No schooling: 575
Nursery to 4th grade: 352
5th and 6th grade: 1,035
7th and 8th grade: 323
9th grade: 1,108
10th grade: 58
11th grade: 262
12th grade, no diploma: 611
High school graduate (or equivalency): 5,522
Less than 1 year of college: 1,005
Some college more than 1 year, no degree: 3,639
Associate degree: 1,165
Bachelor's degree: 3,562
Master's degree: 1,207
Professional school degree: 416
Doctorate degree: 366
Education attainment for females 25 years and older:
No schooling: 723
Nursery to 4th grade: 266
5th and 6th grade: 610
7th and 8th grade: 257
9th grade: 296
10th grade: 200
11th grade: 85
12th grade, no diploma: 524
High school graduate (or equivalency): 5,563
Less than 1 year of college: 1,640
Some college more than 1 year, no degree: 2,678
Associate degree: 2,051
Bachelor's degree: 3,480
Master's degree: 1,334
Professional school degree: 589
Doctorate degree: 438
Housing units in structures:
One, detached: 14,362
One, attached: 1,474
Two: 494
3 or 4: 1,389
5 to 9: 1,270
10 to 19: 718
20 to 49: 584
50 or more: 1,246
Mobile homes: 596
Median worth of mobile homes: $85,018
Housing units lacking complete plumbing facilities in 2022: 0.4%
Housing units lacking complete kitchen facilities in 2022: 2.0%
House/condo owner moved in on average 10 years ago