Wilmington, MA (Massachusetts) Houses and Residents
| Wilmington: | $648,780 |
| Massachusetts: | $534,700 |
Mean price in 2022:
Detached houses: $679,552
Here: $679,552 State: $651,570 Townhouses or other attached units: $469,165
Here: $469,165 State: $617,749 In 2-unit structures: $787,261
Here: $787,261 State: $594,808 In 5-or-more-unit structures: $490,700
Here: $490,700 State: $555,768
Total population: 22,325 (Urban population: 21,363, Rural population: 0)
Houses: 8,254 (8,038 occupied: 6,891 owner occupied, 1,140 renter occupied)
| % of renters here: | 14% |
| State: | 38% |
Housing density: 482 houses/condos per square mile
Median price asked for vacant for-sale houses and condos in 2022 in this county: $1,068,910.
Median contract rent in 2022: over $2,000
Median rent asked for vacant for-rent units in 2022: $3,216
Median gross rent in Wilmington, MA in 2022: over $2,000
Housing units in Wilmington with a mortgage: 4,728 (1,163 second mortgage, 14 home equity loan, 1,053 both second mortgage and home equity loan)
Houses without a mortgage: 89
Median household income for houses/condos with a mortgage: $161,928
Median household income for apartments without a mortgage: $164,905
Median monthly housing costs: $2,373
Compare current foreclosures near Wilmington, MA:
| Photo | Address | Area | Beds / Baths | Price | Details |
|---|---|---|---|---|---|

|
#1
Wabash Rd
Wilmington, MA 01887
|
1,190 sq. feet
|
1 baths 3 beds |
show details | |

|
#2
West St
Wilmington, MA 01887
|
1,448 sq. feet
|
2 baths 3 beds |
show details | |

|
#3
Amherst Rd
Wilmington, MA 01887
|
2,264 sq. feet
|
2 baths 4 beds |
show details | |

|
#4
Sudbury Ave
Wilmington, MA 01887
|
2,379 sq. feet
|
2 baths 5 beds |
show details | |

|
#5
Foley Farm Rd
Wilmington, MA 01887
|
2,516 sq. feet
|
3 baths 4 beds |
show details | |

|
#6
Hanson Rd
Wilmington, MA 01887
|
1,044 sq. feet
|
1 baths 3 beds |
show details | |

|
#7
Broad St
Wilmington, MA 01887
|
1,138 sq. feet
|
1 baths 3 beds |
show details | |

|
#8
Lords Ct
Wilmington, MA 01887
|
1,279 sq. feet
|
2 baths 3 beds |
show details | |

|
#9
Flynn Way
Wilmington, MA 01887
|
1,706 sq. feet
|
3 baths 3 beds |
show details | |

|
#10
Chandler Rd
Wilmington, MA 01887
|
1,512 sq. feet
|
2 baths 3 beds |
show details |
| Photo | Address | Area | Beds / Baths | Price | Details |
|---|---|---|---|---|---|

|
#11
Lowell St
Wilmington, MA 01887
|
1,024 sq. feet
|
1 baths 3 beds |
show details | |

|
#12
Blackstone St
Wilmington, MA 01887
|
- sq. feet
|
- baths - beds |
show details | |

|
#13
Burlington Ave Apt 2109
Wilmington, MA 01887
|
- sq. feet
|
- baths - beds |
show details | |

|
#14
Stevens Ave
Middleton, MA 01949
|
1,396 sq. feet
|
2 baths 3 beds |
$535,600
|
show details |

|
#15
Cedar St # A
Haverhill, MA 01830
|
1,134 sq. feet
|
2 baths 2 beds |
$209,300
|
show details |

|
#16
Hicks Ave Apt 12
Medford, MA 02155
|
1,749 sq. feet
|
2 baths 3 beds |
show details | |

|
#17
Kidder Ave
Somerville, MA 02144
|
2,831 sq. feet
|
6 baths 6 beds |
show details | |

|
#18
Birch St
Danvers, MA 01923
|
2,516 sq. feet
|
3 baths 3 beds |
show details | |

|
#19
Thornton St
Lawrence, MA 01841
|
912 sq. feet
|
1 baths 2 beds |
show details | |

|
#20
Campo Seco St
Lawrence, MA 01841
|
2,276 sq. feet
|
3 baths 4 beds |
show details |
| Photo | Address | Area | Beds / Baths | Price | Details |
|---|---|---|---|---|---|

|
#21
Belmont Ave
Lynn, MA 01905
|
868 sq. feet
|
2 baths 3 beds |
show details | |

|
#22
Knox St
Lawrence, MA 01841
|
3,618 sq. feet
|
3 baths 7 beds |
show details | |

|
#23
Great Woods Rd
Lynn, MA 01904
|
943 sq. feet
|
1 baths 2 beds |
show details | |

|
#24
Belmont Ave
Lynn, MA 01905
|
1,025 sq. feet
|
1 baths 2 beds |
show details | |

|
#25
Ponderosa Ave
Methuen, MA 01844
|
1,560 sq. feet
|
1 baths 3 beds |
show details | |

|
#26
Lodgen Ct Apt 3d
Malden, MA 02148
|
1,001 sq. feet
|
2 baths 2 beds |
show details | |

|
#27
Oakland Ave
Methuen, MA 01844
|
1,672 sq. feet
|
3 baths 3 beds |
show details | |

|
#28
Eastern Ave
Malden, MA 02148
|
2,288 sq. feet
|
3 baths 4 beds |
show details | |

|
#29
Fenwick St
Revere, MA 02151
|
2,080 sq. feet
|
1 baths 3 beds |
show details | |

|
#30
Sydney St
Medford, MA 02155
|
1,227 sq. feet
|
1 baths 3 beds |
show details |
| Photo | Address | Area | Beds / Baths | Price | Details |
|---|---|---|---|---|---|

|
#31
Jacqueline Rd Apt F
Waltham, MA 02452
|
780 sq. feet
|
1 baths 2 beds |
show details | |

|
#32
Crawford St
Lowell, MA 01854
|
1,957 sq. feet
|
2 baths 3 beds |
show details | |

|
#33
Mystic Valley Pkwy Apt 101
Medford, MA 02155
|
1,229 sq. feet
|
2 baths 2 beds |
show details | |

|
#34
Columbia Blvd
Peabody, MA 01960
|
1,260 sq. feet
|
1 baths 2 beds |
show details | |

|
#35
7th St
Medford, MA 02155
|
2,508 sq. feet
|
2 baths 5 beds |
show details | |

|
#36
Broadway Apt 2
Lynn, MA 01904
|
710 sq. feet
|
1 baths 2 beds |
show details | |

|
#37
Broadway Apt 406
Everett, MA 02149
|
875 sq. feet
|
1 baths 1 beds |
show details | |

|
#38
Verona St
Lynn, MA 01904
|
1,936 sq. feet
|
3 baths 4 beds |
show details | |

|
#39
Sycamore Rd
Methuen, MA 01844
|
2,122 sq. feet
|
2 baths 5 beds |
show details | |

|
#40
Oakwood Ave
Revere, MA 02151
|
1,380 sq. feet
|
2 baths 3 beds |
show details |
| Photo | Address | Area | Beds / Baths | Price | Details |
|---|---|---|---|---|---|

|
#41
Margin Street
Lynn, MA 01905
|
1,240 sq. feet
|
2 baths 2 beds |
show details | |

|
#42
Chester Rd
Belmont, MA 02478
|
2,633 sq. feet
|
2 baths 6 beds |
show details | |

|
#43
Laurel Hollow Rd
Boxford, MA 01921
|
5,207 sq. feet
|
5 baths 4 beds |
show details | |

|
#44
Wiley Rd
Belmont, MA 02478
|
2,614 sq. feet
|
2 baths 5 beds |
show details | |

|
#45
Pearson Ave
Somerville, MA 02144
|
3,104 sq. feet
|
3 baths 4 beds |
show details | |

|
#46
Spencer St
Methuen, MA 01844
|
1,269 sq. feet
|
2 baths 3 beds |
show details | |

|
#47
Constitution Ln
Danvers, MA 01923
|
1,098 sq. feet
|
3 baths 2 beds |
show details | |

|
#48
Bolton St # A
Cambridge, MA 02140
|
1,047 sq. feet
|
3 baths 2 beds |
show details | |

|
#49
Tobey Rd Unit 23
Dracut, MA 01826
|
1,261 sq. feet
|
2 baths 2 beds |
show details | |

|
Check over 1 million property listings on Foreclosure.com!
|
browse all offers | |||

Latest news about housing in Wilmington, MA collected exclusively by city-data.com from local newspapers, TV, and radio stations


Median year apartment built: 1988
Household type by relationship:
Households: 23,105- Male householders: 3,951 (703 living alone), Female householders: 3,944 (644 living alone)
5,166 spouses (5,157 opposite-sex spouses), 393 unmarried partners, (393 opposite-sex unmarried partners), 7,543 children (7,252 natural, 58 adopted, 233 stepchildren), 613 grandchildren, 30 brothers or sisters, 345 parents, 92 foster children, 327 other relatives, 443 non-relatives
- In group quarters: 251
Size of family households: 2,036 2-persons, 1,600 3-persons, 1,648 4-persons, 473 5-persons, 218 6-persons, 163 7-or-more-persons.
Size of nonfamily households: 1,405 1-person, 393 2-persons, 44 3-persons, 17 5-persons.
4,057 married couples with children.
472 single-parent households (67 men, 405 women).
88.9% of residents of Wilmington speak English at home.
0.9% of residents speak Spanish at home (85% speak English very well, 15% speak English well).
5.2% of residents speak other Indo-European language at home (64% speak English very well, 22% speak English well, 4% speak English not well, 10% don't speak English at all).
3.1% of residents speak Asian or Pacific Island language at home (81% speak English very well, 16% speak English well, 2% speak English not well, 1% don't speak English at all).
0.5% of residents speak other language at home (100% speak English very well).
Foreign born population: 1,834 (7.9%)
(66.0% of them are naturalized citizens)
| Here: | 7.3 |
| State: | 6.5 |
| Here: | 3.6 |
| State: | 4.0 |

- Bedrooms in owner-occupied houses and condos in Wilmington, Massachusetts
- 0no bedroom
- 151 bedroom
- 4852 bedrooms
- 3,9323 bedrooms
- 2,0444 bedrooms
- 4145+ bedrooms

- Bedrooms in renter-occupied apartments in Wilmington, Massachusetts
- 71no bedroom
- 3891 bedroom
- 4132 bedrooms
- 2153 bedrooms
- 344 bedrooms
- 175+ bedrooms

- Cars and other vehicles available in Wilmington in owner-occupied houses/condos
- 153no vehicle
- 1,0251 vehicle
- 3,7382 vehicles
- 1,3353 vehicles
- 5484 vehicles
- 925+ vehicles

- Cars and other vehicles available in Wilmington in renter-occupied apartments
- 255no vehicle
- 5231 vehicle
- 2542 vehicles
- 1073 vehicles
- 04 vehicles
- 05+ vehicles

- Rooms in owner-occupied houses in Wilmington, Massachusetts
- 01 room
- 02 rooms
- 53 rooms
- 1474 rooms
- 6715 rooms
- 1,3686 rooms
- 1,4927 rooms
- 1,3788 rooms
- 1,8309+ rooms

- Rooms in renter-occupied apartments in Wilmington, Massachusetts
- 711 room
- 1572 rooms
- 3253 rooms
- 1474 rooms
- 1815 rooms
- 1206 rooms
- 667 rooms
- 138 rooms
- 609+ rooms


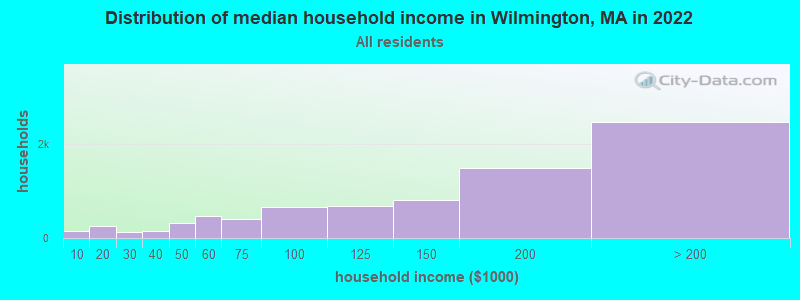
Wilmington, MA household income distribution

- 153Less than $10,000
- 264$10,000 to $19,999
- 120$20,000 to $29,999
- 145$30,000 to $39,999
- 314$40,000 to $49,999
- 471$50,000 to $59,999
- 404$60,000 to $74,999
- 659$75,000 to $99,999
- 680$100,000 to $124,999
- 805$125,000 to $149,999
- 1,500$150,000 to $199,999
- 2,475$200,000 or more
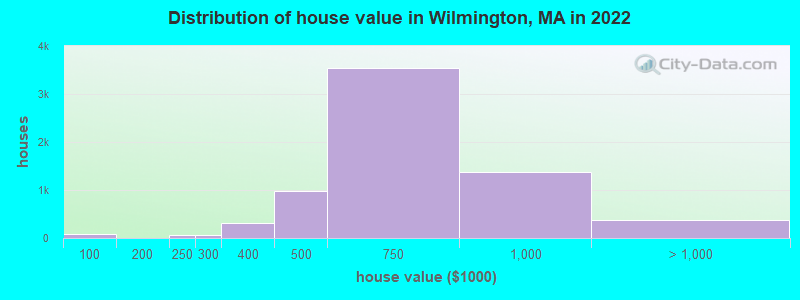
Home value of owner - occupied houses in 2022 in Wilmington, MA
-
- 28Less than $10,000
- 55$50,000 to $59,999
- 35$80,000 to $89,999
- 70$200,000 to $249,999
- 63$250,000 to $299,999
- 321$300,000 to $399,999
- 970$400,000 to $499,999
- 3,536$500,000 to $749,999
- 1,372$750,000 to $999,999
- 322$1,000,000 to $1,499,999
- 43$2,000,000 or more
Rent paid by renters in 2022 in Wilmington, MA
-
- 35Less than $100
- 8$150 to $199
- 87$250 to $299
- 56$450 to $499
- 9$650 to $699
- 16$900 to $999
- 28$1,000 to $1,249
- 10$1,250 to $1,499
- 86$1,500 to $1,999
- 290$2,000 to $2,499
- 275$2,500 to $2,999
- 36$3,000 to $3,499
- 28$3,500 or more
- 119No cash rent


Percentage of workers working in this county: 78.1%
Number of people working at home: 2,205 (17.4% of all workers)
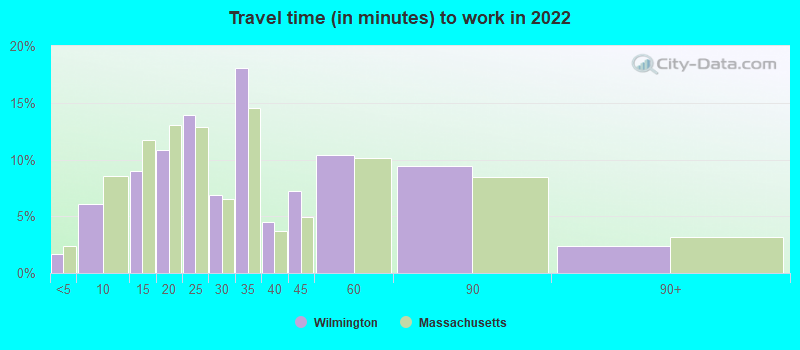
Travel time to work (commute)
- Less than 5 minutes: 130
- 5 to 9 minutes: 799
- 10 to 14 minutes: 975
- 15 to 19 minutes: 1,451
- 20 to 24 minutes: 1,335
- 25 to 29 minutes: 810
- 30 to 34 minutes: 2,102
- 35 to 39 minutes: 325
- 40 to 44 minutes: 323
- 45 to 59 minutes: 1,073
- 60 to 89 minutes: 812
- 90 or more minutes: 173
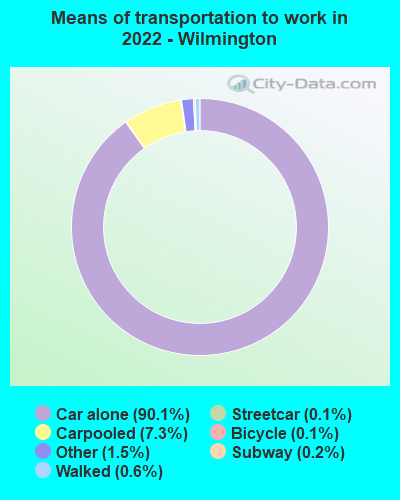
Means of transportation to work:
- Drove a car alone: 15,212 (76.6%)
- Carpooled: 1,285 (6.5%)
- Bus: 3 (0.0%)
- Subway or elevated rail: 24 (0.1%)
- Long-distance train or commuter rail: 26 (0.1%)
- Taxi: 320 (1.6%)
- Bicycle: 31 (0.2%)
- Walked: 112 (0.6%)
- Worked at home: 2,205 (11.1%)

- Unemployment by race in 2022
- Unemployment rate for White non-Hispanic residents
- 2.2%Males
- 3.8%Females
- Unemployment rate for Asian residents
- 3.3%Males
- 4.0%Females
- Unemployment rate for two or more race residents
- 1.0%Males
- 8.2%Females
- Unemployment rate for Hispanic or Latino residents
- 2.6%Males

- Year of entry for the foreign-born population in Wilmington, Massachusetts
- 4572010 or later
- 4502000 to 2009
- 4161990 to 1999
- 1601980 to 1989
- 1971970 to 1979
- 450Before 1970

First ancestries reported:
- Irish: 1,917 (20.7%)
- Italian: 1,351 (14.6%)
- American: 749 (8.1%)
- English: 707 (7.6%)
- Portuguese: 262 (2.8%)
- European: 228 (2.5%)
- Polish: 225 (2.4%)
- German: 213 (2.3%)
- French Canadian: 183 (2.0%)
- Scottish: 180 (1.9%)
- Haitian: 175 (1.9%)
- Russian: 146 (1.6%)
- French: 77 (0.8%)
- Canadian: 67 (0.7%)
- Northern European: 42 (0.5%)
- Ukrainian: 42 (0.5%)
- Greek: 32 (0.3%)
- Eastern European: 31 (0.3%)
- Egyptian: 26 (0.3%)
- Norwegian: 24 (0.3%)
- Armenian: 23 (0.2%)
- Swedish: 23 (0.2%)
- South African: 22 (0.2%)
- Scotch-Irish: 21 (0.2%)
- West Indian: 19 (0.2%)
- Lebanese: 10 (0.1%)
- Brazilian: 8 (0.09%)
- Trinidadian and Tobagonian: 8 (0.09%)
- Iranian: 7 (0.08%)
- Welsh: 7 (0.08%)
Most common places of birth for foreign-born residents (%):
| Wilmington: | 19.1% (351) |
| Massachusetts: | 6.8% (82,934) |
| Wilmington: | 14.7% (269) |
| Massachusetts: | 8.4% (103,233) |
| Wilmington: | 9.4% (172) |
| Massachusetts: | 2.3% (28,158) |
| Wilmington: | 5.8% (106) |
| Massachusetts: | 0.2% (1,990) |
| Wilmington: | 5.5% (101) |
| Massachusetts: | 4.1% (50,360) |
| Wilmington: | 4.4% (80) |
| Massachusetts: | 0.5% (6,073) |
| Wilmington: | 4.3% (78) |
| Massachusetts: | 0.3% (3,351) |
| Wilmington: | 4.3% (78) |
| Massachusetts: | 4.9% (60,432) |
| Wilmington: | 4.3% (78) |
| Massachusetts: | 7.6% (92,959) |
| Wilmington: | 3.4% (63) |
| Massachusetts: | 3.0% (37,197) |
| Wilmington: | 3.3% (60) |
| Massachusetts: | 0.2% (2,737) |
| Wilmington: | 2.5% (46) |
| Massachusetts: | 1.4% (16,886) |
| Wilmington: | 1.9% (34) |
| Massachusetts: | 0.1% (1,720) |
| Wilmington: | 1.8% (33) |
| Massachusetts: | 0.9% (10,808) |
| Wilmington: | 1.7% (31) |
| Massachusetts: | 1.1% (13,065) |
Place of birth for U.S.-born residents:
- This state: 17,961
- Other state: 2,888
- Northeast: 1,619
- Midwest: 279
- South: 551
- West: 457
93.6% of Wilmington residents lived in the same house 1 years ago.
Out of people who lived in different houses, 38.5% lived in this county.
Out of people who lived in different counties, 44.2% lived in Massachusetts.
| Wilmington: | 93.6% |
| State average: | 87.7% |
Education attainment for males 25 years and older:
- No schooling: 88
- Nursery to 4th grade: 0
- 5th and 6th grade: 13
- 7th and 8th grade: 17
- 9th grade: 21
- 10th grade: 31
- 11th grade: 11
- 12th grade, no diploma: 177
- High school graduate (or equivalency): 2,087
- Less than 1 year of college: 578
- Some college more than 1 year, no degree: 817
- Associate degree: 390
- Bachelor's degree: 2,409
- Master's degree: 930
- Professional school degree: 163
- Doctorate degree: 155

Education attainment for females 25 years and older:
- No schooling: 90
- Nursery to 4th grade: 4
- 5th and 6th grade: 9
- 7th and 8th grade: 18
- 9th grade: 0
- 10th grade: 78
- 11th grade: 55
- 12th grade, no diploma: 79
- High school graduate (or equivalency): 1,634
- Less than 1 year of college: 411
- Some college more than 1 year, no degree: 683
- Associate degree: 856
- Bachelor's degree: 2,498
- Master's degree: 1,332
- Professional school degree: 126
- Doctorate degree: 106


Housing units in structures:
- One, detached: 6,997
- One, attached: 281
- Two: 51
- 3 or 4: 172
- 5 to 9: 130
- 10 to 19: 338
- 20 to 49: 117
- 50 or more: 163
Housing units lacking complete kitchen facilities in 2022: 0.5%
House/condo owner moved in on average 18 years ago
Renter moved in on average 4 years ago

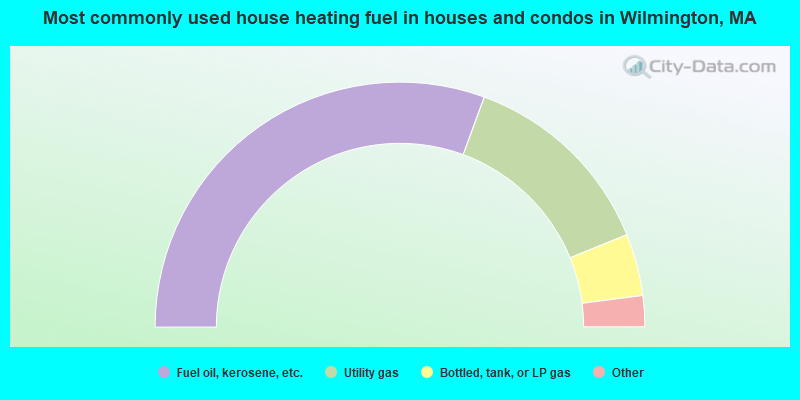
- 61.2%Fuel oil, kerosene, etc.
- 26.5%Utility gas
- 8.2%Bottled, tank, or LP gas
- 2.2%Electricity
- 1.0%Wood
- 0.6%Other fuel
- 0.3%No fuel used
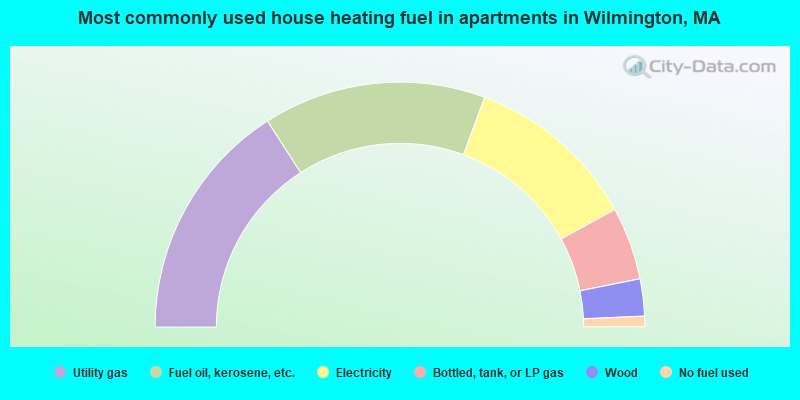
- 31.8%Utility gas
- 29.4%Fuel oil, kerosene, etc.
- 22.8%Electricity
- 9.6%Bottled, tank, or LP gas
- 4.9%Wood
- 1.4%No fuel used
Private vs. public school enrollment:
| Here: | 2.6% |
| Massachusetts: | 10.3% |
| Here: | 17.2% |
| Massachusetts: | 12.3% |
| Here: | 57.3% |
| Massachusetts: | 51.2% |


