Sycamore, IL (Illinois) Houses and Residents
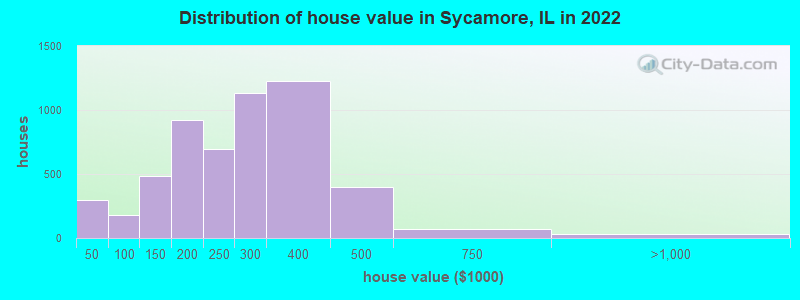
Estimated median house or condo value in 2022: $260,064 (it was $128,300 in 2000 )
Sycamore:
$260,064Illinois:
$251,600
Lower value quartile - upper value quartile: $166,739 - $331,505Mean price in 2022: Detached houses: $286,033 Here:
$286,033State:
$310,164
Townhouses or other attached units: $185,236 Here:
$185,236State:
$286,230
In 3-to-4-unit structures: $127,955 Here:
$127,955State:
$330,907
In 5-or-more-unit structures: $163,830 Here:
$163,830State:
$318,887
Mobile homes: $35,453 Here:
$35,453State:
$78,855
Total population: 17,753 (Urban population: 12,070, Rural population: 62 (8 farm, 54 nonfarm ))
Houses: 7,753 (7,437 occupied: 5,204 owner occupied, 2,191 renter occupied )
% of renters here:
30%State:
33%
Housing density: 1,414 houses/condos per square mile
Median price asked for vacant for-sale houses and condos in 2022 in this county: $178,377.
Median contract rent in 2022: $836 (lower quartile is $631, upper quartile is $975)
Median rent asked for vacant for-rent units in 2022: $901
Median gross rent in Sycamore, IL in 2022: $926
Housing units in Sycamore with a mortgage: 3,881 (263 second mortgage, 0 home equity loan, 230 both second mortgage and home equity loan )Houses without a mortgage: 168
Median household income for houses/condos with a mortgage: $100,644
Median household income for apartments without a mortgage: $69,284
Median monthly housing costs: $1,248
Data:
Median house or condo value ($)
Median house or condo value ($ change since 2000)
Median house or condo value ($) - White
Median house or condo value ($) - Black or African American
Median house or condo value ($) - Asian
Median house or condo value ($) - Hispanic or Latino
Median house or condo value ($) - American Indian and Alaska Native
Median house or condo value ($) - Multirace
Median house or condo value ($) - Other Race
Median price asked for mobile homes ($)
Household density (households per square mile)
Mean house or condo value by units in structure - 1, detached ($)
Mean house or condo value by units in structure - 1, attached ($)
Mean house or condo value by units in structure - 2 ($)
Mean house or condo value by units in structure by units in structure - 3 or 4 ($)
Mean house or condo value by units in structure - 5 or more ($)
Mean house or condo value by units in structure - Boat, RV, van, etc. ($)
Mean house or condo value by units in structure - Mobile home ($)
Median contract rent ($)
Median contract rent - Lower quartile ($)
Median contract rent - Upper quartile ($)
Median gross rent ($)
Urban houses (%)
Rural houses (%)
Houses occupied (%)
Houses occupied (% change since 2000)
Houses owner occupied (%)
Houses owner occupied (% change since 2000)
Houses renter occupied (%)
Houses renter occupied (% change since 2000)
Vacant housing units - For rent (%)
Vacant housing units - For rent (% change since 2000)
Vacant housing units - For sale only (%)
Vacant housing units - For sale only (% change since 2000)
Vacant housing units - Rented or sold, not occupied (%)
Vacant housing units - Rented or sold, not occupied (% change since 2000)
Vacant housing units - For seasonal, recreational, or occasional use (%)
Vacant housing units - For seasonal, recreational, or occasional use (% change since 2000)
Vacant housing units - For migrant workers (%)
Vacant housing units - For migrant workers (% change since 2000)
Vacant housing units - Other vacant (%)
Vacant housing units - Other vacant (% change since 2000)
Median monthly housing costs ($)
Median household income for houses/condos with a mortgage ($)
Median household income for houses/condos without a mortgage ($)
Median household income ($)
Median household income ($) - White
Median household income ($) - Black or African American
Median household income ($) - Asian
Median household income ($) - Hispanic or Latino
Median household income ($) - American Indian and Alaska Native
Median household income ($) - Multirace
Median household income ($) - Other Race
Mortgage status - with mortgage (%)
Mortgage status - with second mortgage (%)
Mortgage status - with home equity loan (%)
Mortgage status - with both second mortgage and home equity loan (%)
Mortgage status - without a mortgage (%)
Median year house/condo built
Median year apartment built
Household type by relationship - Male householder living alone (%)
Household type by relationship - Male householder not living alone (%)
Household type by relationship - Female householder living alone (%)
Household type by relationship - Female householder not living alone (%)
Household type by relationship - Opposite-Sex spouse (%)
Household type by relationship - Same-Sex spouse (%)
Household type by relationship - Opposite-Sex unmarried partner (%)
Household type by relationship - Same-Sex unmarried partner (%)
Household type by relationship - In group quarters (%)
Size of family households - 2-person household (%)
Size of family households - 3-person household (%)
Size of family households - 4-person household (%)
Size of family households - 5-person household (%)
Size of family households - 6-person household (%)
Size of family households - 7-or-more-person household (%)
Size of nonfamily households - 1-person household (%)
Size of nonfamily households - 2-person household (%)
Size of nonfamily households - 3-person household (%)
Size of nonfamily households - 4-person household (%)
Size of nonfamily households - 5-person household (%)
Size of nonfamily households - 6-person household (%)
Size of nonfamily households - 7-or-moreperson household (%)
Year house built - Built 2010 or later (%)
Year house built - Built 2000 to 2009 (%)
Year house built - Built 1990 to 1999 (%)
Year house built - Built 1980 to 1989 (%)
Year house built - Built 1970 to 1979 (%)
Year house built - Built 1960 to 1969 (%)
Year house built - Built 1950 to 1959 (%)
Year house built - Built 1940 to 1949 (%)
Year house built - Built 1939 or earlier (%)
Median number of rooms in houses and condos
Median number of rooms in apartments
Median number of bedrooms in owner occupied houses
Mean number of bedrooms in owner occupied houses
Median number of bedrooms in renter occupied houses
Mean number of bedrooms in renter occupied houses
Median number of vehichles in owner occupied houses
Mean number of vehichles in owner occupied houses
Median number of vehichles in renter occupied houses
Mean number of vehichles in renter occupied houses
Rooms in owner-occupied houses - 1 room (%)
Rooms in owner-occupied houses - 2 rooms (%)
Rooms in owner-occupied houses - 3 rooms (%)
Rooms in owner-occupied houses - 4 rooms (%)
Rooms in owner-occupied houses - 5 rooms (%)
Rooms in owner-occupied houses - 6 rooms (%)
Rooms in owner-occupied houses - 7 rooms (%)
Rooms in owner-occupied houses - 8 rooms (%)
Rooms in owner-occupied houses - 9+ rooms (%)
Rooms in renter-occupied houses - 1 room (%)
Rooms in renter-occupied houses - 2 rooms (%)
Rooms in renter-occupied houses - 3 rooms (%)
Rooms in renter-occupied houses - 4 rooms (%)
Rooms in renter-occupied houses - 5 rooms (%)
Rooms in renter-occupied houses - 6 rooms (%)
Rooms in renter-occupied houses - 7 rooms (%)
Rooms in renter-occupied houses - 8 rooms (%)
Rooms in renter-occupied houses - 9+ rooms (%)
Bedrooms in owner-occupied houses - no bedrooms (%)
Bedrooms in owner-occupied houses - 1 bedroom (%)
Bedrooms in owner-occupied houses - 2 bedrooms (%)
Bedrooms in owner-occupied houses - 3 bedrooms (%)
Bedrooms in owner-occupied houses - 4 bedrooms (%)
Bedrooms in owner-occupied houses - 5+ bedrooms (%)
Bedrooms in renter-occupied houses - no bedrooms (%)
Bedrooms in renter-occupied houses - 1 bedroom (%)
Bedrooms in renter-occupied houses - 2 bedrooms (%)
Bedrooms in renter-occupied houses - 3 bedrooms (%)
Bedrooms in renter-occupied houses - 4 bedrooms (%)
Bedrooms in renter-occupied houses - 5+ bedrooms (%)
Vehicles available in owner-occupied houses - no vehicle available (%)
Vehicles available in owner-occupied houses - 1 vehicle available(%)
Vehicles available in owner-occupied houses - 2 Vehicles available (%)
Vehicles available in owner-occupied houses - 3 Vehicles available (%)
Vehicles available in owner-occupied houses - 4 Vehicles available (%)
Vehicles available in owner-occupied houses - 5+ Vehicles available (%)
Vehicles available in renter-occupied houses - no vehicle available (%)
Vehicles available in renter-occupied houses - 1 vehicle available (%)
Vehicles available in renter-occupied houses - 2 Vehicles available (%)
Vehicles available in renter-occupied houses - 3 Vehicles available (%)
Vehicles available in renter-occupied houses - 4 Vehicles available (%)
Vehicles available in renter-occupied houses - 5+ Vehicles available (%)
Housing units in structures - 1, detached (%)
Housing units in structures - 1, attached (%)
Housing units in structures - 2 (%)
Housing units in structures - 3 or 4 (%)
Housing units in structures - 5 to 9 (%)
Housing units in structures - 10 to 19 (%)
Housing units in structures - 20 to 49 (%)
Housing units in structures - 50 or more (%)
Housing units in structures - Mobile home (%)
Housing units in structures - Boat, RV, van, etc. (%)
Housing units in structures - Owners - 1, detached (%)
Housing units in structures - Owners - 1, attached (%)
Housing units in structures - Owners - 2 (%)
Housing units in structures - Owners - 3 or 4 (%)
Housing units in structures - Owners - 5 to 9 (%)
Housing units in structures - Owners - 10 to 19 (%)
Housing units in structures - Owners - 20 to 49 (%)
Housing units in structures - Owners - 50 or more (%)
Housing units in structures - Owners - Mobile home (%)
Housing units in structures - Owners - Boat, RV, van, etc. (%)
Housing units in structures - Renters - 1, detached (%)
Housing units in structures - Renters - 1, attached (%)
Housing units in structures - Renters - 2 (%)
Housing units in structures - Renters - 3 or 4 (%)
Housing units in structures - Renters - 5 to 9 (%)
Housing units in structures - Renters - 10 to 19 (%)
Housing units in structures - Renters - 20 to 49 (%)
Housing units in structures - Renters - 50 or more (%)
Housing units in structures - Renters - Mobile home (%)
Housing units in structures - Renters - Boat, RV, van, etc. (%)
House/condo owner moved in on average (years ago)
Renter moved in on average (years ago)
Year householder moved into unit - Moved in 1999 to March 2000 (%)
Year householder moved into unit - Moved in 1999 to March 2000 (%) - White
Year householder moved into unit - Moved in 1999 to March 2000 (%) - Black or African American
Year householder moved into unit - Moved in 1999 to March 2000 (%) - Asian
Year householder moved into unit - Moved in 1999 to March 2000 (%) - Hispanic or Latino
Year householder moved into unit - Moved in 1999 to March 2000 (%) - American Indian and Alaska Native
Year householder moved into unit - Moved in 1999 to March 2000 (%) - Multirace
Year householder moved into unit - Moved in 1999 to March 2000 (%) - Other Race
Year householder moved into unit - Moved in 1995 to 1998 (%)
Year householder moved into unit - Moved in 1995 to 1998 (%) - White
Year householder moved into unit - Moved in 1995 to 1998 (%) - Black or African American
Year householder moved into unit - Moved in 1995 to 1998 (%) - Asian
Year householder moved into unit - Moved in 1995 to 1998 (%) - Hispanic or Latino
Year householder moved into unit - Moved in 1995 to 1998 (%) - American Indian and Alaska Native
Year householder moved into unit - Moved in 1995 to 1998 (%) - Multirace
Year householder moved into unit - Moved in 1995 to 1998 (%) - Other Race
Year householder moved into unit - Moved in 1990 to 1994 (%)
Year householder moved into unit - Moved in 1990 to 1994 (%) - White
Year householder moved into unit - Moved in 1990 to 1994 (%) - Black or African American
Year householder moved into unit - Moved in 1990 to 1994 (%) - Asian
Year householder moved into unit - Moved in 1990 to 1994 (%) - Hispanic or Latino
Year householder moved into unit - Moved in 1990 to 1994 (%) - American Indian and Alaska Native
Year householder moved into unit - Moved in 1990 to 1994 (%) - Multirace
Year householder moved into unit - Moved in 1990 to 1994 (%) - Other Race
Year householder moved into unit - Moved in 1980 to 1989 (%)
Year householder moved into unit - Moved in 1980 to 1989 (%) - White
Year householder moved into unit - Moved in 1980 to 1989 (%) - Black or African American
Year householder moved into unit - Moved in 1980 to 1989 (%) - Asian
Year householder moved into unit - Moved in 1980 to 1989 (%) - Hispanic or Latino
Year householder moved into unit - Moved in 1980 to 1989 (%) - American Indian and Alaska Native
Year householder moved into unit - Moved in 1980 to 1989 (%) - Multirace
Year householder moved into unit - Moved in 1980 to 1989 (%) - Other Race
Year householder moved into unit - Moved in 1970 to 1979 (%)
Year householder moved into unit - Moved in 1970 to 1979 (%) - White
Year householder moved into unit - Moved in 1970 to 1979 (%) - Black or African American
Year householder moved into unit - Moved in 1970 to 1979 (%) - Asian
Year householder moved into unit - Moved in 1970 to 1979 (%) - Hispanic or Latino
Year householder moved into unit - Moved in 1970 to 1979 (%) - American Indian and Alaska Native
Year householder moved into unit - Moved in 1970 to 1979 (%) - Multirace
Year householder moved into unit - Moved in 1970 to 1979 (%) - Other Race
Year householder moved into unit - Moved in 1969 or earlier (%)
Year householder moved into unit - Moved in 1969 or earlier (%) - White
Year householder moved into unit - Moved in 1969 or earlier (%) - Black or African American
Year householder moved into unit - Moved in 1969 or earlier (%) - Asian
Year householder moved into unit - Moved in 1969 or earlier (%) - Hispanic or Latino
Year householder moved into unit - Moved in 1969 or earlier (%) - American Indian and Alaska Native
Year householder moved into unit - Moved in 1969 or earlier (%) - Multirace
Year householder moved into unit - Moved in 1969 or earlier (%) - Other Race
Housing units lacking complete plumbing facilities (%)
Housing units lacking complete kitchen facilities (%)
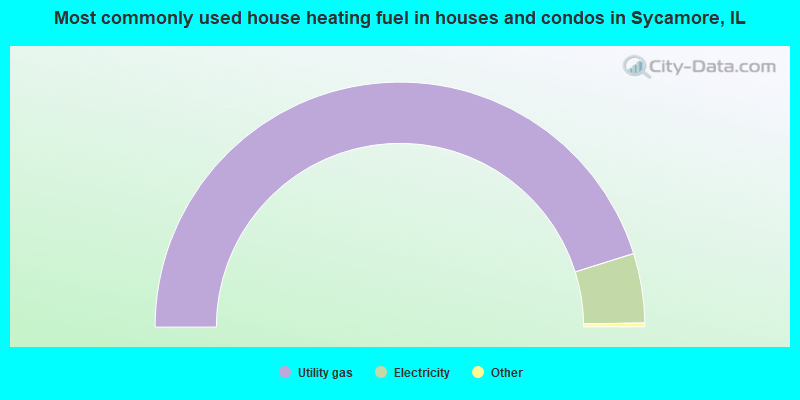
House heating fuel used in houses and condos - Utility gas (%)
House heating fuel used in houses and condos - Bottled, tank, or LP gas (%)
House heating fuel used in houses and condos - Electricity (%)
House heating fuel used in houses and condos - Fuel oil, kerosene, etc. (%)
House heating fuel used in houses and condos - Coal or coke (%)
House heating fuel used in houses and condos - Wood (%)
House heating fuel used in houses and condos - Solar energy (%)
House heating fuel used in houses and condos - Other fuel (%)
House heating fuel used in houses and condos - No fuel used (%)
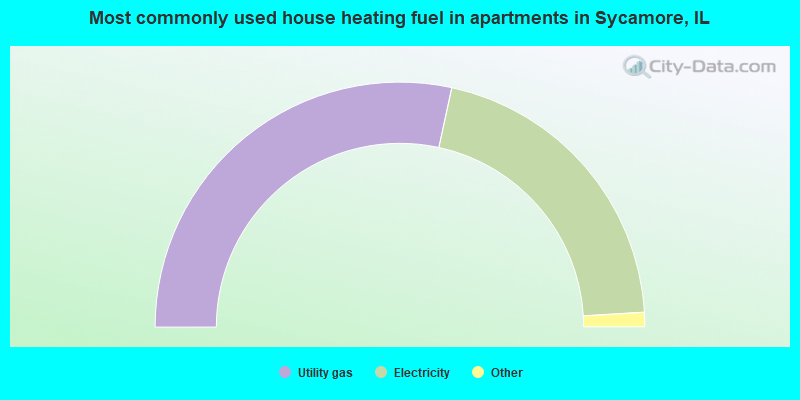
House heating fuel used in apartments - Utility gas (%)
House heating fuel used in apartments - Bottled, tank, or LP gas (%)
House heating fuel used in apartments - Electricity (%)
House heating fuel used in apartments - Fuel oil, kerosene, etc. (%)
House heating fuel used in apartments - Coal or coke (%)
House heating fuel used in apartments - Wood (%)
House heating fuel used in apartments - Solar energy (%)
House heating fuel used in apartments - Other fuel (%)
House heating fuel used in apartments - No fuel used (%)
Latest news about housing in Sycamore, IL collected exclusively by city-data.com from local newspapers, TV, and radio stations
Median year house/condo built: 1993Median year apartment built: 1975Household type by relationship:
Households: 18,089
Male householders: 3,234 (888 living alone ), Female householders: 4,129 (1,079 living alone )3,532 spouses (3,492 opposite-sex spouses ), 731 unmarried partners , (636 opposite-sex unmarried partners ), 5,581 children (5,312 natural , 25 adopted , 242 stepchildren ), 268 grandchildren , 62 brothers or sisters , 220 parents , 12 foster children , 35 other relatives , 119 non-relatives In group quarters: 159
Size of family households: 2,942 2-persons , 878 3-persons , 844 4-persons , 451 5-persons , 75 6-persons , 147 7-or-more-persons .
Size of nonfamily households: 1,799 1-person , 454 2-persons .
2,314 married couples with children. single-parent households (253 men , 1,390 women ).
92.7% of residents of Sycamore speak English at home. of residents speak Spanish at home (65% speak English very well , 21% speak English well , 9% speak English not well , 5% don't speak English at all ).of residents speak other Indo-European language at home (31% speak English very well , 28% speak English well , 6% speak English not well , 35% don't speak English at all ).of residents speak Asian or Pacific Island language at home (70% speak English very well , 11% speak English well , 10% speak English not well , 9% don't speak English at all ).
Foreign born population: 806 (4.5%)of them are naturalized citizens )
Median number of rooms in houses and condos:
Median number of rooms in apartments
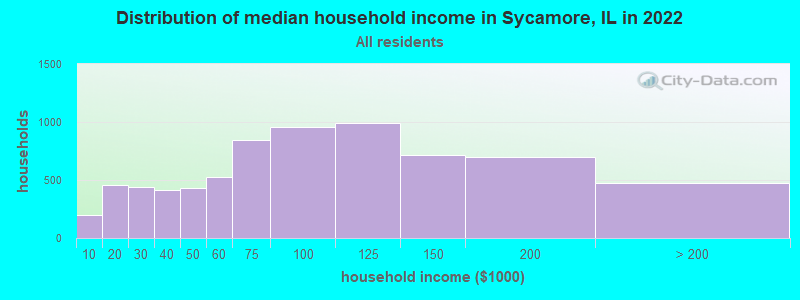
Sycamore, IL household income distribution 199 Less than $10,000461 $10,000 to $19,999437 $20,000 to $29,999418 $30,000 to $39,999435 $40,000 to $49,999526 $50,000 to $59,999843 $60,000 to $74,999953 $75,000 to $99,999988 $100,000 to $124,999712 $125,000 to $149,999699 $150,000 to $199,999474 $200,000 or more
Home value of owner - occupied houses in 2022 in Sycamore, IL 66 Less than $10,00060 $10,000 to $14,99943 $15,000 to $19,99930 $20,000 to $24,99911 $25,000 to $29,99982 $40,000 to $49,9998 $70,000 to $79,99936 $80,000 to $89,99955 $90,000 to $99,999145 $100,000 to $124,999338 $125,000 to $149,999515 $150,000 to $174,999408 $175,000 to $199,999696 $200,000 to $249,9991,129 $250,000 to $299,9991,223 $300,000 to $399,999400 $400,000 to $499,99969 $500,000 to $749,99928 $750,000 to $999,999Rent paid by renters in 2022 in Sycamore, IL 44 Less than $1007 $100 to $14930 $150 to $19911 $200 to $24963 $300 to $34962 $350 to $3997 $400 to $44922 $450 to $49957 $550 to $599323 $600 to $649212 $650 to $699137 $700 to $74981 $750 to $799189 $800 to $899370 $900 to $999227 $1,000 to $1,249200 $1,250 to $1,499118 $1,500 to $1,99932 $3,500 or more5 No cash rent
Percentage of workers working in this county: 64.9%Number of people working at home: 1,166 (12.2% of all workers )
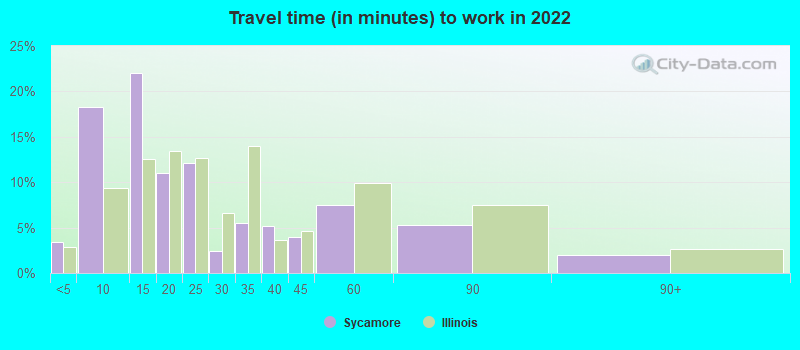
Travel time to work (commute)
Less than 5 minutes: 3105 to 9 minutes: 1,46210 to 14 minutes: 1,47215 to 19 minutes: 92620 to 24 minutes: 99425 to 29 minutes: 20330 to 34 minutes: 63635 to 39 minutes: 29140 to 44 minutes: 36145 to 59 minutes: 1,03560 to 89 minutes: 54590 or more minutes: 174
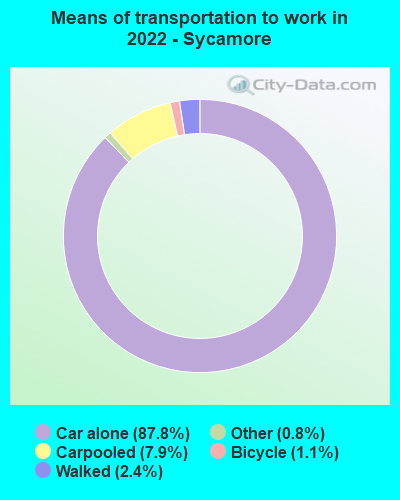
Means of transportation to work:
Drove a car alone: 7,186 (76.6%)Carpooled: 684 (7.3%)Bus : 4 (0.0%)Taxi: 74 (0.8%)Bicycle: 95 (1.0%)Walked: 197 (2.1%)Worked at home: 1,166 (12.4%)
Unemployment by race in 2022
Unemployment rate for White non-Hispanic residents 1.9% Males2.2% FemalesUnemployment rate for other race residents 18.2% FemalesUnemployment rate for Hispanic or Latino residents 7.1% Females
Year of entry for the foreign-born population in Sycamore, Illinois
206 2010 or later 219 2000 to 2009 223 1990 to 1999 119 1980 to 1989 77 1970 to 1979 124 Before 1970
First ancestries reported:
German: 1,169 (17.8%)
Irish: 635 (9.6%)
Yugoslavian: 498 (7.6%)
American: 488 (7.4%)
Italian: 423 (6.4%)
English: 368 (5.6%)
Polish: 366 (5.6%)
Norwegian: 230 (3.5%)
European: 154 (2.3%)
Swedish: 138 (2.1%)
French: 84 (1.3%)
Scottish: 69 (1.0%)
Ukrainian: 67 (1.0%)
Scandinavian: 64 (1.0%)
Scotch-Irish: 64 (1.0%)
Czechoslovakian: 51 (0.8%)
Danish: 43 (0.7%)
Russian: 43 (0.7%)
Welsh: 39 (0.6%)
Portuguese: 30 (0.5%)
Dutch: 26 (0.4%)
British: 22 (0.3%)
Belgian: 17 (0.3%)
Turkish: 15 (0.2%)
Czech: 12 (0.2%)
African: 10 (0.2%)
Greek: 9 (0.1%)
Armenian: 8 (0.1%)
Bulgarian: 8 (0.1%)
Lithuanian: 8 (0.1%)
Finnish: 6 (0.09%)
French Canadian: 5 (0.08%)
Pennsylvania German: 5 (0.08%)
Northern European: 4 (0.06%) Most common places of birth for foreign-born residents (%): Mexico Sycamore:
31.6% (283)Illinois:
34.7% (626,958)
Bosnia and Herzegovina Sycamore:
24.9% (223)Illinois:
0.6% (10,776)
Colombia Sycamore:
10.4% (93)Illinois:
0.9% (16,553)
China, excluding Hong Kong and Taiwan Sycamore:
8.4% (75)Illinois:
4.1% (74,364)
Kazakhstan Sycamore:
4.8% (43)Illinois:
0.1% (2,070)
Turkey Sycamore:
4.1% (37)Illinois:
0.3% (4,823)
Spain Sycamore:
3.9% (35)Illinois:
0.2% (2,861)
India Sycamore:
3.0% (27)Illinois:
9.2% (166,409)
Ukraine Sycamore:
2.5% (22)Illinois:
1.6% (29,316)
Norway Sycamore:
1.9% (17)Illinois:
0.0% (679)
Korea Sycamore:
1.7% (15)Illinois:
2.2% (40,393)
Place of birth for U.S.-born residents:
This state: 13,467Other state: 3,896Northeast: 265Midwest: 2,187South: 911West: 512 86.7% of Sycamore residents lived in the same house 1 years ago.
Out of people who lived in different houses, 44.4% lived in this county.
Out of people who lived in different counties, 75.3% lived in Illinois.
Sycamore:
86.7%State average:
88.3%
Education attainment for males 25 years and older:
No schooling: 13Nursery to 4th grade: 35th and 6th grade: 197th and 8th grade: 09th grade: 3310th grade: 911th grade: 8612th grade, no diploma: 84High school graduate (or equivalency): 1,044Less than 1 year of college: 353Some college more than 1 year, no degree: 763Associate degree: 760Bachelor's degree: 1,309Master's degree: 593Professional school degree: 102Doctorate degree: 133
Education attainment for females 25 years and older:
No schooling: 30Nursery to 4th grade: 05th and 6th grade: 27th and 8th grade: 879th grade: 2410th grade: 4111th grade: 012th grade, no diploma: 57High school graduate (or equivalency): 1,365Less than 1 year of college: 627Some college more than 1 year, no degree: 919Associate degree: 816Bachelor's degree: 1,478Master's degree: 987Professional school degree: 56Doctorate degree: 256
Housing units in structures:
One, detached: 4,183One, attached: 1,321Two: 3303 or 4: 7345 to 9: 70510 to 19: 6320 to 49: 9650 or more: 98Mobile homes: 219Housing units lacking complete plumbing facilities in 2022: 0.5%Housing units lacking complete kitchen facilities in 2022: 1.1%House/condo owner moved in on average 9 years ago
Renter moved in on average 2 years ago
Private vs. public school enrollment:
Students in private schools in grades 1 to 8 (elementary and middle school): 229 Students in private schools in grades 9 to 12 (high school): 10 Students in private undergraduate colleges: 416