South Antelope Valley, CA (California) Houses and Residents
| South Antelope Valley: | $512,000 |
| California: | $715,900 |
Total population: 171,490 (Urban population: 148,212, Rural population: 19,756 (261 farm, 19,495 nonfarm))
Houses: 55,065 (50,690 occupied: 37,922 owner occupied, 12,768 renter occupied)
| % of renters here: | 25% |
| State: | 44% |
Housing density: 46 houses/condos per square mile
Median price asked for vacant for-sale houses and condos in 2022 in this county: $1,291,802.
Median contract rent in 2022: $1,463 (lower quartile is $1,024, upper quartile is over $2,000)
Median rent asked for vacant for-rent units in 2022: $1,302
Median gross rent in South Antelope Valley, CA in 2022: $1,661
Housing units in South Antelope Valley with a mortgage: 30,054 (5,170 second mortgage, 1,716 home equity loan, 80 both second mortgage and home equity loan)
Houses without a mortgage: 3,586
Compare current foreclosures near South Antelope Valley, CA:


Household type by relationship:
Households: 9,646,924- In family households: 8,234,154 (1,430,848 male householders, 763,232 female householders)
1,480,665 spouses, 3,033,524 children (2,872,074 natural, 53,496 adopted, 107,954 stepchildren), 308,856 grandchildren, 205,746 brothers or sisters, 184,807 parents, foster children, 318,669 other relatives, 372,007 non-relatives
- In nonfamily households: 1,412,770 (510,532 male householders (360,530 living alone)), 536,592 female householders (424,398 living alone)), 365,646 nonrelatives
- In group quarters: 171,681 (68,682 institutionalized population)
1,648,001 married couples with children.
626,289 single-parent households (146,085 men, 480,204 women).
69.9% of residents of South Antelope Valley speak English at home.
24.8% of residents speak Spanish at home (56% speak English very well, 22% speak English well, 15% speak English not well, 7% don't speak English at all).
2.3% of residents speak other Indo-European language at home (75% speak English very well, 15% speak English well, 8% speak English not well, 1% don't speak English at all).
2.4% of residents speak Asian or Pacific Island language at home (60% speak English very well, 26% speak English well, 11% speak English not well, 2% don't speak English at all).
0.7% of residents speak other language at home (73% speak English very well, 18% speak English well, 7% speak English not well, 2% don't speak English at all).
Foreign born population: 27,368 (16.0%)
(63.7% of them are naturalized citizens)
| Here: | 7.0 |
| State: | 6.0 |
| Here: | 4.9 |
| State: | 3.9 |

- Bedrooms in owner-occupied houses and condos in South Antelope Valley, California
- 779no bedroom
- 1,9351 bedroom
- 4,5822 bedrooms
- 17,2573 bedrooms
- 11,3234 bedrooms
- 2,0465+ bedrooms

- Bedrooms in renter-occupied apartments in South Antelope Valley, California
- 1,150no bedroom
- 2,6361 bedroom
- 4,1642 bedrooms
- 3,3303 bedrooms
- 1,3214 bedrooms
- 1675+ bedrooms

- Cars and other vehicles available in South Antelope Valley in owner-occupied houses/condos
- 906no vehicle
- 7,4501 vehicle
- 18,1572 vehicles
- 8,1593 vehicles
- 2,3464 vehicles
- 9045+ vehicles

- Cars and other vehicles available in South Antelope Valley in renter-occupied apartments
- 2,143no vehicle
- 5,8281 vehicle
- 3,6772 vehicles
- 8973 vehicles
- 1494 vehicles
- 745+ vehicles

- Rooms in owner-occupied houses in South Antelope Valley, California
- 1431 room
- 6952 rooms
- 3,2853 rooms
- 2,0564 rooms
- 6,9485 rooms
- 8,6736 rooms
- 7,7907 rooms
- 4,8488 rooms
- 3,4849+ rooms

- Rooms in renter-occupied apartments in South Antelope Valley, California
- 7731 room
- 1,4862 rooms
- 2,4183 rooms
- 2,5314 rooms
- 2,2905 rooms
- 1,6636 rooms
- 8727 rooms
- 5208 rooms
- 2159+ rooms


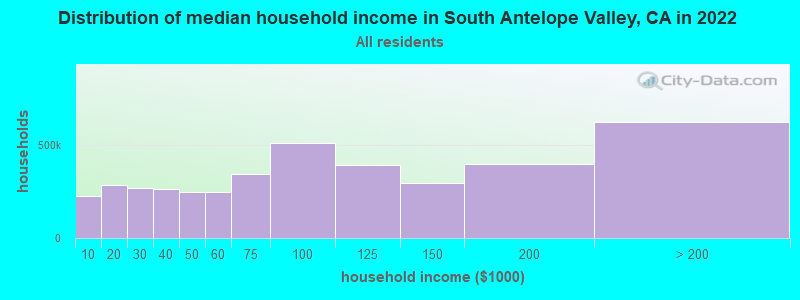
South Antelope Valley, CA household income distribution

- 226,962Less than $10,000
- 286,111$10,000 to $19,999
- 268,438$20,000 to $29,999
- 264,905$30,000 to $39,999
- 250,462$40,000 to $49,999
- 250,663$50,000 to $59,999
- 345,285$60,000 to $74,999
- 509,650$75,000 to $99,999
- 395,945$100,000 to $124,999
- 298,697$125,000 to $149,999
- 400,132$150,000 to $199,999
- 625,601$200,000 or more
Percentage of workers working in this county: 93.9%
Number of people working at home: 13,343 (17.0% of all workers)
Travel time to work (commute)
- Less than 5 minutes: 853
- 5 to 9 minutes: 4,213
- 10 to 14 minutes: 6,247
- 15 to 19 minutes: 6,955
- 20 to 24 minutes: 5,517
- 25 to 29 minutes: 1,741
- 30 to 34 minutes: 4,637
- 35 to 39 minutes: 1,173
- 40 to 44 minutes: 1,826
- 45 to 59 minutes: 8,353
- 60 to 89 minutes: 13,118
- 90 or more minutes: 6,694
Means of transportation to work:
- Drove a car alone: 45,578 (71.7%)
- Carpooled: 13,072 (20.6%)
- Bus or trolley bus: 945 (1.5%)
- Streetcar or trolley car: 4 (0.0%)
- Subway or elevated: 46 (0.1%)
- Railroad: 427 (0.7%)
- Taxi: 16 (0.0%)
- Motorcycle: 222 (0.3%)
- Bicycle: 131 (0.2%)
- Walked: 536 (0.8%)
- Other means: 350 (0.6%)
- Worked at home: 2,203 (3.5%)


- Year of entry for the foreign-born population in South Antelope Valley, California
- 3,6501995 to March 2000
- 4,0821990 to 1994
- 5,2221985 to 1989
- 4,9191980 to 1984
- 4,1891975 to 1979
- 3,0161970 to 1974
- 1,6111965 to 1969
- 2,622Before 1965
Most common places of birth for foreign-born residents (%):
| South Antelope Valley: | 48.1% (14,109) |
| California: | 44.3% (3,928,701) |
| South Antelope Valley: | 10.4% (3,042) |
| California: | 4.1% (359,673) |
| South Antelope Valley: | 6.7% (1,952) |
| California: | 7.5% (664,935) |
| South Antelope Valley: | 4.3% (1,274) |
| California: | 2.4% (211,458) |
| South Antelope Valley: | 1.7% (493) |
| California: | 1.6% (141,181) |
| South Antelope Valley: | 1.6% (463) |
| California: | 1.1% (98,160) |
Place of birth for U.S.-born residents:
- This state: 101,056
- Other state: 36,307
- Northeast: 7,070
- Midwest: 12,419
- South: 10,536
- West: 6,282
51% of South Antelope Valley residents lived in the same house 5 years ago.
Out of people who lived in different houses, 83% lived in this county.
Out of people who lived in different counties, 55% lived in California.
Education attainment for males 25 years and older:
- No schooling: 988
- Nursery to 4th grade: 464
- 5th and 6th grade: 1,324
- 7th and 8th grade: 946
- 9th grade: 999
- 10th grade: 1,015
- 11th grade: 1,834
- 12th grade, no diploma: 2,739
- High school graduate (or equivalency): 11,014
- Less than 1 year of college: 4,213
- Some college more than 1 year, no degree: 9,222
- Associate degree: 3,659
- Bachelor's degree: 4,795
- Master's degree: 1,565
- Professional school degree: 668
- Doctorate degree: 297

Education attainment for females 25 years and older:
- No schooling: 1,087
- Nursery to 4th grade: 433
- 5th and 6th grade: 1,648
- 7th and 8th grade: 1,138
- 9th grade: 1,215
- 10th grade: 1,345
- 11th grade: 2,168
- 12th grade, no diploma: 2,802
- High school graduate (or equivalency): 12,708
- Less than 1 year of college: 5,194
- Some college more than 1 year, no degree: 9,126
- Associate degree: 3,697
- Bachelor's degree: 4,888
- Master's degree: 1,305
- Professional school degree: 338
- Doctorate degree: 110


Housing units in structures:
- One, detached: 43,228
- One, attached: 1,482
- Two: 306
- 3 or 4: 1,002
- 5 to 9: 1,158
- 10 to 19: 809
- 20 to 49: 1,286
- 50 or more: 2,272
- Mobile homes: 3,324
- Boats, RVs, vans, etc.: 198
Median worth of mobile homes: $120,103
Housing units lacking complete kitchen facilities: 1.7%

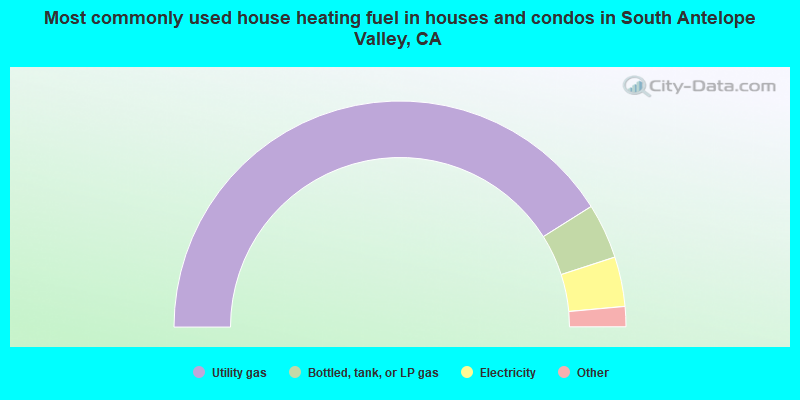
- 82.1%Utility gas
- 7.9%Bottled, tank, or LP gas
- 7.1%Electricity
- 2.1%Wood
- 0.5%Other fuel
- 0.2%No fuel used
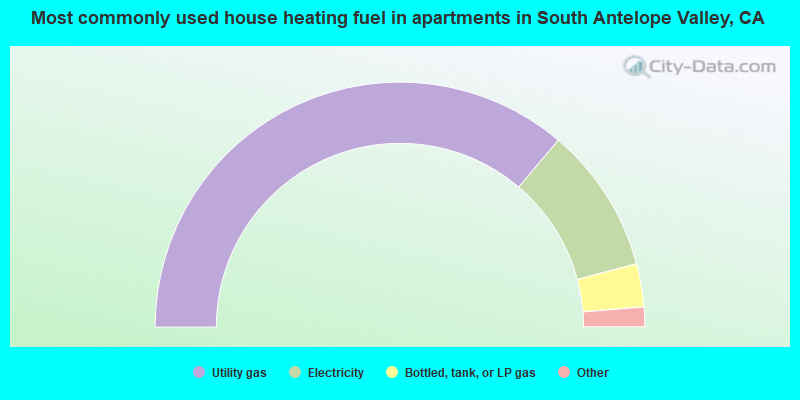
- 72.4%Utility gas
- 19.3%Electricity
- 5.7%Bottled, tank, or LP gas
- 1.1%Wood
- 1.0%No fuel used
- 0.4%Other fuel
Private vs. public school enrollment:
| Here: | 7.7% |
| California: | 9.9% |
| Here: | 6.0% |
| California: | 7.8% |
| Here: | 12.9% |
| California: | 15.4% |


