San Pablo, CA (California) Houses and Residents
| San Pablo: | $524,231 |
| California: | $715,900 |
Mean price in 2022:
Detached houses: $571,392
Here: $571,392 State: $988,808 Townhouses or other attached units: $555,139
Here: $555,139 State: $838,546 In 2-unit structures: $517,050
Here: $517,050 State: $1,138,100 In 3-to-4-unit structures: $366,075
Here: $366,075 State: $824,253 In 5-or-more-unit structures: $200,804
Here: $200,804 State: $730,996 Mobile homes: $43,653
Here: $43,653 State: $184,506
Total population: 30,050 (All urban)
Houses: 10,304 (9,874 occupied: 4,196 owner occupied, 5,699 renter occupied)
| % of renters here: | 58% |
| State: | 44% |
Housing density: 3,999 houses/condos per square mile
Median price asked for vacant for-sale houses and condos in 2022 in this county: $378,161.
Median contract rent in 2022: $1,586 (lower quartile is $1,217, upper quartile is over $2,000)
Median rent asked for vacant for-rent units in 2022: $2,128
Median gross rent in San Pablo, CA in 2022: $1,794
Housing units in San Pablo with a mortgage: 2,743 (221 second mortgage, 0 home equity loan, 188 both second mortgage and home equity loan)
Houses without a mortgage: 3
Median household income for houses/condos with a mortgage: $95,416
Median household income for apartments without a mortgage: $75,513
Median monthly housing costs: $1,688
Compare current foreclosures in San Pablo, CA:
| Photo | Address | Area | Beds / Baths | Price | Details |
|---|---|---|---|---|---|

|
#1
21st St
San Pablo, CA 94806
|
1,665 sq. feet
|
2 baths 3 beds |
show details | |

|
#2
El Portal Dr Apt D
San Pablo, CA 94806
|
1,058 sq. feet
|
2 baths 2 beds |
show details | |

|
#3
California Ave
San Pablo, CA 94806
|
1,169 sq. feet
|
1 baths 2 beds |
show details | |

|
#4
Stoneglen S
San Pablo, CA 94806
|
1,176 sq. feet
|
2 baths 2 beds |
show details | |

|
#5
California Ave
San Pablo, CA 94806
|
805 sq. feet
|
1 baths 2 beds |
show details | |

|
#6
Moyers Rd
San Pablo, CA 94806
|
1,202 sq. feet
|
2 baths 3 beds |
show details | |

|
#7
Crucero Ave
San Pablo, CA 94806
|
1,264 sq. feet
|
2 baths 3 beds |
show details | |

|
#8
Del Monte Dr
San Pablo, CA 94806
|
1,441 sq. feet
|
2 baths 4 beds |
show details | |

|
#9
Market Ave Apt 318
San Pablo, CA 94806
|
949 sq. feet
|
1 baths 2 beds |
show details | |

|
#10
Giant Rd Apt 31
San Pablo, CA 94806
|
1,121 sq. feet
|
2 baths 2 beds |
show details |
| Photo | Address | Area | Beds / Baths | Price | Details |
|---|---|---|---|---|---|

|
#11
Greenwood Dr
San Pablo, CA 94806
|
1,139 sq. feet
|
1 baths 3 beds |
show details | |

|
#12
Manor Dr
San Pablo, CA 94806
|
825 sq. feet
|
1 baths 2 beds |
show details | |

|
#13
Northridge Dr
San Pablo, CA 94806
|
1,319 sq. feet
|
1 baths 2 beds |
show details | |

|
#14
East Ct
San Pablo, CA 94806
|
816 sq. feet
|
1 baths 1 beds |
show details | |

|
#15
16th St
San Pablo, CA 94806
|
1,139 sq. feet
|
2 baths 3 beds |
show details | |

|
#16
19th St
San Pablo, CA 94806
|
985 sq. feet
|
1 baths 3 beds |
show details | |

|
#17
Draper St
San Pablo, CA 94806
|
1,454 sq. feet
|
2 baths 3 beds |
show details | |

|
#18
26th St
San Pablo, CA 94806
|
1,113 sq. feet
|
2 baths 3 beds |
show details | |

|
#19
West Ct
San Pablo, CA 94806
|
816 sq. feet
|
1 baths 1 beds |
show details | |

|
#20
Moyers Rd
San Pablo, CA 94806
|
1,101 sq. feet
|
1 baths 4 beds |
show details |
| Photo | Address | Area | Beds / Baths | Price | Details |
|---|---|---|---|---|---|

|
#21
Stoneglen N
San Pablo, CA 94806
|
1,005 sq. feet
|
1 baths 1 beds |
show details | |

|
#22
Van Ness St
San Pablo, CA 94806
|
1,126 sq. feet
|
1 baths 2 beds |
show details | |

|
#23
Murphy Dr
San Pablo, CA 94806
|
1,160 sq. feet
|
2 baths 3 beds |
show details | |

|
#24
Broadway Ave
San Pablo, CA 94806
|
902 sq. feet
|
1 baths 1 beds |
show details | |

|
#25
Dundee Rd
San Pablo, CA 94806
|
1,680 sq. feet
|
3 baths 3 beds |
show details | |

|
#26
Harrison Dr
San Pablo, CA 94806
|
1,132 sq. feet
|
1 baths 3 beds |
show details | |

|
#27
Cedar Ter
San Pablo, CA 94806
|
1,320 sq. feet
|
2 baths 3 beds |
show details | |

|
#28
Blackwood Ct
San Pablo, CA 94806
|
1,441 sq. feet
|
2 baths 4 beds |
show details | |

|
#29
California Ave
San Pablo, CA 94806
|
1,169 sq. feet
|
1 baths 2 beds |
show details | |

|
#30
Draper St
San Pablo, CA 94806
|
1,187 sq. feet
|
2 baths 3 beds |
show details |
| Photo | Address | Area | Beds / Baths | Price | Details |
|---|---|---|---|---|---|

|
#31
Arundel Way
San Pablo, CA 94806
|
948 sq. feet
|
1 baths 3 beds |
show details | |

|
#32
12th St
San Pablo, CA 94806
|
1,869 sq. feet
|
2 baths 4 beds |
show details | |

|
#33
Moyers Rd
San Pablo, CA 94806
|
1,202 sq. feet
|
2 baths 3 beds |
show details | |

|
#34
Cleek Ct
San Pablo, CA 94806
|
1,777 sq. feet
|
2 baths 3 beds |
show details | |

|
#35
17th St
San Pablo, CA 94806
|
1,237 sq. feet
|
2 baths 4 beds |
show details | |

|
#36
11th St
San Pablo, CA 94806
|
1,735 sq. feet
|
2 baths 3 beds |
show details | |

|
#37
Longview Dr
San Pablo, CA 94806
|
2,097 sq. feet
|
2 baths 3 beds |
show details | |

|
#38
Rock Rose Way
San Pablo, CA 94806
|
2,732 sq. feet
|
3 baths 5 beds |
show details | |

|
#39
Jo Ann Dr
San Pablo, CA 94806
|
1,120 sq. feet
|
2 baths 3 beds |
show details | |

|
#40
Jerilynn Ave
San Pablo, CA 94806
|
1,807 sq. feet
|
2 baths 3 beds |
show details |
| Photo | Address | Area | Beds / Baths | Price | Details |
|---|---|---|---|---|---|

|
#41
San Pablo Ave Apt 2213
San Pablo, CA 94806
|
790 sq. feet
|
1 baths 1 beds |
show details | |

|
#42
San Diego St
San Pablo, CA 94806
|
1,351 sq. feet
|
2 baths 2 beds |
show details | |

|
#43
Manchester Ave
San Pablo, CA 94806
|
1,459 sq. feet
|
1 baths 4 beds |
show details | |

|
#44
Manchester Ave
San Pablo, CA 94806
|
1,459 sq. feet
|
1 baths 4 beds |
show details | |

|
#45
Kenney Dr
San Pablo, CA 94806
|
1,188 sq. feet
|
2 baths 3 beds |
show details | |

|
#46
20th St
San Pablo, CA 94806
|
928 sq. feet
|
1 baths 3 beds |
show details | |

|
#47
Flannery Rd
San Pablo, CA 94806
|
3,000 sq. feet
|
3 baths 5 beds |
show details | |

|
#48
Crucero Ave
San Pablo, CA 94806
|
1,264 sq. feet
|
2 baths 3 beds |
show details | |

|
#49
California Ave
San Pablo, CA 94806
|
805 sq. feet
|
1 baths 2 beds |
show details | |

|
Check over 1 million property listings on Foreclosure.com!
|
browse all offers | |||


 | Young couple seeking to buy or rent a house in Bay Area (10 replies) |
| SF/Bay Area Crime Thread (1410 replies) |
| Building a home in the surrounding SF area (17 replies) |
| Job in Palo Alto - Moving with a husband and baby - Would like to rent a house. Suggestions please? (23 replies) |
| Moving to Irvine, where should I rent? (14 replies) |
| Does Redondo Beach area have Victorian Homes? (10 replies) |

Median year apartment built: 1973
Household type by relationship:
Households: 31,751- Male householders: 4,775 (1,023 living alone), Female householders: 4,913 (963 living alone)
3,928 spouses (3,854 opposite-sex spouses), 670 unmarried partners, (612 opposite-sex unmarried partners), 11,864 children (11,131 natural, 342 adopted, 391 stepchildren), 1,046 grandchildren, 871 brothers or sisters, 919 parents, 0 foster children, 1,165 other relatives, 1,075 non-relatives
- In group quarters: 518
Size of family households: 2,093 2-persons, 1,565 3-persons, 1,615 4-persons, 1,273 5-persons, 644 6-persons, 373 7-or-more-persons.
Size of nonfamily households: 2,010 1-person, 353 2-persons, 10 3-persons.
4,015 married couples with children.
2,700 single-parent households (699 men, 2,001 women).
33.6% of residents of San Pablo speak English at home.
48.6% of residents speak Spanish at home (58% speak English very well, 20% speak English well, 17% speak English not well, 6% don't speak English at all).
2.7% of residents speak other Indo-European language at home (44% speak English very well, 22% speak English well, 28% speak English not well, 6% don't speak English at all).
14.2% of residents speak Asian or Pacific Island language at home (55% speak English very well, 25% speak English well, 14% speak English not well, 7% don't speak English at all).
1.4% of residents speak other language at home (31% speak English very well, 26% speak English well, 8% speak English not well, 35% don't speak English at all).
Foreign born population: 13,304 (41.9%)
(43.0% of them are naturalized citizens)
| Here: | 5.0 |
| State: | 6.0 |
| Here: | 4.0 |
| State: | 3.9 |

- Bedrooms in owner-occupied houses and condos in San Pablo, California
- 159no bedroom
- 2381 bedroom
- 1,3742 bedrooms
- 1,9203 bedrooms
- 4744 bedrooms
- 335+ bedrooms

- Bedrooms in renter-occupied apartments in San Pablo, California
- 196no bedroom
- 1,2411 bedroom
- 2,7672 bedrooms
- 1,2853 bedrooms
- 1844 bedrooms
- 265+ bedrooms

- Cars and other vehicles available in San Pablo in owner-occupied houses/condos
- 185no vehicle
- 8431 vehicle
- 1,5432 vehicles
- 8913 vehicles
- 5274 vehicles
- 2075+ vehicles

- Cars and other vehicles available in San Pablo in renter-occupied apartments
- 592no vehicle
- 2,3411 vehicle
- 1,7552 vehicles
- 7163 vehicles
- 2424 vehicles
- 535+ vehicles

- Rooms in owner-occupied houses in San Pablo, California
- 1111 room
- 952 rooms
- 2783 rooms
- 9774 rooms
- 1,3045 rooms
- 9576 rooms
- 2307 rooms
- 1528 rooms
- 929+ rooms

- Rooms in renter-occupied apartments in San Pablo, California
- 1961 room
- 1612 rooms
- 1,6133 rooms
- 1,8474 rooms
- 1,2705 rooms
- 3196 rooms
- 1897 rooms
- 658 rooms
- 409+ rooms


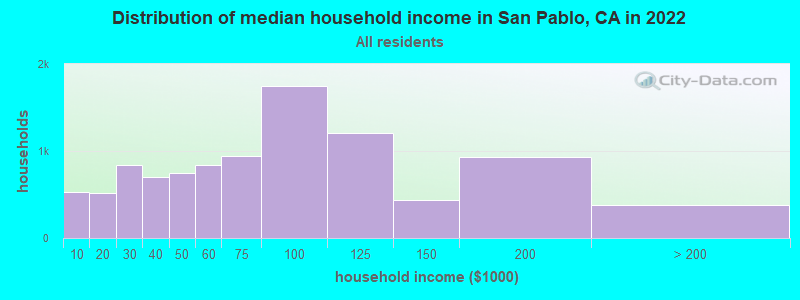
San Pablo, CA household income distribution

- 530Less than $10,000
- 521$10,000 to $19,999
- 838$20,000 to $29,999
- 696$30,000 to $39,999
- 748$40,000 to $49,999
- 838$50,000 to $59,999
- 947$60,000 to $74,999
- 1,742$75,000 to $99,999
- 1,209$100,000 to $124,999
- 441$125,000 to $149,999
- 929$150,000 to $199,999
- 374$200,000 or more
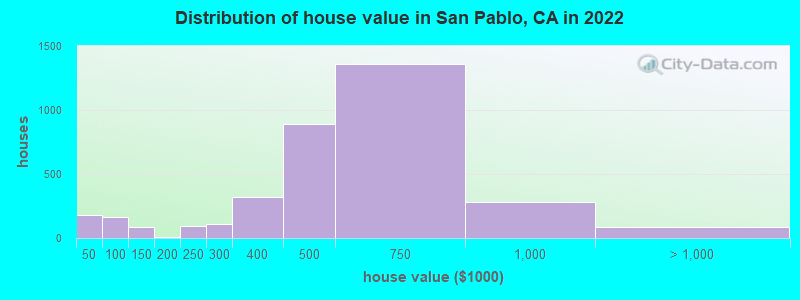
Home value of owner - occupied houses in 2022 in San Pablo, CA
-
- 55Less than $10,000
- 36$10,000 to $14,999
- 21$20,000 to $24,999
- 19$30,000 to $34,999
- 27$35,000 to $39,999
- 15$40,000 to $49,999
- 88$50,000 to $59,999
- 23$60,000 to $69,999
- 38$80,000 to $89,999
- 21$100,000 to $124,999
- 61$125,000 to $149,999
- 5$175,000 to $199,999
- 93$200,000 to $249,999
- 109$250,000 to $299,999
- 320$300,000 to $399,999
- 888$400,000 to $499,999
- 1,355$500,000 to $749,999
- 282$750,000 to $999,999
- 61$1,000,000 to $1,499,999
- 27$2,000,000 or more
Rent paid by renters in 2022 in San Pablo, CA
-
- 127Less than $100
- 70$150 to $199
- 10$200 to $249
- 82$250 to $299
- 14$300 to $349
- 47$350 to $399
- 46$400 to $449
- 18$450 to $499
- 30$500 to $549
- 18$550 to $599
- 56$600 to $649
- 128$650 to $699
- 36$700 to $749
- 38$750 to $799
- 94$800 to $899
- 79$900 to $999
- 504$1,000 to $1,249
- 773$1,250 to $1,499
- 1,820$1,500 to $1,999
- 1,023$2,000 to $2,499
- 183$2,500 to $2,999
- 65$3,000 to $3,499
- 69$3,500 or more
- 193No cash rent


Percentage of workers working in this county: 56.6%
Number of people working at home: 1,072 (7.7% of all workers)
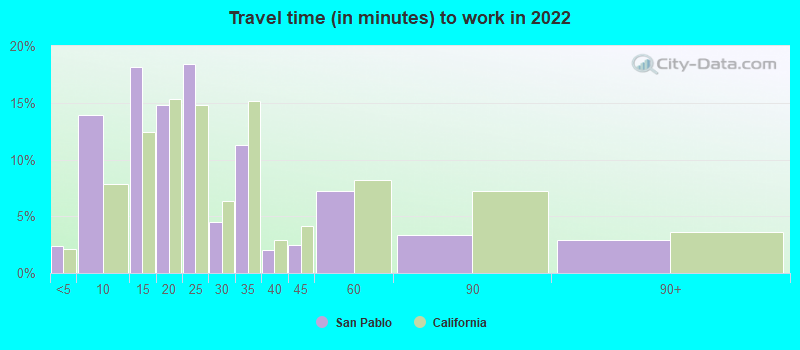
Travel time to work (commute)
- Less than 5 minutes: 215
- 5 to 9 minutes: 733
- 10 to 14 minutes: 1,879
- 15 to 19 minutes: 1,283
- 20 to 24 minutes: 1,287
- 25 to 29 minutes: 332
- 30 to 34 minutes: 2,149
- 35 to 39 minutes: 540
- 40 to 44 minutes: 600
- 45 to 59 minutes: 1,597
- 60 to 89 minutes: 1,301
- 90 or more minutes: 597

Means of transportation to work:
- Drove a car alone: 4,662 (65.8%)
- Carpooled: 739 (10.4%)
- Bus: 99 (1.4%)
- Subway or elevated rail: 12 (0.2%)
- Taxi: 74 (1.0%)
- Bicycle: 9 (0.1%)
- Walked: 302 (4.3%)
- Worked at home: 1,072 (15.1%)

- Unemployment by race in 2022
- Unemployment rate for White non-Hispanic residents
- 3.3%Males
- 6.8%Females
- Unemployment rate for Black residents
- 0.5%Males
- 5.9%Females
- Unemployment rate for American Indian and Alaska Native residents
- 2.7%Females
- Unemployment rate for Asian residents
- 8.8%Males
- 4.2%Females
- Unemployment rate for other race residents
- 7.2%Males
- 5.5%Females
- Unemployment rate for two or more race residents
- 16.7%Males
- 3.8%Females
- Unemployment rate for Hispanic or Latino residents
- 7.3%Males
- 5.2%Females

- Year of entry for the foreign-born population in San Pablo, California
- 3,7072010 or later
- 2,8722000 to 2009
- 3,2101990 to 1999
- 4,5371980 to 1989
- 1,4181970 to 1979
- 664Before 1970

First ancestries reported:
- American: 219 (0.9%)
- European: 216 (0.9%)
- African: 163 (0.7%)
- Brazilian: 136 (0.6%)
- Portuguese: 131 (0.6%)
- Welsh: 130 (0.6%)
- Afghan: 96 (0.4%)
- Irish: 93 (0.4%)
- German: 81 (0.3%)
- English: 80 (0.3%)
- Italian: 75 (0.3%)
- Yugoslavian: 51 (0.2%)
- French: 34 (0.1%)
- Arab: 26 (0.1%)
- Scandinavian: 19 (0.08%)
- Lebanese: 18 (0.08%)
- Hungarian: 18 (0.08%)
- Norwegian: 17 (0.07%)
- Ethiopian: 16 (0.07%)
- Iranian: 15 (0.06%)
- Scottish: 13 (0.06%)
- Eastern European: 12 (0.05%)
- Swiss: 11 (0.05%)
- British West Indian: 11 (0.05%)
- Greek: 10 (0.04%)
- Nigerian: 8 (0.03%)
- Barbadian: 2 (0.01%)
Most common places of birth for foreign-born residents (%):
| San Pablo: | 39.7% (4,995) |
| California: | 37.2% (3,881,193) |
| San Pablo: | 10.9% (1,372) |
| California: | 7.8% (818,297) |
| San Pablo: | 10.8% (1,362) |
| California: | 4.2% (440,287) |
| San Pablo: | 7.3% (921) |
| California: | 6.6% (684,672) |
| San Pablo: | 5.0% (629) |
| California: | 2.8% (290,436) |
| San Pablo: | 3.7% (461) |
| California: | 0.6% (58,161) |
| San Pablo: | 2.7% (345) |
| California: | 0.5% (48,911) |
| San Pablo: | 2.2% (277) |
| California: | 0.6% (66,590) |
| San Pablo: | 2.2% (274) |
| California: | 4.9% (512,335) |
| San Pablo: | 2.2% (274) |
| California: | 0.7% (74,025) |
Place of birth for U.S.-born residents:
- This state: 16,451
- Other state: 2,081
- Northeast: 372
- Midwest: 427
- South: 1,050
- West: 234
90.9% of San Pablo residents lived in the same house 1 years ago.
Out of people who lived in different houses, 41.2% lived in this county.
Out of people who lived in different counties, 92.4% lived in California.
| San Pablo: | 90.9% |
| State average: | 88.9% |
Education attainment for males 25 years and older:
- No schooling: 734
- Nursery to 4th grade: 233
- 5th and 6th grade: 501
- 7th and 8th grade: 173
- 9th grade: 273
- 10th grade: 48
- 11th grade: 142
- 12th grade, no diploma: 493
- High school graduate (or equivalency): 3,042
- Less than 1 year of college: 439
- Some college more than 1 year, no degree: 1,532
- Associate degree: 592
- Bachelor's degree: 1,049
- Master's degree: 232
- Professional school degree: 67
- Doctorate degree: 15

Education attainment for females 25 years and older:
- No schooling: 920
- Nursery to 4th grade: 222
- 5th and 6th grade: 435
- 7th and 8th grade: 197
- 9th grade: 85
- 10th grade: 60
- 11th grade: 273
- 12th grade, no diploma: 469
- High school graduate (or equivalency): 2,936
- Less than 1 year of college: 707
- Some college more than 1 year, no degree: 1,210
- Associate degree: 931
- Bachelor's degree: 1,361
- Master's degree: 372
- Professional school degree: 33
- Doctorate degree: 16


Housing units in structures:
- One, detached: 4,401
- One, attached: 1,328
- Two: 390
- 3 or 4: 1,008
- 5 to 9: 878
- 10 to 19: 467
- 20 to 49: 486
- 50 or more: 881
- Mobile homes: 410
- Boats, RVs, vans, etc.: 51
Median worth of mobile homes: $63,609
Housing units lacking complete kitchen facilities in 2022: 0.7%
House/condo owner moved in on average 16 years ago
Renter moved in on average 6 years ago

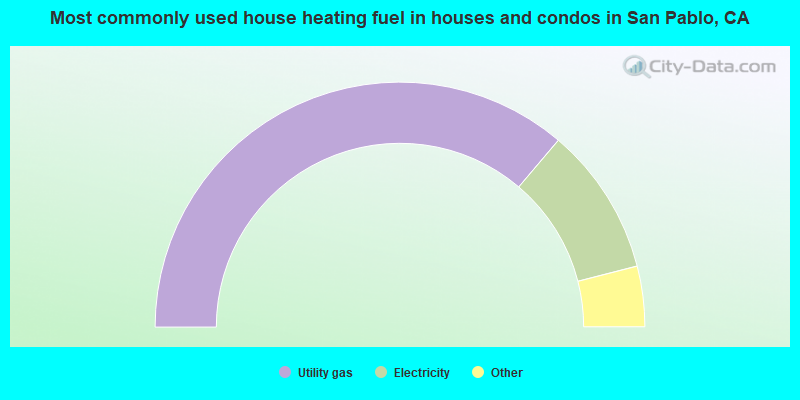
- 72.4%Utility gas
- 19.6%Electricity
- 3.3%Bottled, tank, or LP gas
- 3.0%No fuel used
- 1.0%Solar energy
- 0.4%Wood
- 0.3%Other fuel
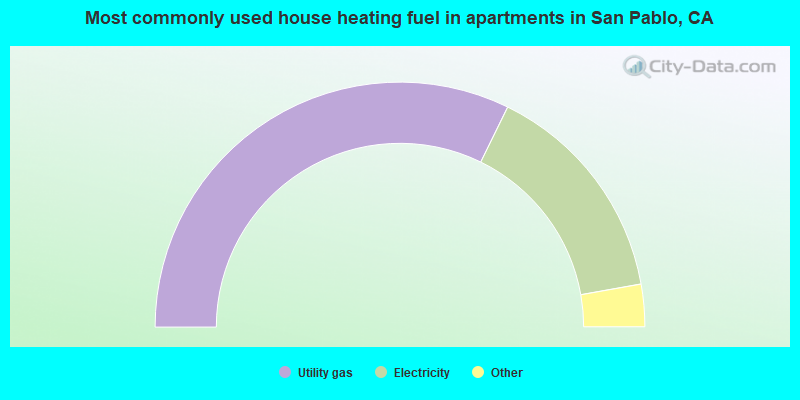
- 64.5%Utility gas
- 29.9%Electricity
- 3.5%No fuel used
- 1.7%Bottled, tank, or LP gas
- 0.2%Other fuel
- 0.2%Wood
Private vs. public school enrollment:
| Here: | 2.3% |
| California: | 10.5% |
| Here: | 13.0% |
| California: | 8.5% |
| Here: | 16.0% |
| California: | 15.9% |


