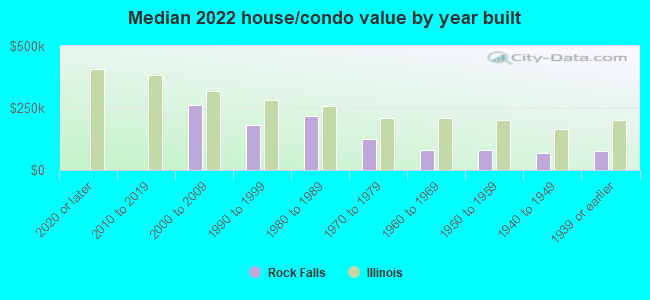
Rock Falls, IL (Illinois) Houses and Residents
| Rock Falls: | $87,655 |
| Illinois: | $251,600 |
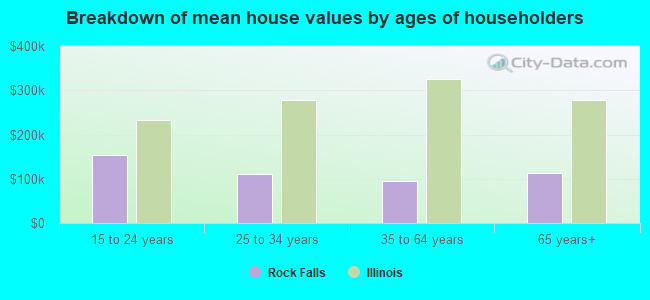
Mean price in 2022:
Detached houses: $111,387
Here: $111,387 State: $310,164 Townhouses or other attached units: $232,365
Here: $232,365 State: $286,230 In 2-unit structures: $133,730
Here: $133,730 State: $299,638 Mobile homes: $166,813
Here: $166,813 State: $78,855
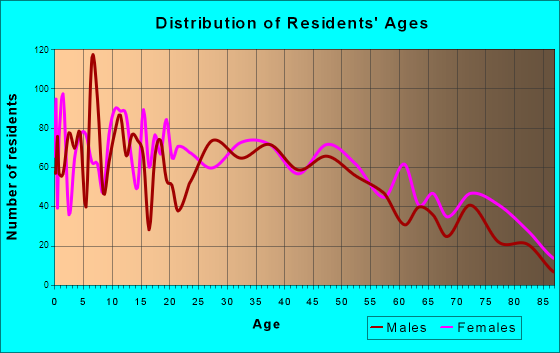
Total population: 9,062 (All urban)
Houses: 4,452 (3,987 occupied: 2,621 owner occupied, 1,417 renter occupied)
| % of renters here: | 35% |
| State: | 33% |
Housing density: 1,342 houses/condos per square mile
Median price asked for vacant for-sale houses and condos in 2022: $44,453.
Median contract rent in 2022: $552 (lower quartile is $445, upper quartile is $609)
Median rent asked for vacant for-rent units in 2022: $734
Median gross rent in Rock Falls, IL in 2022: $750
Housing units in Rock Falls with a mortgage: 1,630 (131 second mortgage, 0 home equity loan, 115 both second mortgage and home equity loan)
Houses without a mortgage: 55
Median household income for houses/condos with a mortgage: $59,421
Median household income for apartments without a mortgage: $49,707
Median monthly housing costs: $749
Compare current foreclosures in Rock Falls, IL:
| Photo | Address | Area | Beds / Baths | Price | Details |
|---|---|---|---|---|---|

|
#1
8th Ave
Rock Falls, IL 61071
|
1,248 sq. feet
|
2 baths 3 beds |
show details | |

|
#2
13th Ave
Rock Falls, IL 61071
|
1,197 sq. feet
|
1 baths 3 beds |
show details | |

|
#3
Ridge Rd
Rock Falls, IL 61071
|
1,609 sq. feet
|
1 baths 4 beds |
show details | |

|
#4
Minkel St
Rock Falls, IL 61071
|
1,266 sq. feet
|
1 baths 4 beds |
show details | |

|
#5
Avenue A
Rock Falls, IL 61071
|
2,208 sq. feet
|
2 baths 3 beds |
show details | |

|
#6
11th Ave
Rock Falls, IL 61071
|
1,088 sq. feet
|
1 baths 2 beds |
show details | |

|
#7
Blue Heron Rd
Rock Falls, IL 61071
|
- sq. feet
|
2 baths 3 beds |
show details | |

|
#8
Pine St
Rock Falls, IL 61071
|
- sq. feet
|
- baths - beds |
show details | |

|
#9
W 21st St
Rock Falls, IL 61071
|
- sq. feet
|
- baths - beds |
show details | |

|
#10
Summer St
Rock Falls, IL 61071
|
- sq. feet
|
- baths - beds |
show details |
| Photo | Address | Area | Beds / Baths | Price | Details |
|---|---|---|---|---|---|

|
#11
1/2 4th Ave
Rock Falls, IL 61071
|
- sq. feet
|
- baths - beds |
show details | |

|
#12
3rd Ave
Rock Falls, IL 61071
|
- sq. feet
|
- baths - beds |
show details | |

|
#13
W 7th St
Rock Falls, IL 61071
|
- sq. feet
|
- baths - beds |
show details | |

|
#14
Plautz Rd
Rock Falls, IL 61071
|
- sq. feet
|
- baths - beds |
show details | |

|
#15
9th Ave
Rock Falls, IL 61071
|
- sq. feet
|
- baths - beds |
show details | |

|
#16
Morris St
Rock Falls, IL 61071
|
- sq. feet
|
- baths - beds |
show details | |

|
#17
Garden Cir
Rock Falls, IL 61071
|
- sq. feet
|
- baths - beds |
show details | |

|
#18
11th Ave
Rock Falls, IL 61071
|
- sq. feet
|
- baths - beds |
show details | |

|
#19
E 5th St
Rock Falls, IL 61071
|
- sq. feet
|
- baths - beds |
show details | |

|
#20
W 20th St
Rock Falls, IL 61071
|
- sq. feet
|
- baths - beds |
show details |
| Photo | Address | Area | Beds / Baths | Price | Details |
|---|---|---|---|---|---|

|
#21
Riverdale Rd Lot 53
Rock Falls, IL 61071
|
- sq. feet
|
- baths - beds |
show details | |

|
#22
Leroy Ave
Rock Falls, IL 61071
|
- sq. feet
|
- baths - beds |
show details | |

|
#23
Haskell Ave
Rock Falls, IL 61071
|
- sq. feet
|
- baths - beds |
show details | |

|
#24
W 20th St
Rock Falls, IL 61071
|
- sq. feet
|
- baths - beds |
show details | |

|
#25
W 4th Street
Rock Falls, IL 61071
|
- sq. feet
|
- baths - beds |
show details | |

|
#26
Luther Rd
Rock Falls, IL 61071
|
- sq. feet
|
- baths - beds |
show details | |

|
#27
Sommers St
Rock Falls, IL 61071
|
- sq. feet
|
- baths - beds |
show details | |

|
#28
7th Ave
Rock Falls, IL 61071
|
- sq. feet
|
- baths - beds |
show details | |

|
#29
Bennett Dr
Rock Falls, IL 61071
|
- sq. feet
|
- baths - beds |
show details | |

|
#30
E 6th St
Rock Falls, IL 61071
|
- sq. feet
|
- baths - beds |
show details |
| Photo | Address | Area | Beds / Baths | Price | Details |
|---|---|---|---|---|---|

|
#31
Larson St
Rock Falls, IL 61071
|
- sq. feet
|
- baths - beds |
show details | |

|
#32
Lindy Ave
Rock Falls, IL 61071
|
- sq. feet
|
- baths - beds |
show details | |

|
#33
W 2nd St
Rock Falls, IL 61071
|
- sq. feet
|
- baths - beds |
show details | |

|
#34
Avenue D
Rock Falls, IL 61071
|
- sq. feet
|
- baths - beds |
show details | |

|
#35
6th Ave
Rock Falls, IL 61071
|
- sq. feet
|
- baths - beds |
show details | |

|
#36
Kauffman St
Rock Falls, IL 61071
|
- sq. feet
|
- baths - beds |
show details | |

|
#37
Buell Rd
Rock Falls, IL 61071
|
- sq. feet
|
- baths - beds |
show details | |

|
#38
French St
Rock Falls, IL 61071
|
- sq. feet
|
- baths - beds |
show details | |

|
#39
Martin Rd
Rock Falls, IL 61071
|
- sq. feet
|
- baths - beds |
show details | |

|
#40
E 11th St
Rock Falls, IL 61071
|
- sq. feet
|
- baths - beds |
show details |
| Photo | Address | Area | Beds / Baths | Price | Details |
|---|---|---|---|---|---|

|
#41
W 2nd St
Rock Falls, IL 61071
|
- sq. feet
|
- baths - beds |
show details | |

|
#42
Knief Rd
Rock Falls, IL 61071
|
- sq. feet
|
- baths - beds |
show details | |

|
#43
Star Rd
Rock Falls, IL 61071
|
- sq. feet
|
- baths - beds |
show details | |

|
#44
E 11th St
Rock Falls, IL 61071
|
- sq. feet
|
- baths - beds |
show details | |

|
#45
Hoover Rd
Rock Falls, IL 61071
|
- sq. feet
|
- baths - beds |
show details | |

|
#46
Riverdale Rd
Rock Falls, IL 61071
|
- sq. feet
|
- baths - beds |
show details | |

|
#47
Middle Rd
Rock Falls, IL 61071
|
- sq. feet
|
- baths - beds |
show details | |

|
#48
5th Ave
Rock Falls, IL 61071
|
- sq. feet
|
- baths - beds |
show details | |

|
#49
W 19th St
Rock Falls, IL 61071
|
- sq. feet
|
- baths - beds |
show details | |

|
Check over 1 million property listings on Foreclosure.com!
|
browse all offers | |||


 | Chicken Joint near Sterling IL (6 replies) |
| Rock Falls / Dixon / Sterling move - looking for jobs & housing (9 replies) |
| Moving from South Al to Illinois...Sterling, Rock Fall, or Morrision (5 replies) |
| Sterling/rock falls (73 replies) |
| Rock Falls Illinois (3 replies) |
| gay friendly rock falls sterling dixon? (38 replies) |
Median year apartment built: 1966
Household type by relationship:
Households: 8,781- Male householders: 1,937 (851 living alone), Female householders: 1,976 (736 living alone)
1,176 spouses (1,165 opposite-sex spouses), 448 unmarried partners, (448 opposite-sex unmarried partners), 2,482 children (2,362 natural, 6 adopted, 113 stepchildren), 164 grandchildren, 58 brothers or sisters, 113 parents, 0 foster children, 29 other relatives, 280 non-relatives
- In group quarters: 113
Size of family households: 830 2-persons, 446 3-persons, 413 4-persons, 368 5-persons, 19 6-persons.
Size of nonfamily households: 1,672 1-person, 216 2-persons, 64 3-persons, 4 4-persons.
819 married couples with children.
980 single-parent households (215 men, 765 women).
88.0% of residents of Rock Falls speak English at home.
11.3% of residents speak Spanish at home (87% speak English very well, 8% speak English well, 5% speak English not well).
0.1% of residents speak other Indo-European language at home (100% speak English very well).
0.3% of residents speak other language at home (41% speak English very well, 36% speak English well, 23% speak English not well).
Foreign born population: 327 (3.7%)
(50.5% of them are naturalized citizens)
| Here: | 5.8 |
| State: | 6.4 |
| Here: | 4.6 |
| State: | 4.1 |
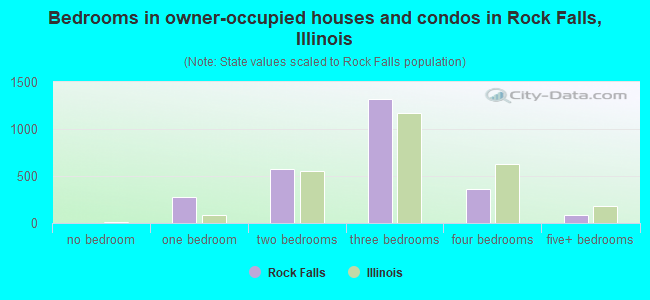
- Bedrooms in owner-occupied houses and condos in Rock Falls, Illinois
- 4no bedroom
- 2801 bedroom
- 5792 bedrooms
- 1,3153 bedrooms
- 3624 bedrooms
- 815+ bedrooms
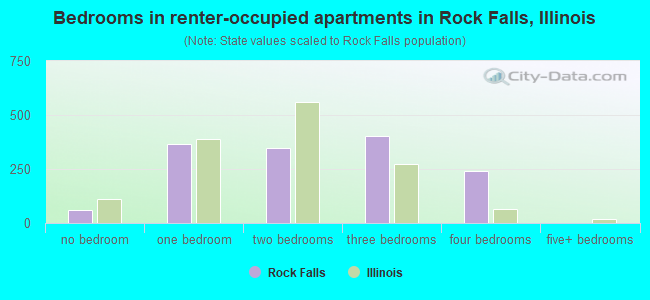
- Bedrooms in renter-occupied apartments in Rock Falls, Illinois
- 59no bedroom
- 3681 bedroom
- 3462 bedrooms
- 4043 bedrooms
- 2404 bedrooms
- 05+ bedrooms
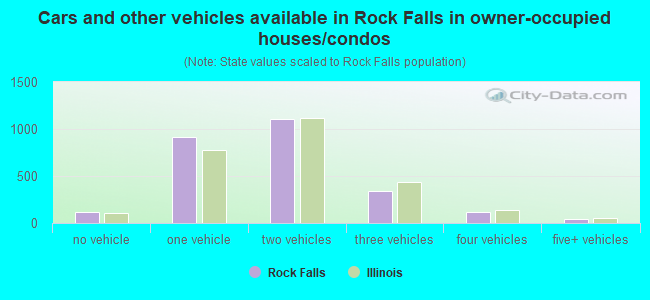
- Cars and other vehicles available in Rock Falls in owner-occupied houses/condos
- 112no vehicle
- 9101 vehicle
- 1,1052 vehicles
- 3383 vehicles
- 1194 vehicles
- 385+ vehicles
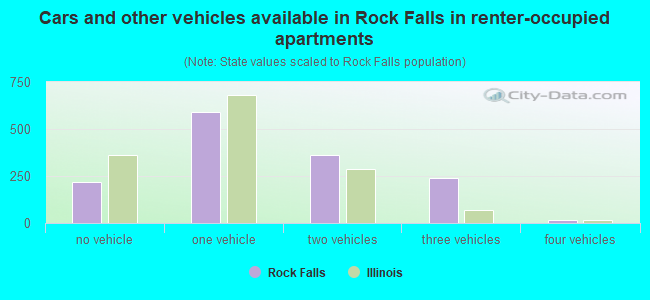
- Cars and other vehicles available in Rock Falls in renter-occupied apartments
- 216no vehicle
- 5891 vehicle
- 3602 vehicles
- 2383 vehicles
- 144 vehicles
- 05+ vehicles
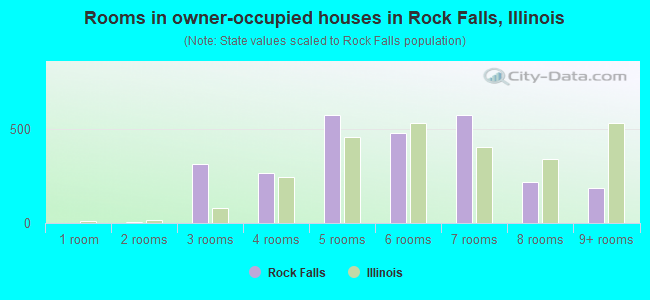
- Rooms in owner-occupied houses in Rock Falls, Illinois
- 01 room
- 42 rooms
- 3143 rooms
- 2674 rooms
- 5735 rooms
- 4796 rooms
- 5767 rooms
- 2208 rooms
- 1889+ rooms
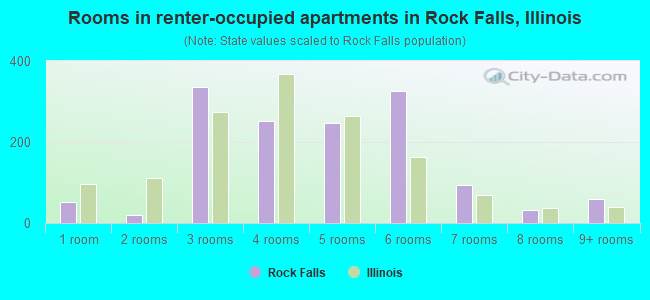
- Rooms in renter-occupied apartments in Rock Falls, Illinois
- 511 room
- 192 rooms
- 3373 rooms
- 2534 rooms
- 2465 rooms
- 3266 rooms
- 947 rooms
- 328 rooms
- 609+ rooms
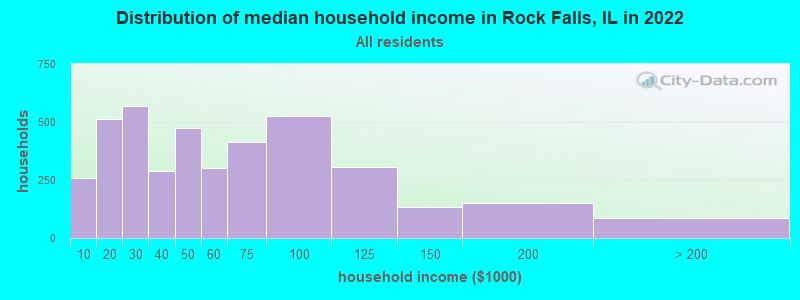
Rock Falls, IL household income distribution

- 260Less than $10,000
- 511$10,000 to $19,999
- 567$20,000 to $29,999
- 288$30,000 to $39,999
- 476$40,000 to $49,999
- 300$50,000 to $59,999
- 412$60,000 to $74,999
- 525$75,000 to $99,999
- 304$100,000 to $124,999
- 135$125,000 to $149,999
- 151$150,000 to $199,999
- 86$200,000 or more
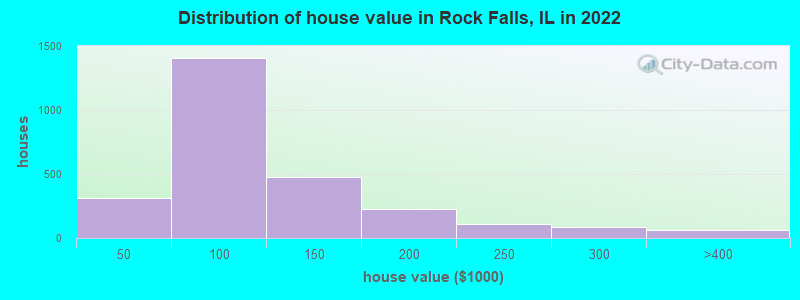
Home value of owner - occupied houses in 2022 in Rock Falls, IL
-
- 57Less than $10,000
- 20$10,000 to $14,999
- 10$20,000 to $24,999
- 9$25,000 to $29,999
- 95$30,000 to $34,999
- 26$35,000 to $39,999
- 89$40,000 to $49,999
- 143$50,000 to $59,999
- 443$60,000 to $69,999
- 385$70,000 to $79,999
- 222$80,000 to $89,999
- 119$90,000 to $99,999
- 318$100,000 to $124,999
- 156$125,000 to $149,999
- 168$150,000 to $174,999
- 61$175,000 to $199,999
- 108$200,000 to $249,999
- 85$250,000 to $299,999
- 46$300,000 to $399,999
- 20$400,000 to $499,999
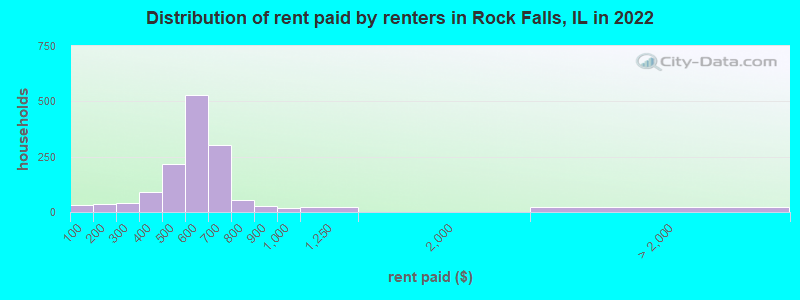
Rent paid by renters in 2022 in Rock Falls, IL
-
- 32Less than $100
- 24$100 to $149
- 9$150 to $199
- 19$200 to $249
- 22$250 to $299
- 28$300 to $349
- 61$350 to $399
- 168$400 to $449
- 49$450 to $499
- 274$500 to $549
- 256$550 to $599
- 208$600 to $649
- 95$650 to $699
- 9$700 to $749
- 44$750 to $799
- 24$800 to $899
- 18$900 to $999
- 21$1,000 to $1,249
- 23No cash rent
Percentage of workers working in this county: 69.9%
Number of people working at home: 224 (5.4% of all workers)
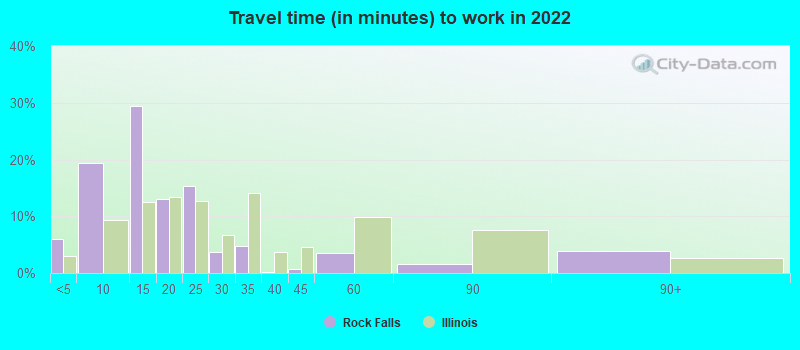
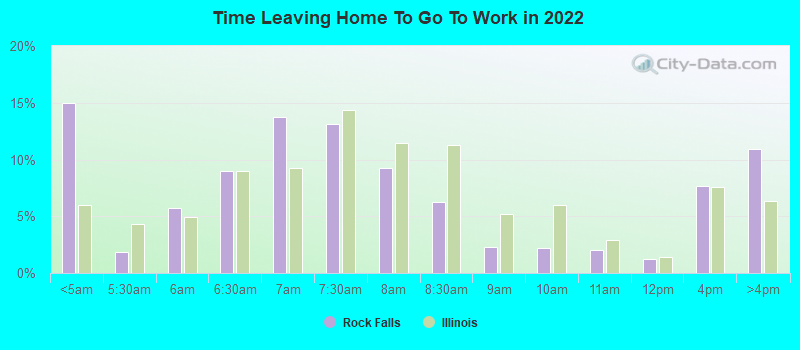
Travel time to work (commute)
- Less than 5 minutes: 189
- 5 to 9 minutes: 563
- 10 to 14 minutes: 1,354
- 15 to 19 minutes: 467
- 20 to 24 minutes: 668
- 25 to 29 minutes: 113
- 30 to 34 minutes: 136
- 35 to 39 minutes: 116
- 40 to 44 minutes: 8
- 45 to 59 minutes: 176
- 60 to 89 minutes: 33
- 90 or more minutes: 27
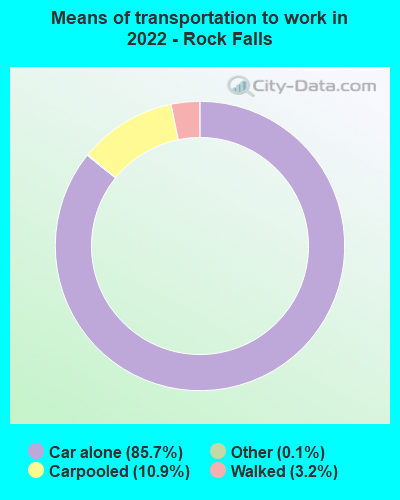
Means of transportation to work:
- Drove a car alone: 2,258 (77.6%)
- Carpooled: 307 (10.6%)
- Bus: 1 (0.0%)
- Taxi: 4 (0.1%)
- Walked: 85 (2.9%)
- Worked at home: 224 (7.7%)
- Unemployment by race in 2022
- Unemployment rate for White non-Hispanic residents
- 2.5%Males
- 3.4%Females
- Unemployment rate for Black residents
- 100.0%Females
- Unemployment rate for other race residents
- 13.6%Males
- Unemployment rate for two or more race residents
- 6.1%Males
- 4.4%Females
- Unemployment rate for Hispanic or Latino residents
- 8.0%Males
- 1.7%Females
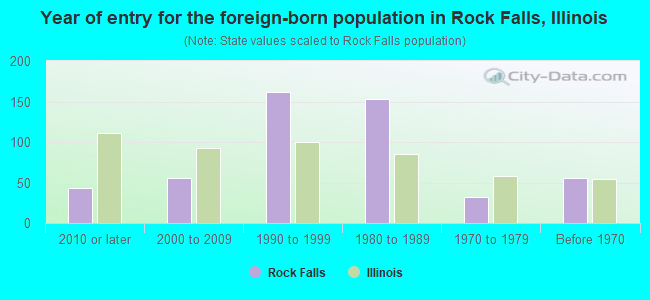
- Year of entry for the foreign-born population in Rock Falls, Illinois
- 432010 or later
- 552000 to 2009
- 1621990 to 1999
- 1531980 to 1989
- 321970 to 1979
- 55Before 1970
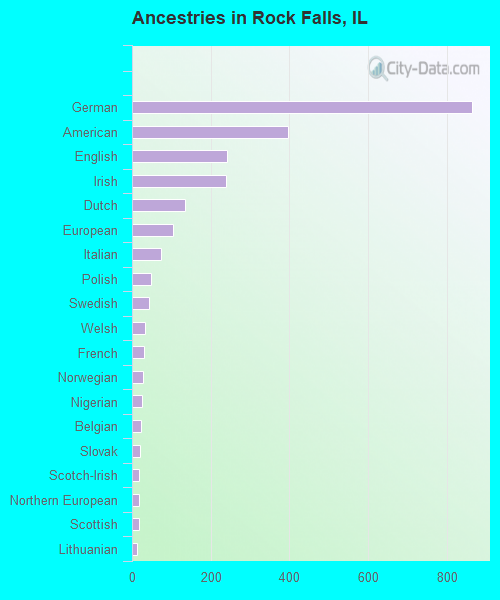
First ancestries reported:
- German: 864 (24.1%)
- American: 396 (11.1%)
- English: 241 (6.7%)
- Irish: 239 (6.7%)
- Dutch: 135 (3.8%)
- European: 104 (2.9%)
- Italian: 74 (2.1%)
- Polish: 48 (1.3%)
- Swedish: 44 (1.2%)
- Welsh: 32 (0.9%)
- French: 30 (0.8%)
- Norwegian: 28 (0.8%)
- Nigerian: 26 (0.7%)
- Belgian: 24 (0.7%)
- Slovak: 21 (0.6%)
- Scotch-Irish: 18 (0.5%)
- Northern European: 17 (0.5%)
- Scottish: 17 (0.5%)
- Lithuanian: 13 (0.4%)
- Pennsylvania German: 7 (0.2%)
- British: 6 (0.2%)
- Romanian: 4 (0.1%)
- African: 1 (0.03%)
Most common places of birth for foreign-born residents (%):
| Rock Falls: | 87.5% (286) |
| Illinois: | 34.7% (626,958) |
| Rock Falls: | 8.0% (26) |
| Illinois: | 1.2% (21,186) |
| Rock Falls: | 3.1% (10) |
| Illinois: | 1.1% (19,306) |
Place of birth for U.S.-born residents:
- This state: 7,315
- Other state: 1,062
- Northeast: 68
- Midwest: 575
- South: 296
- West: 120
88.9% of Rock Falls residents lived in the same house 1 years ago.
Out of people who lived in different houses, 37.9% lived in this county.
Out of people who lived in different counties, 87.4% lived in Illinois.
| Rock Falls: | 88.9% |
| State average: | 88.3% |
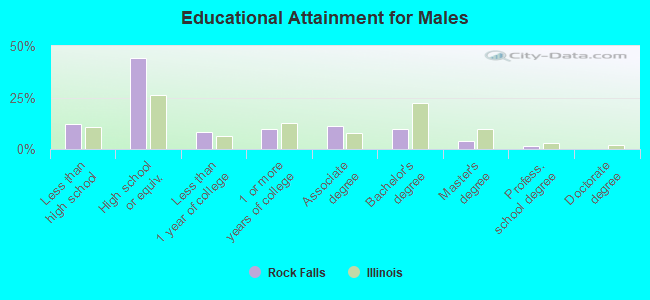
Education attainment for males 25 years and older:
- No schooling: 30
- Nursery to 4th grade: 15
- 5th and 6th grade: 66
- 7th and 8th grade: 22
- 9th grade: 57
- 10th grade: 22
- 11th grade: 48
- 12th grade, no diploma: 86
- High school graduate (or equivalency): 1,252
- Less than 1 year of college: 238
- Some college more than 1 year, no degree: 269
- Associate degree: 311
- Bachelor's degree: 269
- Master's degree: 109
- Professional school degree: 43
- Doctorate degree: 0
Education attainment for females 25 years and older:
- No schooling: 27
- Nursery to 4th grade: 43
- 5th and 6th grade: 16
- 7th and 8th grade: 29
- 9th grade: 97
- 10th grade: 95
- 11th grade: 14
- 12th grade, no diploma: 85
- High school graduate (or equivalency): 1,045
- Less than 1 year of college: 314
- Some college more than 1 year, no degree: 421
- Associate degree: 385
- Bachelor's degree: 304
- Master's degree: 146
- Professional school degree: 0
- Doctorate degree: 0

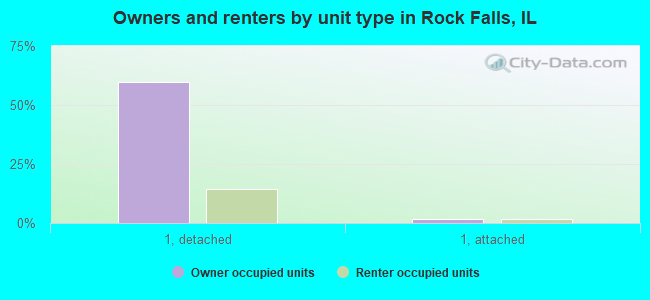
Housing units in structures:
- One, detached: 3,482
- One, attached: 40
- Two: 96
- 3 or 4: 342
- 5 to 9: 156
- 10 to 19: 62
- 20 to 49: 61
- 50 or more: 135
- Mobile homes: 75
Housing units lacking complete kitchen facilities in 2022: 2.1%
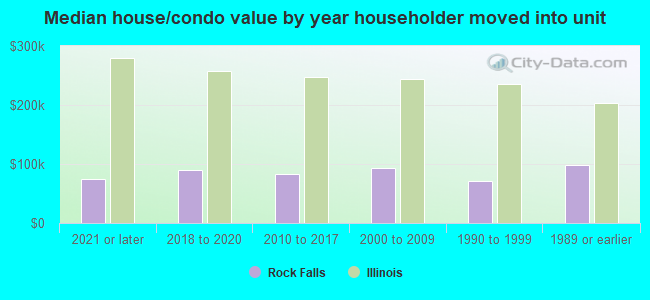
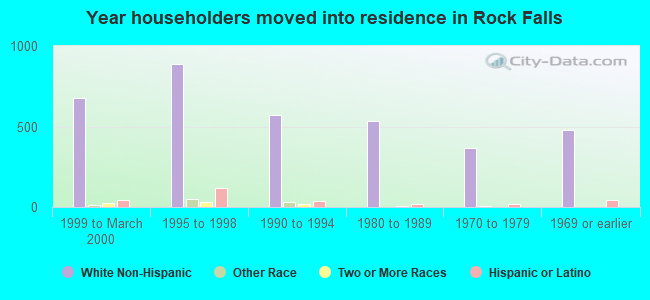
House/condo owner moved in on average 12 years ago
Renter moved in on average 3 years ago
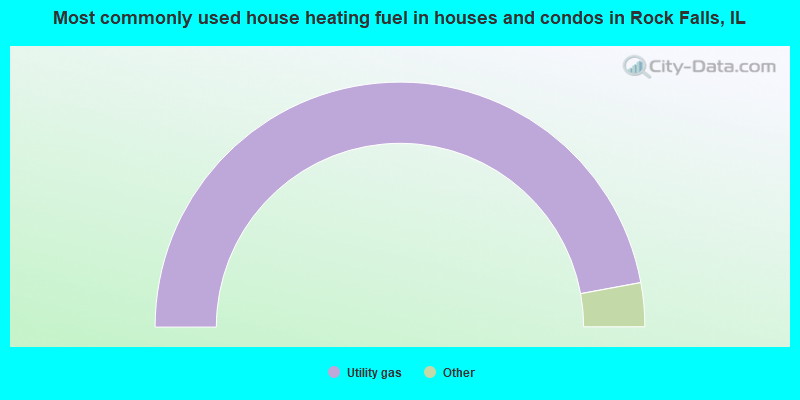
- 94.3%Utility gas
- 3.1%Bottled, tank, or LP gas
- 2.1%Electricity
- 0.5%Fuel oil, kerosene, etc.
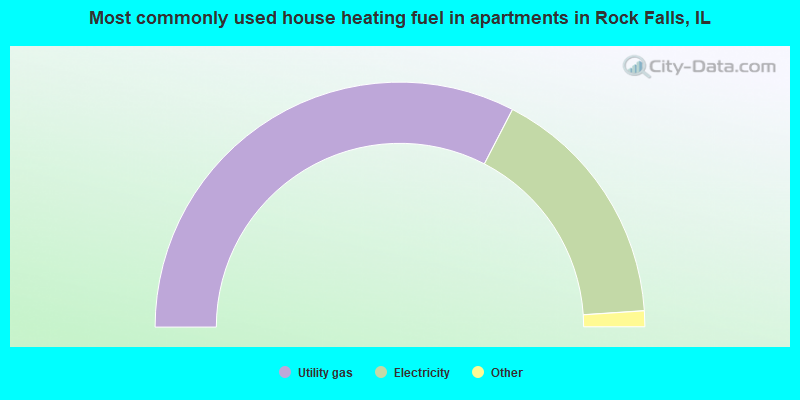
- 65.2%Utility gas
- 32.7%Electricity
- 1.4%Bottled, tank, or LP gas
- 0.7%Other fuel
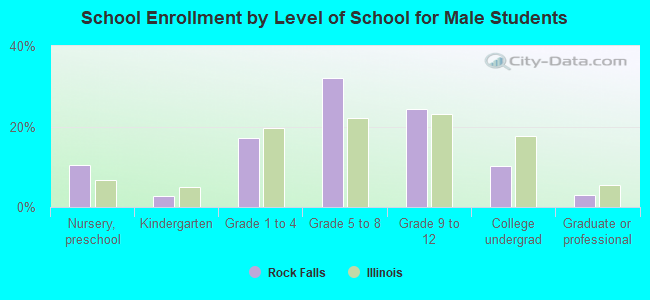
Private vs. public school enrollment:
| Here: | 2.3% |
| Illinois: | 13.3% |
| Here: | 0.0% |
| Illinois: | 9.9% |
| Here: | 4.8% |
| Illinois: | 27.4% |