Renton, WA (Washington) Houses and Residents
Estimated median house or condo value in 2022: $646,000 (it was $172,800 in 2000 )
Renton:
$646,000Washington:
$569,500
Lower value quartile - upper value quartile: $431,900 - $908,600Mean price in 2022: Detached houses: $753,729 Here:
$753,729State:
$734,307
Townhouses or other attached units: $611,269 Here:
$611,269State:
$657,697
In 2-unit structures: $536,211 Here:
$536,211State:
$534,634
In 3-to-4-unit structures: $339,996 Here:
$339,996State:
$510,239
In 5-or-more-unit structures: $305,238 Here:
$305,238State:
$503,183
Mobile homes: $235,501 Here:
$235,501State:
$218,362
Total population: 98,404 (Urban population: 49,868, Rural population: 26 (all nonfarm) )
Houses: 43,673 (42,485 occupied: 24,463 owner occupied, 18,022 renter occupied )
% of renters here:
42%State:
36%
Housing density: 2,565 houses/condos per square mile
Median price asked for vacant for-sale houses and condos in 2022: $564,306.
Median contract rent in 2022: $1,766 (lower quartile is $1,350, upper quartile is over $2,000)
Median rent asked for vacant for-rent units in 2022: $1,598
Median gross rent in Renton, WA in 2022: $1,880
Housing units in Renton with a mortgage: 16,614 (1,287 second mortgage, 55 home equity loan, 1,024 both second mortgage and home equity loan )Houses without a mortgage: 488
Median household income for houses/condos with a mortgage: $129,649
Median household income for apartments without a mortgage: $81,278
Median monthly housing costs: $1,829
Data:
Median house or condo value ($)
Median house or condo value ($ change since 2000)
Median house or condo value ($) - White
Median house or condo value ($) - Black or African American
Median house or condo value ($) - Asian
Median house or condo value ($) - Hispanic or Latino
Median house or condo value ($) - American Indian and Alaska Native
Median house or condo value ($) - Multirace
Median house or condo value ($) - Other Race
Median price asked for mobile homes ($)
Household density (households per square mile)
Mean house or condo value by units in structure - 1, detached ($)
Mean house or condo value by units in structure - 1, attached ($)
Mean house or condo value by units in structure - 2 ($)
Mean house or condo value by units in structure by units in structure - 3 or 4 ($)
Mean house or condo value by units in structure - 5 or more ($)
Mean house or condo value by units in structure - Boat, RV, van, etc. ($)
Mean house or condo value by units in structure - Mobile home ($)
Median contract rent ($)
Median contract rent - Lower quartile ($)
Median contract rent - Upper quartile ($)
Median gross rent ($)
Urban houses (%)
Rural houses (%)
Houses occupied (%)
Houses occupied (% change since 2000)
Houses owner occupied (%)
Houses owner occupied (% change since 2000)
Houses renter occupied (%)
Houses renter occupied (% change since 2000)
Vacant housing units - For rent (%)
Vacant housing units - For rent (% change since 2000)
Vacant housing units - For sale only (%)
Vacant housing units - For sale only (% change since 2000)
Vacant housing units - Rented or sold, not occupied (%)
Vacant housing units - Rented or sold, not occupied (% change since 2000)
Vacant housing units - For seasonal, recreational, or occasional use (%)
Vacant housing units - For seasonal, recreational, or occasional use (% change since 2000)
Vacant housing units - For migrant workers (%)
Vacant housing units - For migrant workers (% change since 2000)
Vacant housing units - Other vacant (%)
Vacant housing units - Other vacant (% change since 2000)
Median monthly housing costs ($)
Median household income for houses/condos with a mortgage ($)
Median household income for houses/condos without a mortgage ($)
Median household income ($)
Median household income ($) - White
Median household income ($) - Black or African American
Median household income ($) - Asian
Median household income ($) - Hispanic or Latino
Median household income ($) - American Indian and Alaska Native
Median household income ($) - Multirace
Median household income ($) - Other Race
Mortgage status - with mortgage (%)
Mortgage status - with second mortgage (%)
Mortgage status - with home equity loan (%)
Mortgage status - with both second mortgage and home equity loan (%)
Mortgage status - without a mortgage (%)
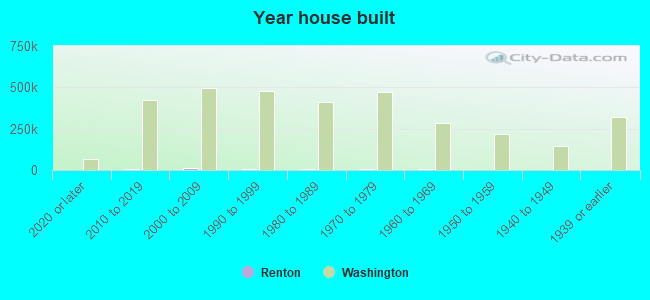
Median year house/condo built
Median year apartment built
Household type by relationship - Male householder living alone (%)
Household type by relationship - Male householder not living alone (%)
Household type by relationship - Female householder living alone (%)
Household type by relationship - Female householder not living alone (%)
Household type by relationship - Opposite-Sex spouse (%)
Household type by relationship - Same-Sex spouse (%)
Household type by relationship - Opposite-Sex unmarried partner (%)
Household type by relationship - Same-Sex unmarried partner (%)
Household type by relationship - In group quarters (%)
Size of family households - 2-person household (%)
Size of family households - 3-person household (%)
Size of family households - 4-person household (%)
Size of family households - 5-person household (%)
Size of family households - 6-person household (%)
Size of family households - 7-or-more-person household (%)
Size of nonfamily households - 1-person household (%)
Size of nonfamily households - 2-person household (%)
Size of nonfamily households - 3-person household (%)
Size of nonfamily households - 4-person household (%)
Size of nonfamily households - 5-person household (%)
Size of nonfamily households - 6-person household (%)
Size of nonfamily households - 7-or-moreperson household (%)
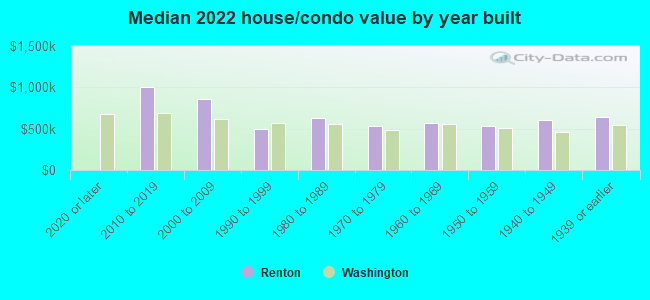
Year house built - Built 2010 or later (%)
Year house built - Built 2000 to 2009 (%)
Year house built - Built 1990 to 1999 (%)
Year house built - Built 1980 to 1989 (%)
Year house built - Built 1970 to 1979 (%)
Year house built - Built 1960 to 1969 (%)
Year house built - Built 1950 to 1959 (%)
Year house built - Built 1940 to 1949 (%)
Year house built - Built 1939 or earlier (%)
Median number of rooms in houses and condos
Median number of rooms in apartments
Median number of bedrooms in owner occupied houses
Mean number of bedrooms in owner occupied houses
Median number of bedrooms in renter occupied houses
Mean number of bedrooms in renter occupied houses
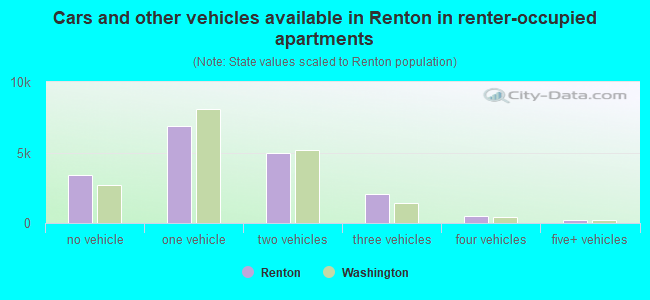
Median number of vehichles in owner occupied houses
Mean number of vehichles in owner occupied houses
Median number of vehichles in renter occupied houses
Mean number of vehichles in renter occupied houses
Rooms in owner-occupied houses - 1 room (%)
Rooms in owner-occupied houses - 2 rooms (%)
Rooms in owner-occupied houses - 3 rooms (%)
Rooms in owner-occupied houses - 4 rooms (%)
Rooms in owner-occupied houses - 5 rooms (%)
Rooms in owner-occupied houses - 6 rooms (%)
Rooms in owner-occupied houses - 7 rooms (%)
Rooms in owner-occupied houses - 8 rooms (%)
Rooms in owner-occupied houses - 9+ rooms (%)
Rooms in renter-occupied houses - 1 room (%)
Rooms in renter-occupied houses - 2 rooms (%)
Rooms in renter-occupied houses - 3 rooms (%)
Rooms in renter-occupied houses - 4 rooms (%)
Rooms in renter-occupied houses - 5 rooms (%)
Rooms in renter-occupied houses - 6 rooms (%)
Rooms in renter-occupied houses - 7 rooms (%)
Rooms in renter-occupied houses - 8 rooms (%)
Rooms in renter-occupied houses - 9+ rooms (%)
Bedrooms in owner-occupied houses - no bedrooms (%)
Bedrooms in owner-occupied houses - 1 bedroom (%)
Bedrooms in owner-occupied houses - 2 bedrooms (%)
Bedrooms in owner-occupied houses - 3 bedrooms (%)
Bedrooms in owner-occupied houses - 4 bedrooms (%)
Bedrooms in owner-occupied houses - 5+ bedrooms (%)
Bedrooms in renter-occupied houses - no bedrooms (%)
Bedrooms in renter-occupied houses - 1 bedroom (%)
Bedrooms in renter-occupied houses - 2 bedrooms (%)
Bedrooms in renter-occupied houses - 3 bedrooms (%)
Bedrooms in renter-occupied houses - 4 bedrooms (%)
Bedrooms in renter-occupied houses - 5+ bedrooms (%)
Vehicles available in owner-occupied houses - no vehicle available (%)
Vehicles available in owner-occupied houses - 1 vehicle available(%)
Vehicles available in owner-occupied houses - 2 Vehicles available (%)
Vehicles available in owner-occupied houses - 3 Vehicles available (%)
Vehicles available in owner-occupied houses - 4 Vehicles available (%)
Vehicles available in owner-occupied houses - 5+ Vehicles available (%)
Vehicles available in renter-occupied houses - no vehicle available (%)
Vehicles available in renter-occupied houses - 1 vehicle available (%)
Vehicles available in renter-occupied houses - 2 Vehicles available (%)
Vehicles available in renter-occupied houses - 3 Vehicles available (%)
Vehicles available in renter-occupied houses - 4 Vehicles available (%)
Vehicles available in renter-occupied houses - 5+ Vehicles available (%)
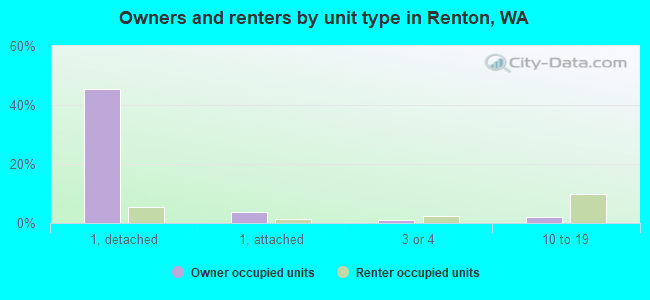
Housing units in structures - 1, detached (%)
Housing units in structures - 1, attached (%)
Housing units in structures - 2 (%)
Housing units in structures - 3 or 4 (%)
Housing units in structures - 5 to 9 (%)
Housing units in structures - 10 to 19 (%)
Housing units in structures - 20 to 49 (%)
Housing units in structures - 50 or more (%)
Housing units in structures - Mobile home (%)
Housing units in structures - Boat, RV, van, etc. (%)
Housing units in structures - Owners - 1, detached (%)
Housing units in structures - Owners - 1, attached (%)
Housing units in structures - Owners - 2 (%)
Housing units in structures - Owners - 3 or 4 (%)
Housing units in structures - Owners - 5 to 9 (%)
Housing units in structures - Owners - 10 to 19 (%)
Housing units in structures - Owners - 20 to 49 (%)
Housing units in structures - Owners - 50 or more (%)
Housing units in structures - Owners - Mobile home (%)
Housing units in structures - Owners - Boat, RV, van, etc. (%)
Housing units in structures - Renters - 1, detached (%)
Housing units in structures - Renters - 1, attached (%)
Housing units in structures - Renters - 2 (%)
Housing units in structures - Renters - 3 or 4 (%)
Housing units in structures - Renters - 5 to 9 (%)
Housing units in structures - Renters - 10 to 19 (%)
Housing units in structures - Renters - 20 to 49 (%)
Housing units in structures - Renters - 50 or more (%)
Housing units in structures - Renters - Mobile home (%)
Housing units in structures - Renters - Boat, RV, van, etc. (%)
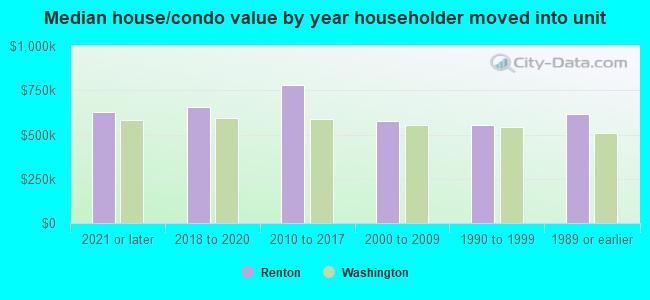
House/condo owner moved in on average (years ago)
Renter moved in on average (years ago)
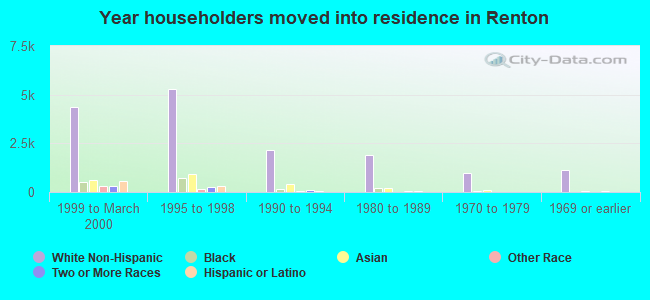
Year householder moved into unit - Moved in 1999 to March 2000 (%)
Year householder moved into unit - Moved in 1999 to March 2000 (%) - White
Year householder moved into unit - Moved in 1999 to March 2000 (%) - Black or African American
Year householder moved into unit - Moved in 1999 to March 2000 (%) - Asian
Year householder moved into unit - Moved in 1999 to March 2000 (%) - Hispanic or Latino
Year householder moved into unit - Moved in 1999 to March 2000 (%) - American Indian and Alaska Native
Year householder moved into unit - Moved in 1999 to March 2000 (%) - Multirace
Year householder moved into unit - Moved in 1999 to March 2000 (%) - Other Race
Year householder moved into unit - Moved in 1995 to 1998 (%)
Year householder moved into unit - Moved in 1995 to 1998 (%) - White
Year householder moved into unit - Moved in 1995 to 1998 (%) - Black or African American
Year householder moved into unit - Moved in 1995 to 1998 (%) - Asian
Year householder moved into unit - Moved in 1995 to 1998 (%) - Hispanic or Latino
Year householder moved into unit - Moved in 1995 to 1998 (%) - American Indian and Alaska Native
Year householder moved into unit - Moved in 1995 to 1998 (%) - Multirace
Year householder moved into unit - Moved in 1995 to 1998 (%) - Other Race
Year householder moved into unit - Moved in 1990 to 1994 (%)
Year householder moved into unit - Moved in 1990 to 1994 (%) - White
Year householder moved into unit - Moved in 1990 to 1994 (%) - Black or African American
Year householder moved into unit - Moved in 1990 to 1994 (%) - Asian
Year householder moved into unit - Moved in 1990 to 1994 (%) - Hispanic or Latino
Year householder moved into unit - Moved in 1990 to 1994 (%) - American Indian and Alaska Native
Year householder moved into unit - Moved in 1990 to 1994 (%) - Multirace
Year householder moved into unit - Moved in 1990 to 1994 (%) - Other Race
Year householder moved into unit - Moved in 1980 to 1989 (%)
Year householder moved into unit - Moved in 1980 to 1989 (%) - White
Year householder moved into unit - Moved in 1980 to 1989 (%) - Black or African American
Year householder moved into unit - Moved in 1980 to 1989 (%) - Asian
Year householder moved into unit - Moved in 1980 to 1989 (%) - Hispanic or Latino
Year householder moved into unit - Moved in 1980 to 1989 (%) - American Indian and Alaska Native
Year householder moved into unit - Moved in 1980 to 1989 (%) - Multirace
Year householder moved into unit - Moved in 1980 to 1989 (%) - Other Race
Year householder moved into unit - Moved in 1970 to 1979 (%)
Year householder moved into unit - Moved in 1970 to 1979 (%) - White
Year householder moved into unit - Moved in 1970 to 1979 (%) - Black or African American
Year householder moved into unit - Moved in 1970 to 1979 (%) - Asian
Year householder moved into unit - Moved in 1970 to 1979 (%) - Hispanic or Latino
Year householder moved into unit - Moved in 1970 to 1979 (%) - American Indian and Alaska Native
Year householder moved into unit - Moved in 1970 to 1979 (%) - Multirace
Year householder moved into unit - Moved in 1970 to 1979 (%) - Other Race
Year householder moved into unit - Moved in 1969 or earlier (%)
Year householder moved into unit - Moved in 1969 or earlier (%) - White
Year householder moved into unit - Moved in 1969 or earlier (%) - Black or African American
Year householder moved into unit - Moved in 1969 or earlier (%) - Asian
Year householder moved into unit - Moved in 1969 or earlier (%) - Hispanic or Latino
Year householder moved into unit - Moved in 1969 or earlier (%) - American Indian and Alaska Native
Year householder moved into unit - Moved in 1969 or earlier (%) - Multirace
Year householder moved into unit - Moved in 1969 or earlier (%) - Other Race
Housing units lacking complete plumbing facilities (%)
Housing units lacking complete kitchen facilities (%)
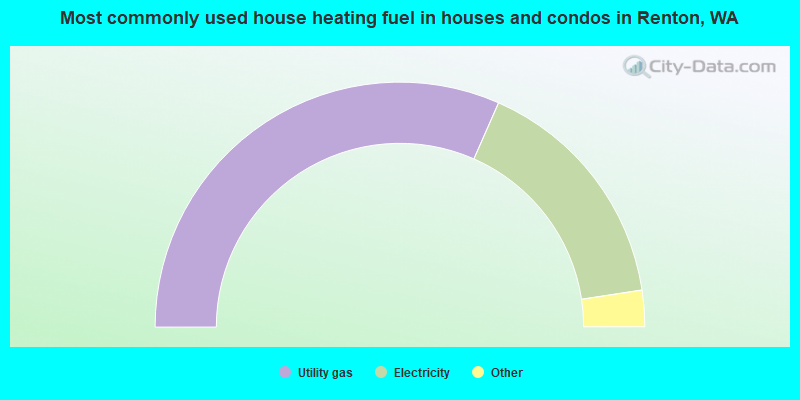
House heating fuel used in houses and condos - Utility gas (%)
House heating fuel used in houses and condos - Bottled, tank, or LP gas (%)
House heating fuel used in houses and condos - Electricity (%)
House heating fuel used in houses and condos - Fuel oil, kerosene, etc. (%)
House heating fuel used in houses and condos - Coal or coke (%)
House heating fuel used in houses and condos - Wood (%)
House heating fuel used in houses and condos - Solar energy (%)
House heating fuel used in houses and condos - Other fuel (%)
House heating fuel used in houses and condos - No fuel used (%)
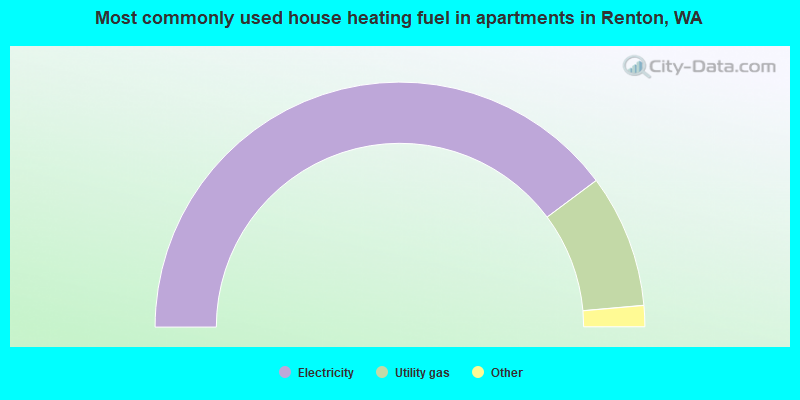
House heating fuel used in apartments - Utility gas (%)
House heating fuel used in apartments - Bottled, tank, or LP gas (%)
House heating fuel used in apartments - Electricity (%)
House heating fuel used in apartments - Fuel oil, kerosene, etc. (%)
House heating fuel used in apartments - Coal or coke (%)
House heating fuel used in apartments - Wood (%)
House heating fuel used in apartments - Solar energy (%)
House heating fuel used in apartments - Other fuel (%)
House heating fuel used in apartments - No fuel used (%)
Latest news about housing in Renton, WA collected exclusively by city-data.com from local newspapers, TV, and radio stations
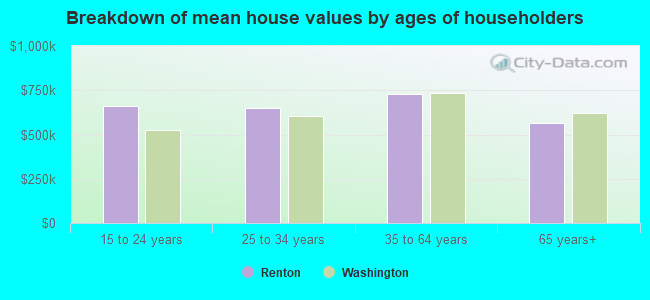
Median year house/condo built: 1990Median year apartment built: 1992Household type by relationship:
Households: 104,060
Male householders: 24,214 (7,646 living alone ), Female householders: 18,271 (6,845 living alone )17,942 spouses (17,813 opposite-sex spouses ), 3,218 unmarried partners , (2,831 opposite-sex unmarried partners ), 25,405 children (24,554 natural , 542 adopted , 309 stepchildren ), 1,104 grandchildren , 2,215 brothers or sisters , 3,495 parents , 72 foster children , 2,515 other relatives , 4,578 non-relatives In group quarters: 1,031
Size of family households: 9,394 2-persons , 5,474 3-persons , 4,967 4-persons , 2,263 5-persons , 856 6-persons , 795 7-or-more-persons .
Size of nonfamily households: 14,491 1-person , 3,282 2-persons , 710 3-persons , 253 4-persons .
12,448 married couples with children. single-parent households (414 men , 2,350 women ).
58.6% of residents of Renton speak English at home. of residents speak Spanish at home (59% speak English very well , 17% speak English well , 14% speak English not well , 9% don't speak English at all ).of residents speak other Indo-European language at home (56% speak English very well , 22% speak English well , 19% speak English not well , 4% don't speak English at all ).of residents speak Asian or Pacific Island language at home (47% speak English very well , 29% speak English well , 17% speak English not well , 7% don't speak English at all ).of residents speak other language at home (68% speak English very well , 25% speak English well , 7% speak English not well ).
Foreign born population: 33,733 (32.4%)of them are naturalized citizens )
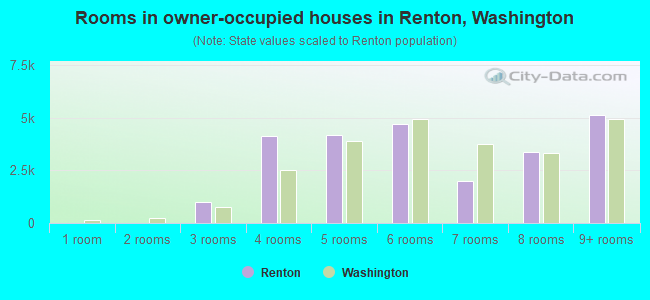
Median number of rooms in houses and condos:
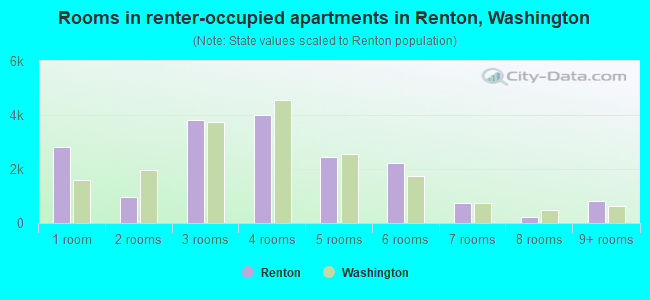
Median number of rooms in apartments
Owner-occupied Renter-occupied
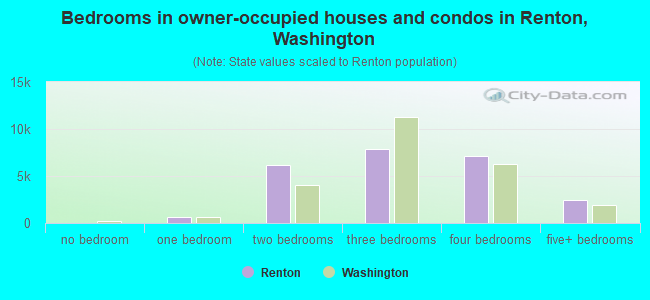
Bedrooms in owner-occupied houses and condos in Renton, Washington
0 no bedroom 659 1 bedroom 6,214 2 bedrooms 7,917 3 bedrooms 7,173 4 bedrooms 2,500 5+ bedrooms
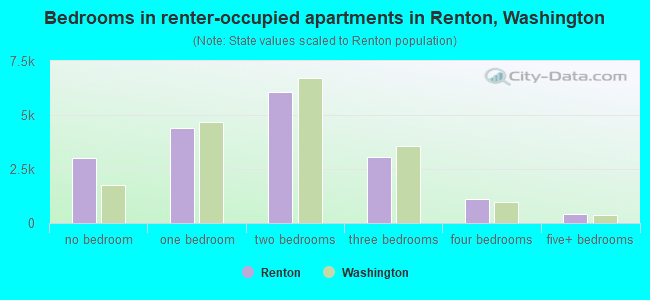
Bedrooms in renter-occupied apartments in Renton, Washington
2,997 no bedroom 4,402 1 bedroom 6,051 2 bedrooms 3,068 3 bedrooms 1,089 4 bedrooms 415 5+ bedrooms
Owner-occupied Renter-occupied
Rooms in owner-occupied houses in Renton, Washington
0 1 room 0 2 rooms 996 3 rooms 4,109 4 rooms 4,186 5 rooms 4,682 6 rooms 1,988 7 rooms 3,380 8 rooms 5,122 9+ rooms
Rooms in renter-occupied apartments in Renton, Washington
2,818 1 room 981 2 rooms 3,797 3 rooms 3,984 4 rooms 2,447 5 rooms 2,221 6 rooms 731 7 rooms 240 8 rooms 803 9+ rooms
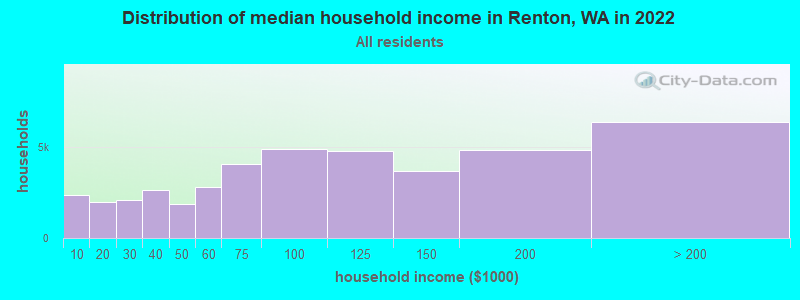
Renton, WA household income distribution 2,353 Less than $10,0002,011 $10,000 to $19,9992,096 $20,000 to $29,9992,619 $30,000 to $39,9991,895 $40,000 to $49,9992,815 $50,000 to $59,9994,083 $60,000 to $74,9994,887 $75,000 to $99,9994,799 $100,000 to $124,9993,704 $125,000 to $149,9994,831 $150,000 to $199,9996,392 $200,000 or more
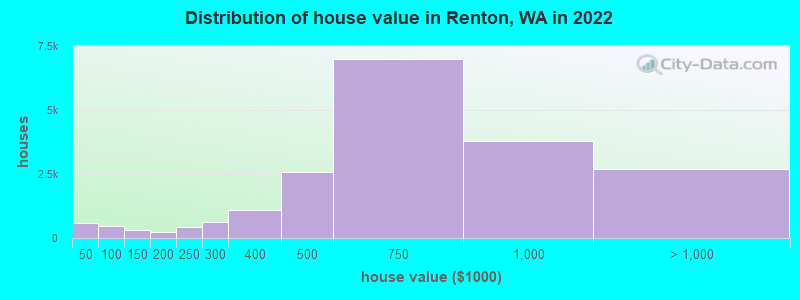
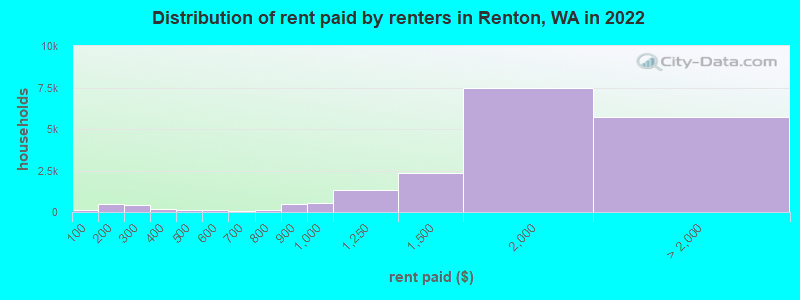
Home value of owner - occupied houses in 2022 in Renton, WA 341 Less than $10,00064 $10,000 to $14,99920 $15,000 to $19,99922 $20,000 to $24,99915 $30,000 to $34,99948 $35,000 to $39,99976 $40,000 to $49,999112 $50,000 to $59,999141 $60,000 to $69,99971 $70,000 to $79,99945 $80,000 to $89,99929 $90,000 to $99,999286 $100,000 to $124,9998 $125,000 to $149,999157 $150,000 to $174,99990 $175,000 to $199,999438 $200,000 to $249,999620 $250,000 to $299,9991,093 $300,000 to $399,9992,559 $400,000 to $499,9996,984 $500,000 to $749,9993,777 $750,000 to $999,9991,881 $1,000,000 to $1,499,999353 $1,500,000 to $1,999,999441 $2,000,000 or moreRent paid by renters in 2022 in Renton, WA 103 Less than $10085 $100 to $149388 $150 to $199303 $200 to $24990 $250 to $29972 $300 to $349123 $350 to $39972 $400 to $44932 $450 to $49987 $500 to $54929 $550 to $59913 $600 to $64933 $650 to $699120 $750 to $799511 $800 to $899522 $900 to $9991,331 $1,000 to $1,2492,336 $1,250 to $1,4997,486 $1,500 to $1,9993,215 $2,000 to $2,4991,467 $2,500 to $2,999446 $3,000 to $3,499327 $3,500 or more278 No cash rent
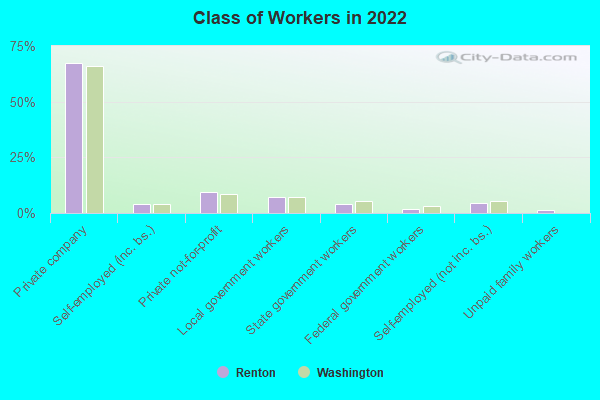
Percentage of workers working in this county: 93.2%Number of people working at home: 13,009 (22.5% of all workers )
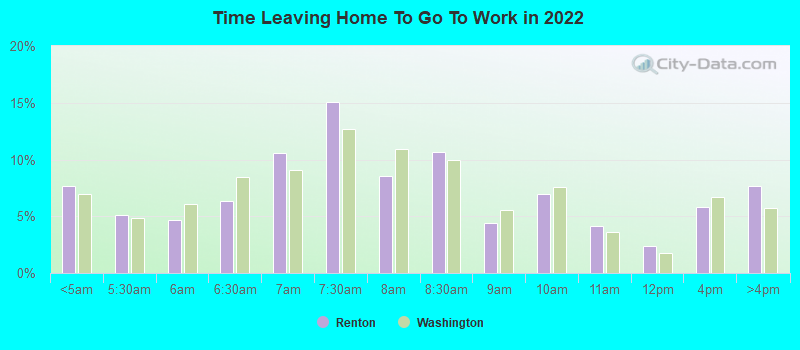
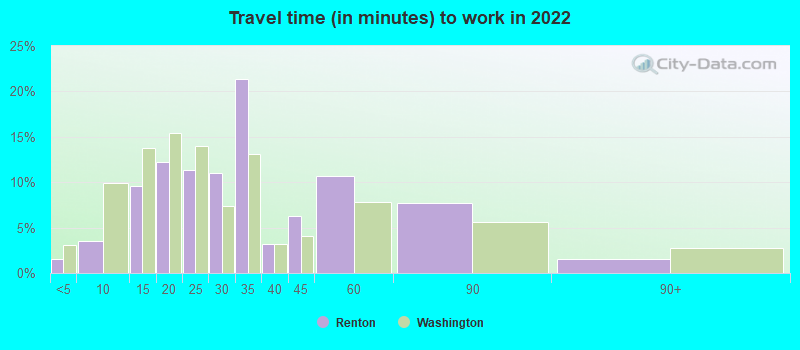
Travel time to work (commute)
Less than 5 minutes: 1,0145 to 9 minutes: 1,67110 to 14 minutes: 3,65015 to 19 minutes: 5,30120 to 24 minutes: 7,28525 to 29 minutes: 3,06630 to 34 minutes: 8,48535 to 39 minutes: 2,09840 to 44 minutes: 2,72345 to 59 minutes: 4,83960 to 89 minutes: 2,45490 or more minutes: 1,100
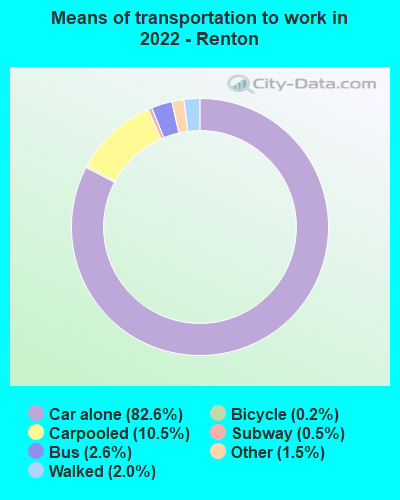
Means of transportation to work:
Drove a car alone: 43,868 (67.7%)Carpooled: 5,347 (8.2%)Bus : 838 (1.3%)Long-distance train or commuter rail : 132 (0.2%)Light rail, streetcar or trolley : 10 (0.0%)Ferryboat: 28 (0.0%)Taxi: 728 (1.1%)Bicycle: 108 (0.2%)Walked: 956 (1.5%)Worked at home: 13,009 (20.1%)
Unemployment by race in 2022
Unemployment rate for White non-Hispanic residents 3.5% Males2.5% FemalesUnemployment rate for Black residents 8.4% Males4.2% FemalesUnemployment rate for American Indian and Alaska Native residents 2.9% Males11.6% FemalesUnemployment rate for Asian residents 1.3% Males7.0% FemalesUnemployment rate for other race residents 1.2% Males9.3% FemalesUnemployment rate for two or more race residents 3.7% Males4.2% FemalesUnemployment rate for Hispanic or Latino residents 1.4% Males6.7% Females
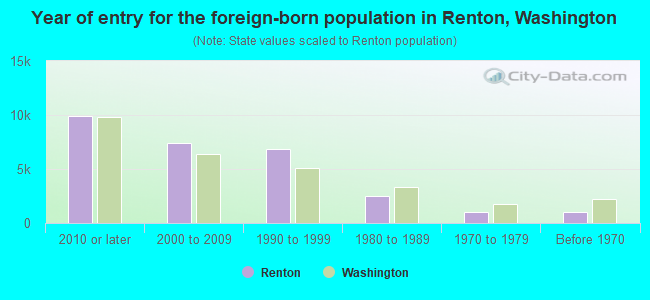
Year of entry for the foreign-born population in Renton, Washington
9,886 2010 or later 7,374 2000 to 2009 6,867 1990 to 1999 2,467 1980 to 1989 1,022 1970 to 1979 1,058 Before 1970
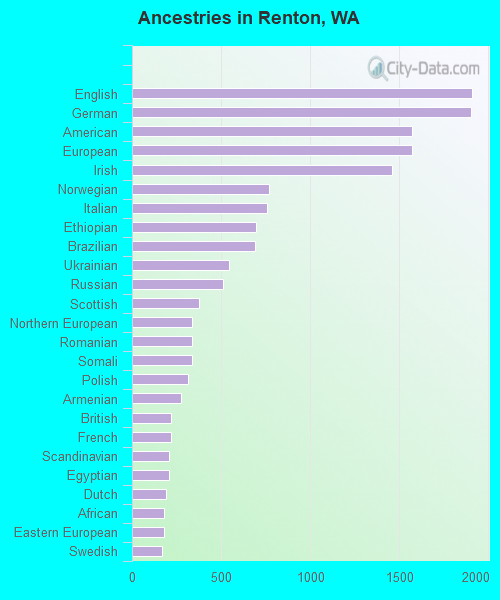
First ancestries reported:
English: 1,908 (3.2%)
German: 1,900 (3.2%)
American: 1,570 (2.7%)
European: 1,569 (2.7%)
Irish: 1,458 (2.5%)
Norwegian: 770 (1.3%)
Italian: 755 (1.3%)
Ethiopian: 694 (1.2%)
Brazilian: 692 (1.2%)
Ukrainian: 543 (0.9%)
Russian: 510 (0.9%)
Scottish: 374 (0.6%)
Northern European: 338 (0.6%)
Romanian: 337 (0.6%)
Somali: 335 (0.6%)
Polish: 316 (0.5%)
Armenian: 276 (0.5%)
British: 220 (0.4%)
French: 219 (0.4%)
Scandinavian: 209 (0.4%)
Egyptian: 207 (0.4%)
Dutch: 190 (0.3%)
African: 182 (0.3%)
Eastern European: 181 (0.3%)
Swedish: 171 (0.3%)
Turkish: 162 (0.3%)
Portuguese: 131 (0.2%)
Scotch-Irish: 121 (0.2%)
Czech: 120 (0.2%)
Palestinian: 109 (0.2%)
Iranian: 102 (0.2%)
Moroccan: 100 (0.2%)
Canadian: 98 (0.2%)
Ghanaian: 97 (0.2%)
Iraqi: 83 (0.1%)
Nigerian: 83 (0.1%)
Danish: 70 (0.1%)
Swiss: 66 (0.1%)
South African: 60 (0.1%)
Slovak: 58 (0.10%)
Latvian: 55 (0.09%)
Jamaican: 55 (0.09%)
Kenyan: 53 (0.09%)
French Canadian: 53 (0.09%)
Greek: 37 (0.06%)
Hungarian: 35 (0.06%)
Lithuanian: 33 (0.06%)
Croatian: 31 (0.05%)
Haitian: 28 (0.05%)
Welsh: 27 (0.05%)
Yugoslavian: 27 (0.05%)
Macedonian: 23 (0.04%)
Finnish: 22 (0.04%)
Austrian: 21 (0.04%)
Slovene: 20 (0.03%)
Israeli: 18 (0.03%)
German Russian: 17 (0.03%)
Lebanese: 16 (0.03%)
West Indian: 15 (0.03%)
Syrian: 14 (0.02%)
Bulgarian: 12 (0.02%)
Czechoslovakian: 10 (0.02%)
New Zealander: 4 (0.01%)
Most common places of birth for foreign-born residents (%): Vietnam Renton:
18.1% (5,679)Washington:
5.4% (62,003)
Mexico Renton:
12.2% (3,835)Washington:
21.1% (241,655)
Philippines Renton:
9.4% (2,956)Washington:
6.3% (71,661)
China, excluding Hong Kong and Taiwan Renton:
9.1% (2,848)Washington:
7.4% (84,470)
India Renton:
6.7% (2,086)Washington:
8.9% (101,353)
Korea Renton:
3.7% (1,160)Washington:
4.3% (48,886)
Brazil Renton:
2.7% (854)Washington:
0.8% (9,359)
Thailand Renton:
2.2% (685)Washington:
0.9% (9,937)
Russia Renton:
2.2% (675)Washington:
1.9% (21,540)
Cambodia Renton:
2.1% (655)Washington:
1.0% (10,993)
Ethiopia Renton:
1.8% (563)Washington:
1.6% (17,938)
Hong Kong Renton:
1.7% (531)Washington:
0.8% (8,785)
Taiwan Renton:
1.7% (522)Washington:
1.5% (16,607)
Ukraine Renton:
1.7% (521)Washington:
3.1% (35,872)
Place of birth for U.S.-born residents:
This state: 40,851Other state: 28,245Northeast: 2,623Midwest: 7,343South: 6,224West: 12,055 83.5% of Renton residents lived in the same house 1 years ago.
Out of people who lived in different houses, 40.1% lived in this county.
Out of people who lived in different counties, 38.2% lived in Washington.
Renton:
83.5%State average:
85.2%
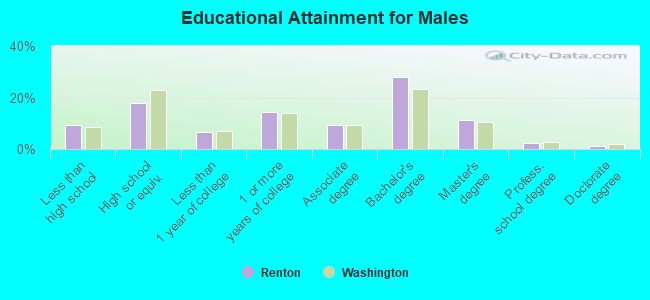
Education attainment for males 25 years and older:
No schooling: 1,402Nursery to 4th grade: 05th and 6th grade: 3057th and 8th grade: 5389th grade: 21710th grade: 30711th grade: 31012th grade, no diploma: 757High school graduate (or equivalency): 7,290Less than 1 year of college: 2,602Some college more than 1 year, no degree: 5,880Associate degree: 3,722Bachelor's degree: 11,371Master's degree: 4,525Professional school degree: 873Doctorate degree: 499
Education attainment for females 25 years and older:
No schooling: 1,512Nursery to 4th grade: 5275th and 6th grade: 1587th and 8th grade: 3079th grade: 66310th grade: 18911th grade: 34212th grade, no diploma: 1,072High school graduate (or equivalency): 8,117Less than 1 year of college: 1,065Some college more than 1 year, no degree: 3,948Associate degree: 3,584Bachelor's degree: 10,138Master's degree: 3,775Professional school degree: 859Doctorate degree: 421
Housing units in structures:
One, detached: 21,126One, attached: 3,907Two: 7133 or 4: 2,2735 to 9: 3,61510 to 19: 2,98820 to 49: 2,52750 or more: 5,545Mobile homes: 979Median worth of mobile homes: $92,580
Housing units lacking complete plumbing facilities in 2022: 0.3%Housing units lacking complete kitchen facilities in 2022: 1.8%House/condo owner moved in on average 10 years ago
Renter moved in on average 2 years ago
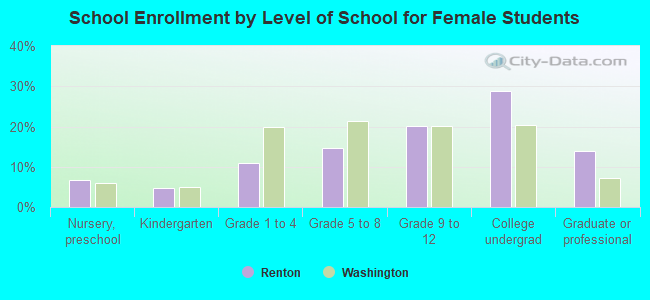
Private vs. public school enrollment:
Students in private schools in grades 1 to 8 (elementary and middle school): 480 Here:
8.3%Washington:
12.4%
Students in private schools in grades 9 to 12 (high school): 348 Students in private undergraduate colleges: 1,182 Here:
20.6%Washington:
16.5%