Rancho Santa Margarita, CA (California) Houses and Residents
| Rancho Santa Margarita: | $938,937 |
| California: | $715,900 |
Mean price in 2022:
Detached houses: $1,110,060
Here: $1,110,060 State: $988,808 Townhouses or other attached units: $654,848
Here: $654,848 State: $838,546 In 2-unit structures: $462,524
Here: $462,524 State: $1,138,100 In 3-to-4-unit structures: $533,884
Here: $533,884 State: $824,253 In 5-or-more-unit structures: $588,057
Here: $588,057 State: $730,996
Total population: 49,359 (Urban population: 47,718, Rural population: 0)
Houses: 17,388 (17,031 occupied: 12,457 owner occupied, 4,638 renter occupied)
| % of renters here: | 27% |
| State: | 44% |
Housing density: 1,417 houses/condos per square mile
Median price asked for vacant for-sale houses and condos in 2022: $2,677,190.
Median contract rent in 2022: over $2,000 (lower quartile is $1,997, upper quartile is over $2,000)
Median rent asked for vacant for-rent units in 2022: $2,460
Median gross rent in Rancho Santa Margarita, CA in 2022: over $2,000
Housing units in Rancho Santa Margarita with a mortgage: 9,971 (1,102 second mortgage, 21 home equity loan, 917 both second mortgage and home equity loan)
Houses without a mortgage: 134
Median household income for houses/condos with a mortgage: $188,032
Median household income for apartments without a mortgage: $138,903
Median monthly housing costs: $2,735
Compare current foreclosures in Rancho Santa Margarita, CA:
| Photo | Address | Area | Beds / Baths | Price | Details |
|---|---|---|---|---|---|

|
#1
Dorado
Rancho Santa Margarita, CA 92688
|
1,049 sq. feet
|
2 baths 2 beds |
show details | |

|
#2
Seacountry Ln
Rancho Santa Margarita, CA 92688
|
1,160 sq. feet
|
2 baths 3 beds |
show details | |

|
#3
Via Lampara
Rancho Santa Margarita, CA 92688
|
1,079 sq. feet
|
2 baths 2 beds |
show details | |

|
#4
Tierra Plano
Rancho Santa Margarita, CA 92688
|
1,361 sq. feet
|
3 baths 3 beds |
show details | |

|
#5
Tierra Montanosa
Rancho Santa Margarita, CA 92688
|
1,064 sq. feet
|
2 baths 2 beds |
show details | |

|
#6
Via De La Mesa
Rancho Santa Margarita, CA 92688
|
1,429 sq. feet
|
2 baths 3 beds |
show details | |

|
#7
Via Joaquin
Rancho Santa Margarita, CA 92688
|
1,100 sq. feet
|
2 baths 3 beds |
show details | |

|
#8
Daybreak Ln
Rancho Santa Margarita, CA 92688
|
1,420 sq. feet
|
2 baths 3 beds |
show details | |

|
#9
Castano
Rancho Santa Margarita, CA 92688
|
888 sq. feet
|
2 baths 2 beds |
show details | |

|
#10
Orchid
Rancho Santa Margarita, CA 92688
|
1,347 sq. feet
|
3 baths 3 beds |
show details |
| Photo | Address | Area | Beds / Baths | Price | Details |
|---|---|---|---|---|---|

|
#11
Buckthorn
Rancho Santa Margarita, CA 92688
|
1,002 sq. feet
|
2 baths 2 beds |
show details | |

|
#12
Tierra Plano
Rancho Santa Margarita, CA 92688
|
- sq. feet
|
2 baths 3 beds |
show details | |

|
#13
Bloomfield Ln
Rancho Santa Margarita, CA 92688
|
- sq. feet
|
2 baths 3 beds |
show details | |

|
#14
Silkwood Ln
Rancho Santa Margarita, CA 92688
|
1,703 sq. feet
|
- baths 4 beds |
show details | |

|
#15
Via Meseta
Rancho Santa Margarita, CA 92688
|
800 sq. feet
|
2 baths - beds |
show details | |

|
#16
Firethorn
Rancho Santa Margarita, CA 92688
|
1,428 sq. feet
|
- baths 3 beds |
show details | |

|
#17
Calle Del Rio
Rancho Santa Margarita, CA 92688
|
- sq. feet
|
1 baths 3 beds |
show details | |

|
#18
Via Joaquin
Rancho Santa Margarita, CA 92688
|
1,150 sq. feet
|
- baths 3 beds |
show details | |

|
#19
Via Vicini
Rancho Santa Margarita, CA 92688
|
- sq. feet
|
2 baths 2 beds |
show details | |

|
#20
Via Madera
Rancho Santa Margarita, CA 92688
|
- sq. feet
|
2 baths 2 beds |
show details |
| Photo | Address | Area | Beds / Baths | Price | Details |
|---|---|---|---|---|---|

|
#21
Sable
Rancho Santa Margarita, CA 92688
|
- sq. feet
|
- baths - beds |
show details | |

|
#22
Bloomfield Ln
Rancho Santa Margarita, CA 92688
|
- sq. feet
|
- baths 3 beds |
show details | |

|
#23
Santa Margarita Pkwy
Rancho Santa Margarita, CA 92688
|
- sq. feet
|
- baths - beds |
show details | |

|
#24
Paulownia
Rancho Santa Margarita, CA 92688
|
- sq. feet
|
- baths - beds |
show details | |

|
#25
Oso Pkwy # D332
Rancho Santa Margarita, CA 92688
|
- sq. feet
|
- baths - beds |
show details | |

|
#26
Mira Mesa
Rancho Santa Margarita, CA 92688
|
- sq. feet
|
- baths - beds |
show details | |

|
#27
Via Serena
Rancho Santa Margarita, CA 92688
|
- sq. feet
|
- baths - beds |
show details | |

|
#28
El Corazon Apt 121
Rancho Santa Margarita, CA 92688
|
- sq. feet
|
- baths - beds |
show details | |

|
#29
Sable
Rancho Santa Margarita, CA 92688
|
- sq. feet
|
- baths - beds |
show details | |

|
#30
Oso Pkwy # D527
Rancho Santa Margarita, CA 92688
|
- sq. feet
|
- baths - beds |
show details |
| Photo | Address | Area | Beds / Baths | Price | Details |
|---|---|---|---|---|---|

|
#31
El Corazon Apt 315
Rancho Santa Margarita, CA 92688
|
- sq. feet
|
- baths - beds |
show details | |

|
#32
El Prado Apt 7306
Rancho Santa Margarita, CA 92688
|
- sq. feet
|
- baths - beds |
show details | |

|
#33
Alma Aldea Apt 159
Rancho Santa Margarita, CA 92688
|
- sq. feet
|
- baths - beds |
show details | |

|
#34
Rabano
Rancho Santa Margarita, CA 92688
|
- sq. feet
|
- baths - beds |
show details | |

|
#35
Via Bonita
Rancho Santa Margarita, CA 92688
|
- sq. feet
|
- baths 4 beds |
show details | |

|
#36
San Bonifacio
Rancho Santa Margarita, CA 92688
|
- sq. feet
|
- baths - beds |
show details | |

|
#37
Via Serena
Rancho Santa Margarita, CA 92688
|
- sq. feet
|
- baths - beds |
show details | |

|
#38
El Prado Apt 5209
Rancho Santa Margarita, CA 92688
|
- sq. feet
|
- baths - beds |
show details | |

|
#39
Pyrite
Rancho Santa Margarita, CA 92688
|
- sq. feet
|
- baths - beds |
show details | |

|
#40
Daybreak Ln
Rancho Santa Margarita, CA 92688
|
- sq. feet
|
- baths - beds |
show details |
| Photo | Address | Area | Beds / Baths | Price | Details |
|---|---|---|---|---|---|

|
#41
Via Tronido
Rancho Santa Margarita, CA 92688
|
- sq. feet
|
- baths - beds |
show details | |

|
#42
Wayfaire
Rancho Santa Margarita, CA 92688
|
- sq. feet
|
- baths - beds |
show details | |

|
#43
Acanthus
Rancho Santa Margarita, CA 92688
|
- sq. feet
|
- baths - beds |
show details | |

|
#44
Rabano
Rancho Santa Margarita, CA 92688
|
- sq. feet
|
- baths - beds |
show details | |

|
Check over 1 million property listings on Foreclosure.com!
|
browse all offers | |||


 | S. CA. houses w/in 10 miles of liberal beach town, $600,000 (39 replies) |
| Looking to move to OC - Need Real Estate Advice (20 replies) |
| Housing Market OC (43 replies) |
| OC median home prices reach pre-recession peak:645K (78 replies) |
| Aliso Viejo or Rancho Santa Margarita - RELOCATING (35 replies) |
| Rancho Santa Margarita, Mission Viejo, or Lake Forest (7 replies) |

Median year apartment built: 1993
Household type by relationship:
Households: 47,340- Male householders: 8,893 (1,542 living alone), Female householders: 7,777 (1,767 living alone)
10,875 spouses (10,722 opposite-sex spouses), 575 unmarried partners, (557 opposite-sex unmarried partners), 15,989 children (15,111 natural, 339 adopted, 538 stepchildren), 360 grandchildren, 691 brothers or sisters, 1,110 parents, 11 foster children, 397 other relatives, 654 non-relatives
- In group quarters: 2
Size of family households: 4,731 2-persons, 3,310 3-persons, 3,487 4-persons, 999 5-persons, 179 6-persons, 252 7-or-more-persons.
Size of nonfamily households: 3,447 1-person, 585 2-persons, 62 3-persons, 6 4-persons.
8,674 married couples with children.
1,135 single-parent households (267 men, 868 women).
73.6% of residents of Rancho Santa Margarita speak English at home.
11.5% of residents speak Spanish at home (69% speak English very well, 18% speak English well, 6% speak English not well, 7% don't speak English at all).
6.7% of residents speak other Indo-European language at home (73% speak English very well, 12% speak English well, 12% speak English not well, 3% don't speak English at all).
5.9% of residents speak Asian or Pacific Island language at home (65% speak English very well, 23% speak English well, 11% speak English not well, 2% don't speak English at all).
1.0% of residents speak other language at home (83% speak English very well, 12% speak English well, 6% don't speak English at all).
Foreign born population: 10,072 (21.3%)
(60.8% of them are naturalized citizens)
| Here: | 6.4 |
| State: | 6.0 |
| Here: | 3.8 |
| State: | 3.9 |

- Bedrooms in owner-occupied houses and condos in Rancho Santa Margarita, California
- 50no bedroom
- 5631 bedroom
- 2,2962 bedrooms
- 4,3133 bedrooms
- 3,8414 bedrooms
- 1,3945+ bedrooms

- Bedrooms in renter-occupied apartments in Rancho Santa Margarita, California
- 565no bedroom
- 1,2681 bedroom
- 1,7732 bedrooms
- 7453 bedrooms
- 2404 bedrooms
- 485+ bedrooms

- Cars and other vehicles available in Rancho Santa Margarita in owner-occupied houses/condos
- 68no vehicle
- 2,3531 vehicle
- 5,6642 vehicles
- 3,0293 vehicles
- 9254 vehicles
- 4185+ vehicles

- Cars and other vehicles available in Rancho Santa Margarita in renter-occupied apartments
- 585no vehicle
- 1,7221 vehicle
- 1,5892 vehicles
- 4813 vehicles
- 2344 vehicles
- 275+ vehicles

- Rooms in owner-occupied houses in Rancho Santa Margarita, California
- 501 room
- 902 rooms
- 5013 rooms
- 1,6384 rooms
- 2,0535 rooms
- 2,0956 rooms
- 2,2007 rooms
- 1,5388 rooms
- 2,2949+ rooms

- Rooms in renter-occupied apartments in Rancho Santa Margarita, California
- 5551 room
- 3082 rooms
- 1,0333 rooms
- 1,4494 rooms
- 4695 rooms
- 3496 rooms
- 2307 rooms
- 698 rooms
- 1769+ rooms


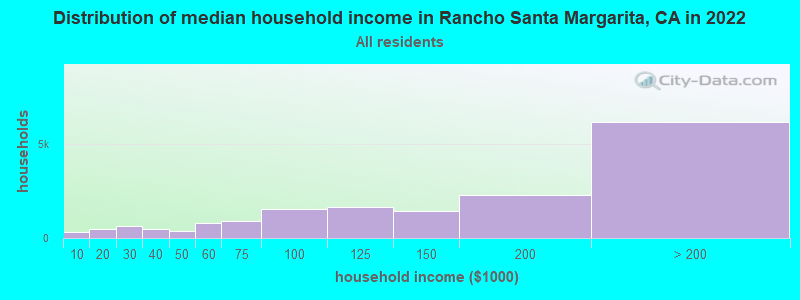
Rancho Santa Margarita, CA household income distribution

- 333Less than $10,000
- 498$10,000 to $19,999
- 622$20,000 to $29,999
- 478$30,000 to $39,999
- 374$40,000 to $49,999
- 785$50,000 to $59,999
- 888$60,000 to $74,999
- 1,524$75,000 to $99,999
- 1,627$100,000 to $124,999
- 1,434$125,000 to $149,999
- 2,304$150,000 to $199,999
- 6,168$200,000 or more
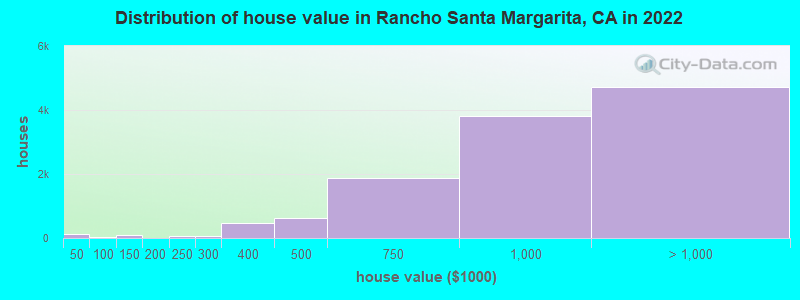
Home value of owner - occupied houses in 2022 in Rancho Santa Margarita, CA
-
- 112Less than $10,000
- 12$40,000 to $49,999
- 13$70,000 to $79,999
- 4$90,000 to $99,999
- 85$100,000 to $124,999
- 14$125,000 to $149,999
- 46$200,000 to $249,999
- 72$250,000 to $299,999
- 480$300,000 to $399,999
- 619$400,000 to $499,999
- 1,873$500,000 to $749,999
- 3,808$750,000 to $999,999
- 4,268$1,000,000 to $1,499,999
- 401$1,500,000 to $1,999,999
- 60$2,000,000 or more
Rent paid by renters in 2022 in Rancho Santa Margarita, CA
-
- 9$200 to $249
- 29$400 to $449
- 13$600 to $649
- 10$750 to $799
- 28$800 to $899
- 13$900 to $999
- 35$1,000 to $1,249
- 38$1,250 to $1,499
- 982$1,500 to $1,999
- 1,760$2,000 to $2,499
- 907$2,500 to $2,999
- 314$3,000 to $3,499
- 414$3,500 or more
- 72No cash rent


Percentage of workers working in this county: 96.4%
Number of people working at home: 6,070 (22.2% of all workers)
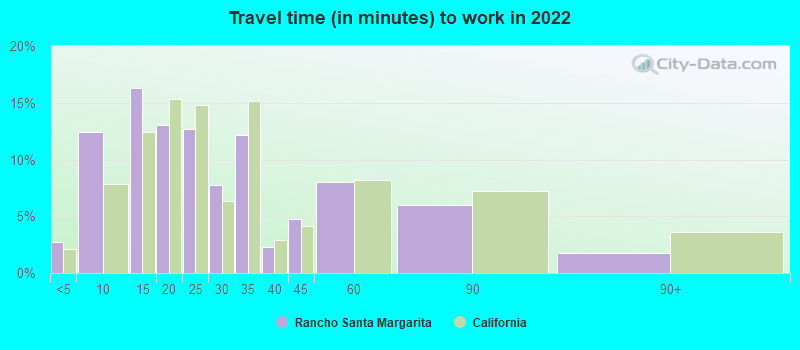
Travel time to work (commute)
- Less than 5 minutes: 502
- 5 to 9 minutes: 1,670
- 10 to 14 minutes: 2,308
- 15 to 19 minutes: 3,154
- 20 to 24 minutes: 2,731
- 25 to 29 minutes: 2,359
- 30 to 34 minutes: 3,748
- 35 to 39 minutes: 786
- 40 to 44 minutes: 840
- 45 to 59 minutes: 1,898
- 60 to 89 minutes: 1,163
- 90 or more minutes: 331
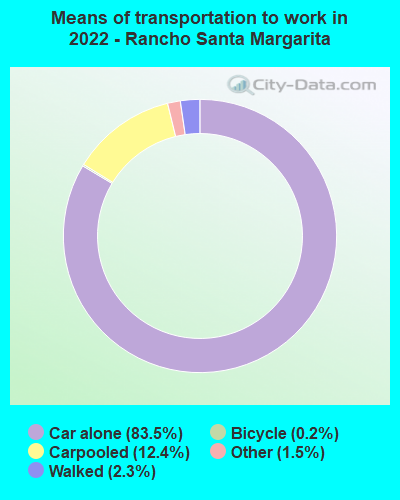
Means of transportation to work:
- Drove a car alone: 11,594 (59.4%)
- Carpooled: 1,872 (9.6%)
- Bus: 12 (0.1%)
- Taxi: 239 (1.2%)
- Bicycle: 23 (0.1%)
- Walked: 311 (1.6%)
- Worked at home: 6,070 (31.1%)

- Unemployment by race in 2022
- Unemployment rate for White non-Hispanic residents
- 2.7%Males
- 1.5%Females
- Unemployment rate for Black residents
- 6.3%Females
- Unemployment rate for American Indian and Alaska Native residents
- 15.4%Males
- 18.6%Females
- Unemployment rate for Asian residents
- 1.5%Males
- 2.5%Females
- Unemployment rate for other race residents
- 4.4%Males
- 5.3%Females
- Unemployment rate for two or more race residents
- 2.0%Males
- 2.0%Females
- Unemployment rate for Hispanic or Latino residents
- 3.0%Males
- 2.8%Females

- Year of entry for the foreign-born population in Rancho Santa Margarita, California
- 2,4462010 or later
- 2,1462000 to 2009
- 2,1811990 to 1999
- 2,1531980 to 1989
- 1,3861970 to 1979
- 889Before 1970
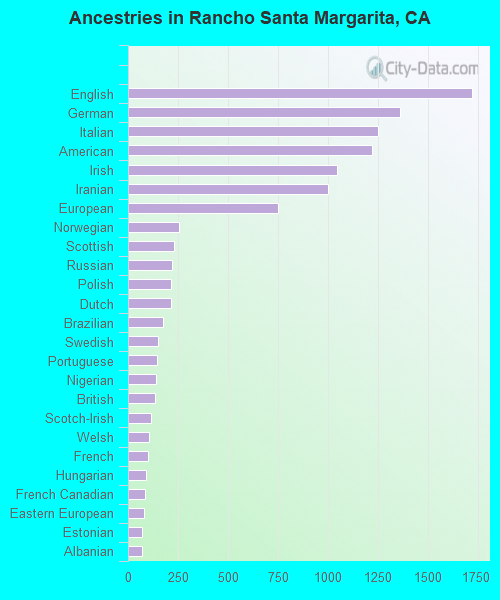
First ancestries reported:
- English: 1,720 (7.0%)
- German: 1,361 (5.5%)
- Italian: 1,249 (5.1%)
- American: 1,221 (5.0%)
- Irish: 1,048 (4.3%)
- Iranian: 1,002 (4.1%)
- European: 750 (3.0%)
- Norwegian: 253 (1.0%)
- Scottish: 231 (0.9%)
- Russian: 219 (0.9%)
- Polish: 217 (0.9%)
- Dutch: 216 (0.9%)
- Brazilian: 175 (0.7%)
- Swedish: 148 (0.6%)
- Portuguese: 144 (0.6%)
- Nigerian: 140 (0.6%)
- British: 133 (0.5%)
- Scotch-Irish: 116 (0.5%)
- Welsh: 104 (0.4%)
- French: 99 (0.4%)
- Hungarian: 92 (0.4%)
- French Canadian: 84 (0.3%)
- Eastern European: 82 (0.3%)
- Estonian: 71 (0.3%)
- Albanian: 69 (0.3%)
- Danish: 56 (0.2%)
- Swiss: 55 (0.2%)
- Moroccan: 48 (0.2%)
- Finnish: 47 (0.2%)
- Afghan: 45 (0.2%)
- Syrian: 45 (0.2%)
- Northern European: 42 (0.2%)
- Bulgarian: 41 (0.2%)
- South African: 37 (0.2%)
- Ghanaian: 29 (0.1%)
- Jamaican: 29 (0.1%)
- Egyptian: 28 (0.1%)
- Canadian: 28 (0.1%)
- Austrian: 27 (0.1%)
- Armenian: 26 (0.1%)
- Czech: 25 (0.1%)
- Turkish: 24 (0.10%)
- Ukrainian: 24 (0.10%)
- West Indian: 23 (0.09%)
- Palestinian: 22 (0.09%)
- Greek: 19 (0.08%)
- Croatian: 18 (0.07%)
- Jordanian: 17 (0.07%)
- Lebanese: 14 (0.06%)
- Slavic: 9 (0.04%)
- Haitian: 9 (0.04%)
- Romanian: 9 (0.04%)
- Lithuanian: 8 (0.03%)
- Basque: 8 (0.03%)
- Scandinavian: 6 (0.02%)
- Slovak: 3 (0.01%)
Most common places of birth for foreign-born residents (%):
| Rancho Santa Margarita: | 16.5% (1,658) |
| California: | 37.2% (3,881,193) |
| Rancho Santa Margarita: | 12.3% (1,238) |
| California: | 7.8% (818,297) |
| Rancho Santa Margarita: | 9.2% (923) |
| California: | 1.2% (127,477) |
| Rancho Santa Margarita: | 9.1% (914) |
| California: | 2.0% (206,004) |
| Rancho Santa Margarita: | 7.9% (796) |
| California: | 5.2% (539,184) |
| Rancho Santa Margarita: | 4.0% (398) |
| California: | 0.5% (53,222) |
| Rancho Santa Margarita: | 3.5% (355) |
| California: | 4.2% (440,287) |
| Rancho Santa Margarita: | 2.9% (292) |
| California: | 0.6% (57,953) |
| Rancho Santa Margarita: | 2.7% (276) |
| California: | 0.7% (74,025) |
| Rancho Santa Margarita: | 2.6% (260) |
| California: | 4.9% (512,335) |
| Rancho Santa Margarita: | 1.9% (193) |
| California: | 6.6% (684,672) |
| Rancho Santa Margarita: | 1.9% (190) |
| California: | 0.1% (5,897) |
| Rancho Santa Margarita: | 1.9% (189) |
| California: | 1.7% (176,274) |
| Rancho Santa Margarita: | 1.9% (188) |
| California: | 3.0% (315,248) |
Place of birth for U.S.-born residents:
- This state: 27,695
- Other state: 8,558
- Northeast: 2,289
- Midwest: 3,189
- South: 1,740
- West: 1,336
89.2% of Rancho Santa Margarita residents lived in the same house 1 years ago.
Out of people who lived in different houses, 44.5% lived in this county.
Out of people who lived in different counties, 39.8% lived in California.
| Rancho Santa Margarita: | 89.2% |
| State average: | 88.9% |
Education attainment for males 25 years and older:
- No schooling: 308
- Nursery to 4th grade: 23
- 5th and 6th grade: 74
- 7th and 8th grade: 27
- 9th grade: 76
- 10th grade: 16
- 11th grade: 83
- 12th grade, no diploma: 260
- High school graduate (or equivalency): 2,148
- Less than 1 year of college: 916
- Some college more than 1 year, no degree: 2,754
- Associate degree: 1,348
- Bachelor's degree: 5,576
- Master's degree: 1,721
- Professional school degree: 503
- Doctorate degree: 250

Education attainment for females 25 years and older:
- No schooling: 421
- Nursery to 4th grade: 0
- 5th and 6th grade: 180
- 7th and 8th grade: 11
- 9th grade: 0
- 10th grade: 25
- 11th grade: 33
- 12th grade, no diploma: 286
- High school graduate (or equivalency): 2,408
- Less than 1 year of college: 849
- Some college more than 1 year, no degree: 2,592
- Associate degree: 1,293
- Bachelor's degree: 5,755
- Master's degree: 2,194
- Professional school degree: 697
- Doctorate degree: 211


Housing units in structures:
- One, detached: 9,500
- One, attached: 3,413
- Two: 196
- 3 or 4: 700
- 5 to 9: 935
- 10 to 19: 1,188
- 20 to 49: 293
- 50 or more: 1,159
Housing units lacking complete kitchen facilities in 2022: 0.4%
House/condo owner moved in on average 10 years ago
Renter moved in on average 2 years ago

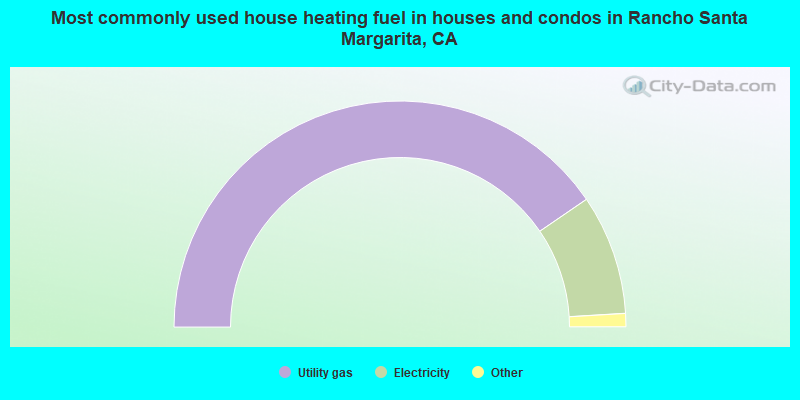
- 80.9%Utility gas
- 17.2%Electricity
- 0.8%Bottled, tank, or LP gas
- 0.6%Solar energy
- 0.3%No fuel used
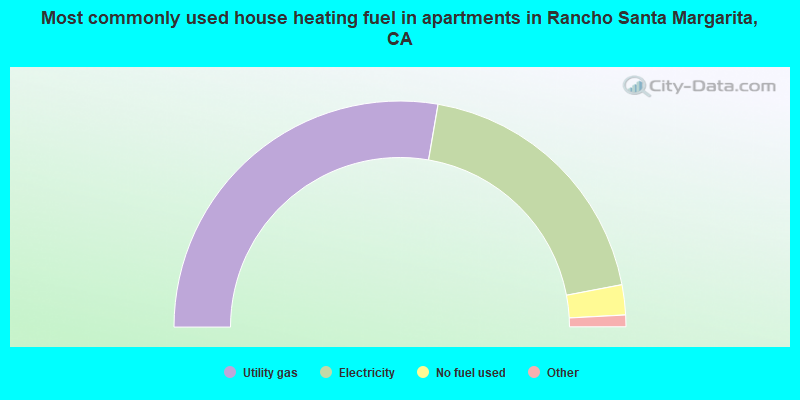
- 55.4%Utility gas
- 38.6%Electricity
- 4.3%No fuel used
- 1.3%Bottled, tank, or LP gas
- 0.4%Other fuel
Private vs. public school enrollment:
| Here: | 16.7% |
| California: | 10.5% |
| Here: | 16.8% |
| California: | 8.5% |
| Here: | 19.7% |
| California: | 15.9% |


