Housing density: 1,228 houses/condos per square mile
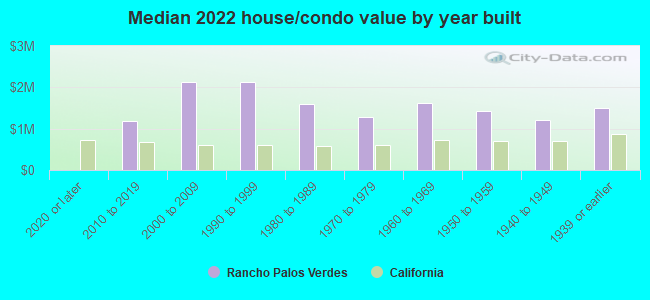
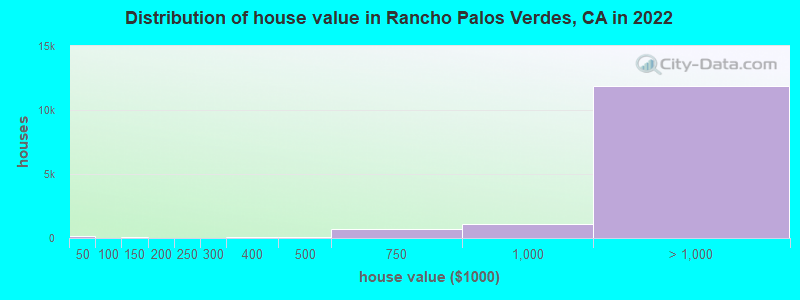
Median price asked for vacant for-sale houses and condos in 2022: $1,609,460.
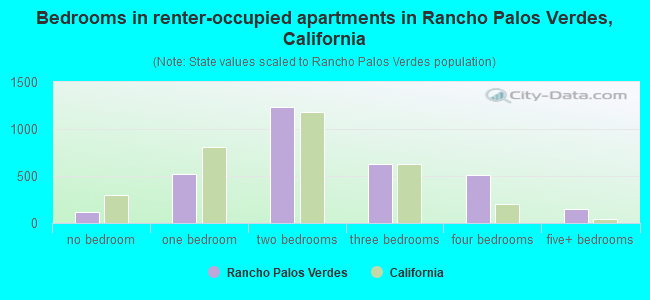
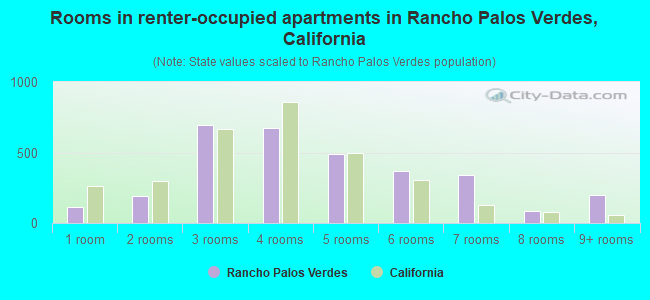
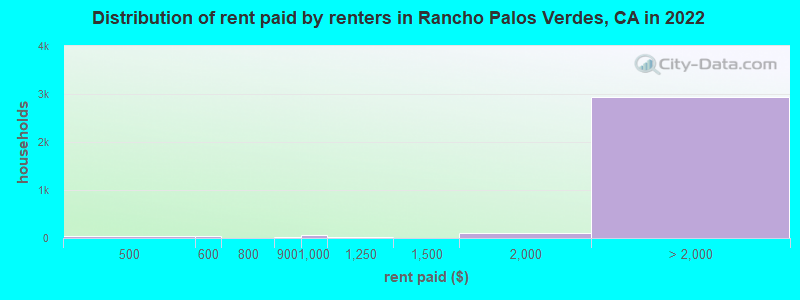
Median contract rent in 2022: over $2,000 (lower quartile is over $2,000, upper quartile is over $2,000)
Median rent asked for vacant for-rent units in 2022: $3,457
Median gross rent in Rancho Palos Verdes, CA in 2022: over $2,000
Housing units in Rancho Palos Verdes with a mortgage: 7,944 (991 second mortgage, 46 home equity loan, 817 both second mortgage and home equity loan) Houses without a mortgage: 155
Median household income for houses/condos with a mortgage: $203,490
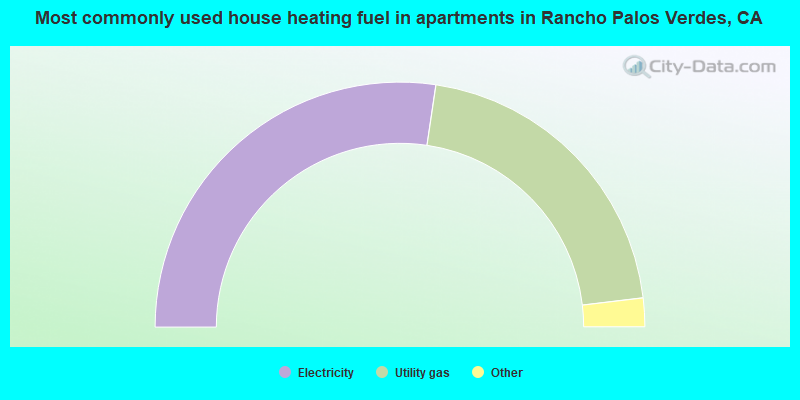
Median household income for apartments without a mortgage: $139,967
Median monthly housing costs: $3,119
Compare current foreclosures near Rancho Palos Verdes, CA:
6,809 married couples with children.
657 single-parent households (147 men, 510 women).
66.9% of residents of Rancho Palos Verdes speak English at home.
5.0% of residents speak Spanish at home (73% speak English very well, 25% speak English well, 2% speak English not well).
8.2% of residents speak other Indo-European language at home (79% speak English very well, 18% speak English well, 3% speak English not well).
19.6% of residents speak Asian or Pacific Island language at home (61% speak English very well, 27% speak English well, 11% speak English not well, 2% don't speak English at all).
1.5% of residents speak other language at home (95% speak English very well, 5% speak English well).
Foreign born population: 10,969 (26.8%)
(70.8% of them are naturalized citizens)
Percentage of workers working in this county: 95.6% Number of people working at home: 5,067 (28.4% of all workers)
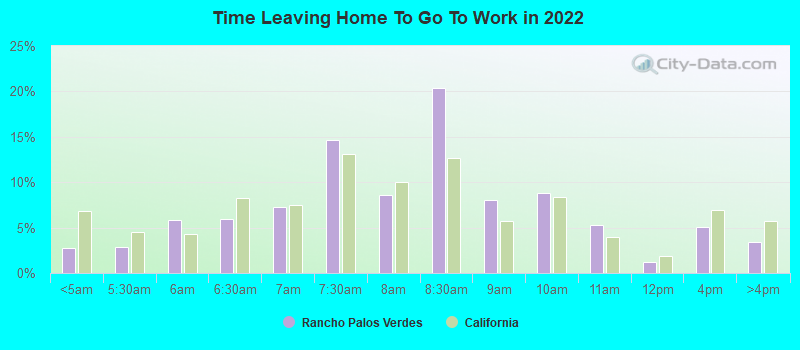
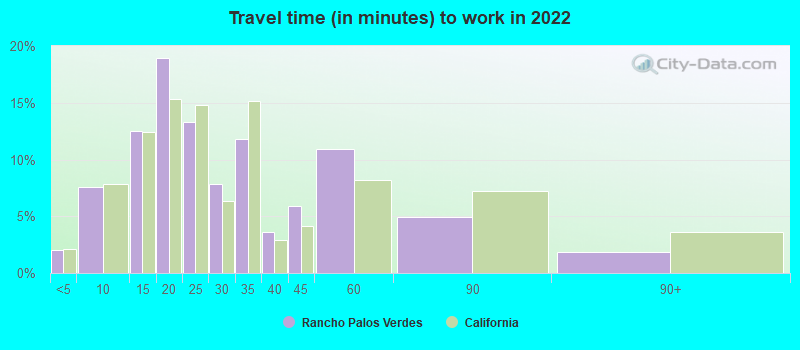
Travel time to work (commute)
Less than 5 minutes: 265
5 to 9 minutes: 778
10 to 14 minutes: 814
15 to 19 minutes: 1,418
20 to 24 minutes: 1,946
25 to 29 minutes: 833
30 to 34 minutes: 2,130
35 to 39 minutes: 648
40 to 44 minutes: 1,166
45 to 59 minutes: 1,524
60 to 89 minutes: 1,318
90 or more minutes: 445
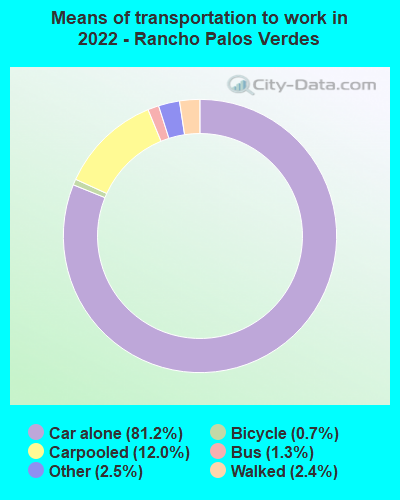
Means of transportation to work:
Drove a car alone: 4,796 (47.3%)
Carpooled: 781 (7.7%)
Bus: 68 (0.7%)
Taxi: 159 (1.6%)
Bicycle: 41 (0.4%)
Walked: 151 (1.5%)
Worked at home: 5,067 (49.9%)
Unemployment by race in 2022
Unemployment rate for White non-Hispanic residents
3.1%Males
4.1%Females
Unemployment rate for Black residents
29.4%Males
Unemployment rate for Asian residents
5.4%Males
4.4%Females
Unemployment rate for other race residents
5.3%Females
Unemployment rate for two or more race residents
2.5%Males
2.2%Females
Unemployment rate for Hispanic or Latino residents
0.7%Males
4.3%Females
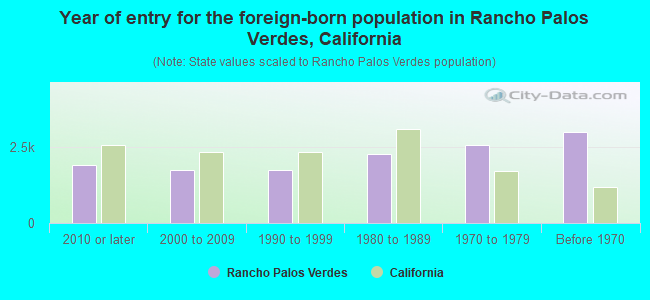
Year of entry for the foreign-born population in Rancho Palos Verdes, California
1,8942010 or later
1,7312000 to 2009
1,7511990 to 1999
2,2521980 to 1989
2,5651970 to 1979
2,972Before 1970
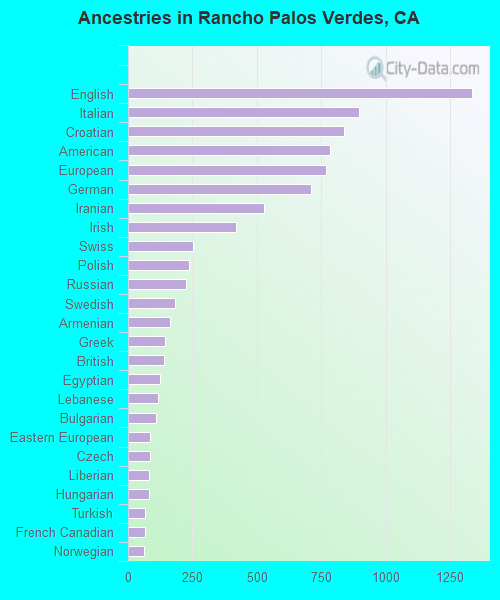
First ancestries reported:
English: 1,335 (5.8%)
Italian: 898 (3.9%)
Croatian: 840 (3.7%)
American: 786 (3.4%)
European: 769 (3.3%)
German: 709 (3.1%)
Iranian: 529 (2.3%)
Irish: 419 (1.8%)
Swiss: 251 (1.1%)
Polish: 238 (1.0%)
Russian: 224 (1.0%)
Swedish: 181 (0.8%)
Armenian: 165 (0.7%)
Greek: 143 (0.6%)
British: 138 (0.6%)
Egyptian: 125 (0.5%)
Lebanese: 116 (0.5%)
Bulgarian: 108 (0.5%)
Eastern European: 86 (0.4%)
Czech: 84 (0.4%)
Liberian: 83 (0.4%)
Hungarian: 83 (0.4%)
Turkish: 67 (0.3%)
French Canadian: 66 (0.3%)
Norwegian: 62 (0.3%)
Austrian: 60 (0.3%)
French: 59 (0.3%)
Brazilian: 59 (0.3%)
Finnish: 46 (0.2%)
Dutch: 46 (0.2%)
Scotch-Irish: 45 (0.2%)
Czechoslovakian: 37 (0.2%)
Welsh: 36 (0.2%)
Scottish: 35 (0.2%)
Scandinavian: 32 (0.1%)
Northern European: 31 (0.1%)
Israeli: 30 (0.1%)
Ukrainian: 25 (0.1%)
Jordanian: 23 (0.10%)
Serbian: 18 (0.08%)
Estonian: 16 (0.07%)
Cajun: 16 (0.07%)
Latvian: 15 (0.07%)
Celtic: 15 (0.07%)
Danish: 13 (0.06%)
Canadian: 13 (0.06%)
Moroccan: 11 (0.05%)
Assyrian: 10 (0.04%)
West Indian: 10 (0.04%)
Ethiopian: 9 (0.04%)
Most common places of birth for foreign-born residents (%):
Korea
Rancho Palos Verdes:
13.9% (1,522)
California:
3.0% (315,248)
Japan
Rancho Palos Verdes:
11.4% (1,248)
California:
1.0% (103,575)
China, excluding Hong Kong and Taiwan
Rancho Palos Verdes:
10.4% (1,142)
California:
6.6% (684,672)
Taiwan
Rancho Palos Verdes:
9.2% (1,010)
California:
1.7% (176,274)
Iran
Rancho Palos Verdes:
4.8% (531)
California:
2.0% (206,004)
Philippines
Rancho Palos Verdes:
4.3% (472)
California:
7.8% (818,297)
Hong Kong
Rancho Palos Verdes:
3.8% (421)
California:
1.0% (105,215)
India
Rancho Palos Verdes:
3.7% (401)
California:
5.2% (539,184)
Mexico
Rancho Palos Verdes:
3.6% (396)
California:
37.2% (3,881,193)
Croatia
Rancho Palos Verdes:
2.9% (321)
California:
0.0% (4,947)
England
Rancho Palos Verdes:
2.2% (241)
California:
0.6% (57,953)
Lebanon
Rancho Palos Verdes:
1.9% (204)
California:
0.3% (31,757)
Canada
Rancho Palos Verdes:
1.8% (196)
California:
1.2% (127,477)
Switzerland
Rancho Palos Verdes:
1.8% (193)
California:
0.1% (9,159)
Brazil
Rancho Palos Verdes:
1.6% (174)
California:
0.5% (53,222)
United Kingdom, excluding England and Scotland
Rancho Palos Verdes:
1.5% (167)
California:
0.6% (60,582)
Place of birth for U.S.-born residents:
This state: 19,284
Other state: 9,653
Northeast: 3,501
Midwest: 3,195
South: 1,651
West: 1,298
90.9% of Rancho Palos Verdes residents lived in the same house 1 years ago. Out of people who lived in different houses, 40.8% lived in this county. Out of people who lived in different counties, 52.9% lived in California.
Rancho Palos Verdes:
90.9%
State average:
88.9%
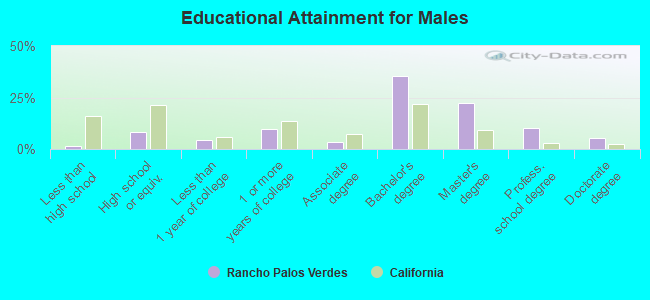
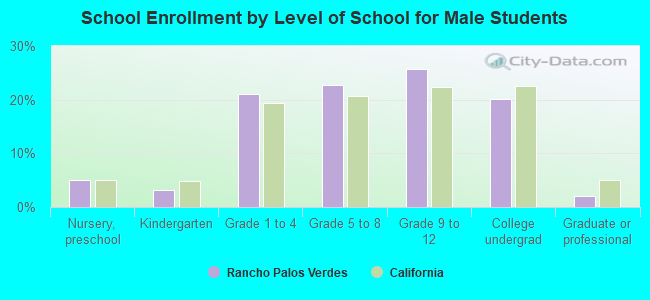
Education attainment for males 25 years and older:
No schooling: 53
Nursery to 4th grade: 0
5th and 6th grade: 53
7th and 8th grade: 0
9th grade: 9
10th grade: 18
11th grade: 20
12th grade, no diploma: 64
High school graduate (or equivalency): 1,174
Less than 1 year of college: 632
Some college more than 1 year, no degree: 1,393
Associate degree: 466
Bachelor's degree: 5,120
Master's degree: 3,207
Professional school degree: 1,449
Doctorate degree: 788
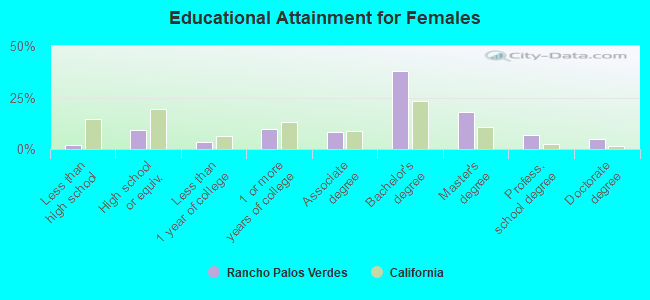
Education attainment for females 25 years and older:
No schooling: 52
Nursery to 4th grade: 0
5th and 6th grade: 51
7th and 8th grade: 42
9th grade: 0
10th grade: 3
11th grade: 11
12th grade, no diploma: 176
High school graduate (or equivalency): 1,485
Less than 1 year of college: 561
Some college more than 1 year, no degree: 1,526
Associate degree: 1,348
Bachelor's degree: 6,053
Master's degree: 2,879
Professional school degree: 1,075
Doctorate degree: 752
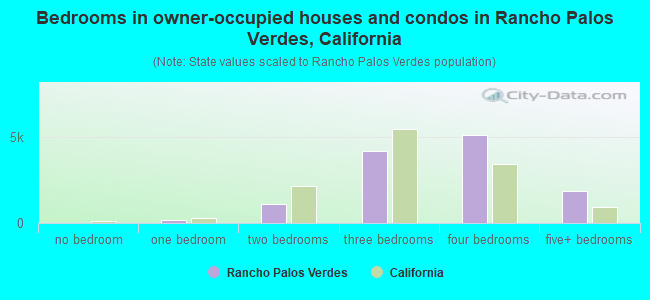
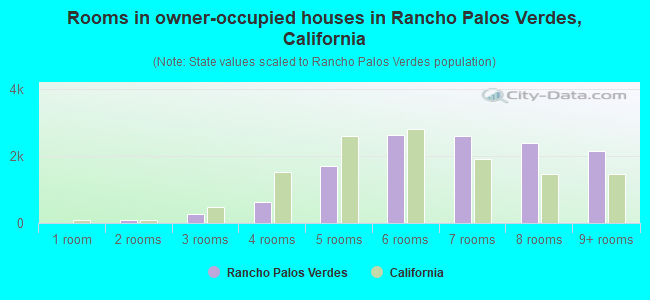
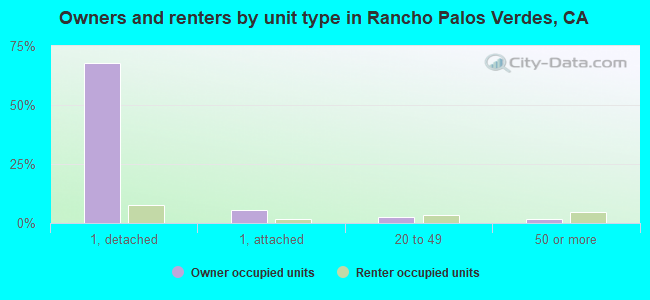
Housing units in structures:
One, detached: 12,698
One, attached: 1,139
Two: 74
3 or 4: 236
5 to 9: 247
10 to 19: 339
20 to 49: 1,020
50 or more: 1,014
Mobile homes: 11
Housing units lacking complete plumbing facilities in 2022: 0.3%
Housing units lacking complete kitchen facilities in 2022: 1.6%
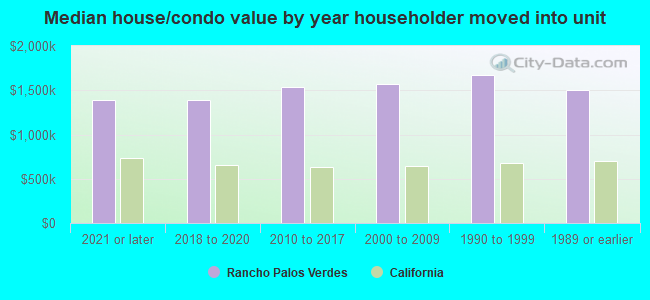
House/condo owner moved in on average 19 years ago