Old Bridge, NJ (New Jersey) Houses and Residents
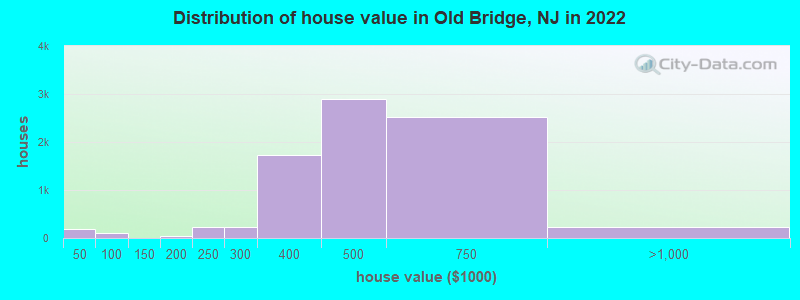
Estimated median house or condo value in 2022: $470,444 (it was $171,500 in 2000 )
Old Bridge:
$470,444New Jersey:
$428,900
Lower value quartile - upper value quartile: $379,594 - $572,795Total population: 23,753 (Urban population: 22,845, Rural population: 97 (all nonfarm) )
Houses: 10,759 (10,552 occupied: 7,770 owner occupied, 2,871 renter occupied )
% of renters here:
27%State:
35%
Housing density: 1,526 houses/condos per square mile
Median price asked for vacant for-sale houses and condos in 2022: $500,217.
Median contract rent in 2022: $1,245 (lower quartile is $971, upper quartile is $1,588)
Median rent asked for vacant for-rent units in 2022: $1,787
Median gross rent in Old Bridge, NJ in 2022: $1,331
Housing units in Old Bridge with a mortgage: 5,105 (625 second mortgage, 0 home equity loan, 554 both second mortgage and home equity loan )Houses without a mortgage: 533
Median household income for houses/condos with a mortgage: $148,047
Median household income for apartments without a mortgage: $97,841
Median monthly housing costs: $1,694
Data:
Median house or condo value ($)
Median house or condo value ($ change since 2000)
Median house or condo value ($) - White
Median house or condo value ($) - Black or African American
Median house or condo value ($) - Asian
Median house or condo value ($) - Hispanic or Latino
Median house or condo value ($) - American Indian and Alaska Native
Median house or condo value ($) - Multirace
Median house or condo value ($) - Other Race
Median price asked for mobile homes ($)
Household density (households per square mile)
Mean house or condo value by units in structure - 1, detached ($)
Mean house or condo value by units in structure - 1, attached ($)
Mean house or condo value by units in structure - 2 ($)
Mean house or condo value by units in structure by units in structure - 3 or 4 ($)
Mean house or condo value by units in structure - 5 or more ($)
Mean house or condo value by units in structure - Boat, RV, van, etc. ($)
Mean house or condo value by units in structure - Mobile home ($)
Median contract rent ($)
Median contract rent - Lower quartile ($)
Median contract rent - Upper quartile ($)
Median gross rent ($)
Urban houses (%)
Rural houses (%)
Houses occupied (%)
Houses occupied (% change since 2000)
Houses owner occupied (%)
Houses owner occupied (% change since 2000)
Houses renter occupied (%)
Houses renter occupied (% change since 2000)
Vacant housing units - For rent (%)
Vacant housing units - For rent (% change since 2000)
Vacant housing units - For sale only (%)
Vacant housing units - For sale only (% change since 2000)
Vacant housing units - Rented or sold, not occupied (%)
Vacant housing units - Rented or sold, not occupied (% change since 2000)
Vacant housing units - For seasonal, recreational, or occasional use (%)
Vacant housing units - For seasonal, recreational, or occasional use (% change since 2000)
Vacant housing units - For migrant workers (%)
Vacant housing units - For migrant workers (% change since 2000)
Vacant housing units - Other vacant (%)
Vacant housing units - Other vacant (% change since 2000)
Median monthly housing costs ($)
Median household income for houses/condos with a mortgage ($)
Median household income for houses/condos without a mortgage ($)
Median household income ($)
Median household income ($) - White
Median household income ($) - Black or African American
Median household income ($) - Asian
Median household income ($) - Hispanic or Latino
Median household income ($) - American Indian and Alaska Native
Median household income ($) - Multirace
Median household income ($) - Other Race
Mortgage status - with mortgage (%)
Mortgage status - with second mortgage (%)
Mortgage status - with home equity loan (%)
Mortgage status - with both second mortgage and home equity loan (%)
Mortgage status - without a mortgage (%)
Median year house/condo built
Median year apartment built
Household type by relationship - Male householder living alone (%)
Household type by relationship - Male householder not living alone (%)
Household type by relationship - Female householder living alone (%)
Household type by relationship - Female householder not living alone (%)
Household type by relationship - Opposite-Sex spouse (%)
Household type by relationship - Same-Sex spouse (%)
Household type by relationship - Opposite-Sex unmarried partner (%)
Household type by relationship - Same-Sex unmarried partner (%)
Household type by relationship - In group quarters (%)
Size of family households - 2-person household (%)
Size of family households - 3-person household (%)
Size of family households - 4-person household (%)
Size of family households - 5-person household (%)
Size of family households - 6-person household (%)
Size of family households - 7-or-more-person household (%)
Size of nonfamily households - 1-person household (%)
Size of nonfamily households - 2-person household (%)
Size of nonfamily households - 3-person household (%)
Size of nonfamily households - 4-person household (%)
Size of nonfamily households - 5-person household (%)
Size of nonfamily households - 6-person household (%)
Size of nonfamily households - 7-or-moreperson household (%)
Year house built - Built 2010 or later (%)
Year house built - Built 2000 to 2009 (%)
Year house built - Built 1990 to 1999 (%)
Year house built - Built 1980 to 1989 (%)
Year house built - Built 1970 to 1979 (%)
Year house built - Built 1960 to 1969 (%)
Year house built - Built 1950 to 1959 (%)
Year house built - Built 1940 to 1949 (%)
Year house built - Built 1939 or earlier (%)
Median number of rooms in houses and condos
Median number of rooms in apartments
Median number of bedrooms in owner occupied houses
Mean number of bedrooms in owner occupied houses
Median number of bedrooms in renter occupied houses
Mean number of bedrooms in renter occupied houses
Median number of vehichles in owner occupied houses
Mean number of vehichles in owner occupied houses
Median number of vehichles in renter occupied houses
Mean number of vehichles in renter occupied houses
Rooms in owner-occupied houses - 1 room (%)
Rooms in owner-occupied houses - 2 rooms (%)
Rooms in owner-occupied houses - 3 rooms (%)
Rooms in owner-occupied houses - 4 rooms (%)
Rooms in owner-occupied houses - 5 rooms (%)
Rooms in owner-occupied houses - 6 rooms (%)
Rooms in owner-occupied houses - 7 rooms (%)
Rooms in owner-occupied houses - 8 rooms (%)
Rooms in owner-occupied houses - 9+ rooms (%)
Rooms in renter-occupied houses - 1 room (%)
Rooms in renter-occupied houses - 2 rooms (%)
Rooms in renter-occupied houses - 3 rooms (%)
Rooms in renter-occupied houses - 4 rooms (%)
Rooms in renter-occupied houses - 5 rooms (%)
Rooms in renter-occupied houses - 6 rooms (%)
Rooms in renter-occupied houses - 7 rooms (%)
Rooms in renter-occupied houses - 8 rooms (%)
Rooms in renter-occupied houses - 9+ rooms (%)
Bedrooms in owner-occupied houses - no bedrooms (%)
Bedrooms in owner-occupied houses - 1 bedroom (%)
Bedrooms in owner-occupied houses - 2 bedrooms (%)
Bedrooms in owner-occupied houses - 3 bedrooms (%)
Bedrooms in owner-occupied houses - 4 bedrooms (%)
Bedrooms in owner-occupied houses - 5+ bedrooms (%)
Bedrooms in renter-occupied houses - no bedrooms (%)
Bedrooms in renter-occupied houses - 1 bedroom (%)
Bedrooms in renter-occupied houses - 2 bedrooms (%)
Bedrooms in renter-occupied houses - 3 bedrooms (%)
Bedrooms in renter-occupied houses - 4 bedrooms (%)
Bedrooms in renter-occupied houses - 5+ bedrooms (%)
Vehicles available in owner-occupied houses - no vehicle available (%)
Vehicles available in owner-occupied houses - 1 vehicle available(%)
Vehicles available in owner-occupied houses - 2 Vehicles available (%)
Vehicles available in owner-occupied houses - 3 Vehicles available (%)
Vehicles available in owner-occupied houses - 4 Vehicles available (%)
Vehicles available in owner-occupied houses - 5+ Vehicles available (%)
Vehicles available in renter-occupied houses - no vehicle available (%)
Vehicles available in renter-occupied houses - 1 vehicle available (%)
Vehicles available in renter-occupied houses - 2 Vehicles available (%)
Vehicles available in renter-occupied houses - 3 Vehicles available (%)
Vehicles available in renter-occupied houses - 4 Vehicles available (%)
Vehicles available in renter-occupied houses - 5+ Vehicles available (%)
Housing units in structures - 1, detached (%)
Housing units in structures - 1, attached (%)
Housing units in structures - 2 (%)
Housing units in structures - 3 or 4 (%)
Housing units in structures - 5 to 9 (%)
Housing units in structures - 10 to 19 (%)
Housing units in structures - 20 to 49 (%)
Housing units in structures - 50 or more (%)
Housing units in structures - Mobile home (%)
Housing units in structures - Boat, RV, van, etc. (%)
Housing units in structures - Owners - 1, detached (%)
Housing units in structures - Owners - 1, attached (%)
Housing units in structures - Owners - 2 (%)
Housing units in structures - Owners - 3 or 4 (%)
Housing units in structures - Owners - 5 to 9 (%)
Housing units in structures - Owners - 10 to 19 (%)
Housing units in structures - Owners - 20 to 49 (%)
Housing units in structures - Owners - 50 or more (%)
Housing units in structures - Owners - Mobile home (%)
Housing units in structures - Owners - Boat, RV, van, etc. (%)
Housing units in structures - Renters - 1, detached (%)
Housing units in structures - Renters - 1, attached (%)
Housing units in structures - Renters - 2 (%)
Housing units in structures - Renters - 3 or 4 (%)
Housing units in structures - Renters - 5 to 9 (%)
Housing units in structures - Renters - 10 to 19 (%)
Housing units in structures - Renters - 20 to 49 (%)
Housing units in structures - Renters - 50 or more (%)
Housing units in structures - Renters - Mobile home (%)
Housing units in structures - Renters - Boat, RV, van, etc. (%)
House/condo owner moved in on average (years ago)
Renter moved in on average (years ago)
Year householder moved into unit - Moved in 1999 to March 2000 (%)
Year householder moved into unit - Moved in 1999 to March 2000 (%) - White
Year householder moved into unit - Moved in 1999 to March 2000 (%) - Black or African American
Year householder moved into unit - Moved in 1999 to March 2000 (%) - Asian
Year householder moved into unit - Moved in 1999 to March 2000 (%) - Hispanic or Latino
Year householder moved into unit - Moved in 1999 to March 2000 (%) - American Indian and Alaska Native
Year householder moved into unit - Moved in 1999 to March 2000 (%) - Multirace
Year householder moved into unit - Moved in 1999 to March 2000 (%) - Other Race
Year householder moved into unit - Moved in 1995 to 1998 (%)
Year householder moved into unit - Moved in 1995 to 1998 (%) - White
Year householder moved into unit - Moved in 1995 to 1998 (%) - Black or African American
Year householder moved into unit - Moved in 1995 to 1998 (%) - Asian
Year householder moved into unit - Moved in 1995 to 1998 (%) - Hispanic or Latino
Year householder moved into unit - Moved in 1995 to 1998 (%) - American Indian and Alaska Native
Year householder moved into unit - Moved in 1995 to 1998 (%) - Multirace
Year householder moved into unit - Moved in 1995 to 1998 (%) - Other Race
Year householder moved into unit - Moved in 1990 to 1994 (%)
Year householder moved into unit - Moved in 1990 to 1994 (%) - White
Year householder moved into unit - Moved in 1990 to 1994 (%) - Black or African American
Year householder moved into unit - Moved in 1990 to 1994 (%) - Asian
Year householder moved into unit - Moved in 1990 to 1994 (%) - Hispanic or Latino
Year householder moved into unit - Moved in 1990 to 1994 (%) - American Indian and Alaska Native
Year householder moved into unit - Moved in 1990 to 1994 (%) - Multirace
Year householder moved into unit - Moved in 1990 to 1994 (%) - Other Race
Year householder moved into unit - Moved in 1980 to 1989 (%)
Year householder moved into unit - Moved in 1980 to 1989 (%) - White
Year householder moved into unit - Moved in 1980 to 1989 (%) - Black or African American
Year householder moved into unit - Moved in 1980 to 1989 (%) - Asian
Year householder moved into unit - Moved in 1980 to 1989 (%) - Hispanic or Latino
Year householder moved into unit - Moved in 1980 to 1989 (%) - American Indian and Alaska Native
Year householder moved into unit - Moved in 1980 to 1989 (%) - Multirace
Year householder moved into unit - Moved in 1980 to 1989 (%) - Other Race
Year householder moved into unit - Moved in 1970 to 1979 (%)
Year householder moved into unit - Moved in 1970 to 1979 (%) - White
Year householder moved into unit - Moved in 1970 to 1979 (%) - Black or African American
Year householder moved into unit - Moved in 1970 to 1979 (%) - Asian
Year householder moved into unit - Moved in 1970 to 1979 (%) - Hispanic or Latino
Year householder moved into unit - Moved in 1970 to 1979 (%) - American Indian and Alaska Native
Year householder moved into unit - Moved in 1970 to 1979 (%) - Multirace
Year householder moved into unit - Moved in 1970 to 1979 (%) - Other Race
Year householder moved into unit - Moved in 1969 or earlier (%)
Year householder moved into unit - Moved in 1969 or earlier (%) - White
Year householder moved into unit - Moved in 1969 or earlier (%) - Black or African American
Year householder moved into unit - Moved in 1969 or earlier (%) - Asian
Year householder moved into unit - Moved in 1969 or earlier (%) - Hispanic or Latino
Year householder moved into unit - Moved in 1969 or earlier (%) - American Indian and Alaska Native
Year householder moved into unit - Moved in 1969 or earlier (%) - Multirace
Year householder moved into unit - Moved in 1969 or earlier (%) - Other Race
Housing units lacking complete plumbing facilities (%)
Housing units lacking complete kitchen facilities (%)
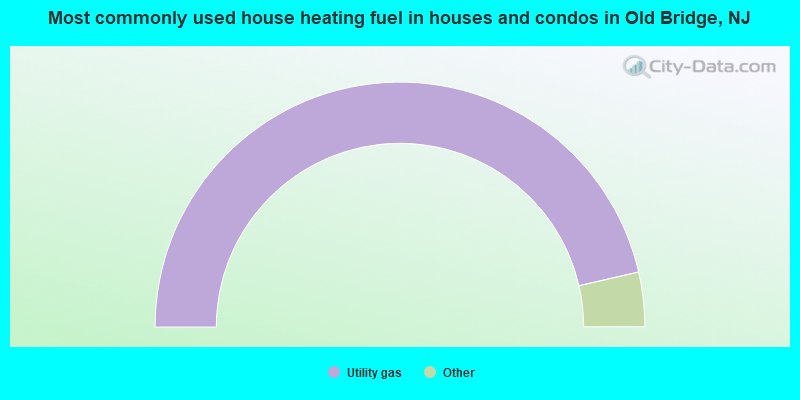
House heating fuel used in houses and condos - Utility gas (%)
House heating fuel used in houses and condos - Bottled, tank, or LP gas (%)
House heating fuel used in houses and condos - Electricity (%)
House heating fuel used in houses and condos - Fuel oil, kerosene, etc. (%)
House heating fuel used in houses and condos - Coal or coke (%)
House heating fuel used in houses and condos - Wood (%)
House heating fuel used in houses and condos - Solar energy (%)
House heating fuel used in houses and condos - Other fuel (%)
House heating fuel used in houses and condos - No fuel used (%)
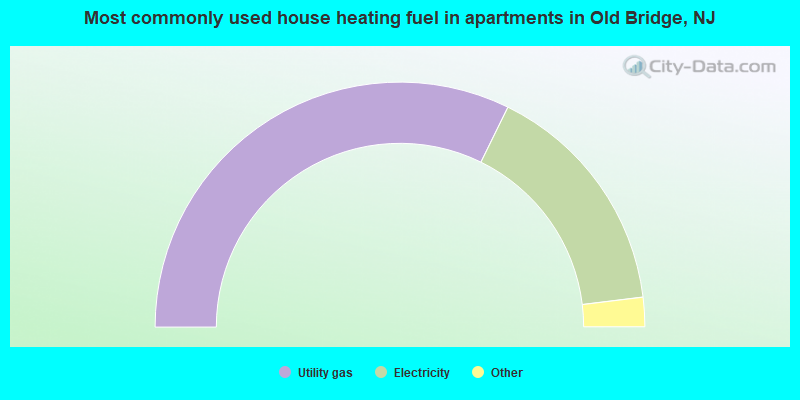
House heating fuel used in apartments - Utility gas (%)
House heating fuel used in apartments - Bottled, tank, or LP gas (%)
House heating fuel used in apartments - Electricity (%)
House heating fuel used in apartments - Fuel oil, kerosene, etc. (%)
House heating fuel used in apartments - Coal or coke (%)
House heating fuel used in apartments - Wood (%)
House heating fuel used in apartments - Solar energy (%)
House heating fuel used in apartments - Other fuel (%)
House heating fuel used in apartments - No fuel used (%)
Median year house/condo built: 1969Median year apartment built: 1970Household type by relationship:
Households: 28,135
Male householders: 5,579 (1,031 living alone ), Female householders: 4,905 (1,644 living alone )6,379 spouses (6,243 opposite-sex spouses ), 474 unmarried partners , (474 opposite-sex unmarried partners ), 8,638 children (8,211 natural , 235 adopted , 192 stepchildren ), 312 grandchildren , 144 brothers or sisters , 767 parents , 224 foster children , 300 other relatives , 248 non-relatives In group quarters: 161
Size of family households: 2,693 2-persons , 1,901 3-persons , 1,895 4-persons , 485 5-persons , 316 6-persons , 157 7-or-more-persons .
Size of nonfamily households: 2,721 1-person , 421 2-persons , 27 3-persons .
4,186 married couples with children. single-parent households (131 men , 525 women ).
71.0% of residents of Old Bridge speak English at home. of residents speak Spanish at home (48% speak English very well , 30% speak English well , 19% speak English not well , 4% don't speak English at all ).of residents speak other Indo-European language at home (61% speak English very well , 26% speak English well , 12% speak English not well , 2% don't speak English at all ).of residents speak Asian or Pacific Island language at home (48% speak English very well , 36% speak English well , 12% speak English not well , 5% don't speak English at all ).of residents speak other language at home (78% speak English very well , 17% speak English well , 4% speak English not well ).
Foreign born population: 6,669 (23.7%)of them are naturalized citizens )
Median number of rooms in houses and condos:
Median number of rooms in apartments
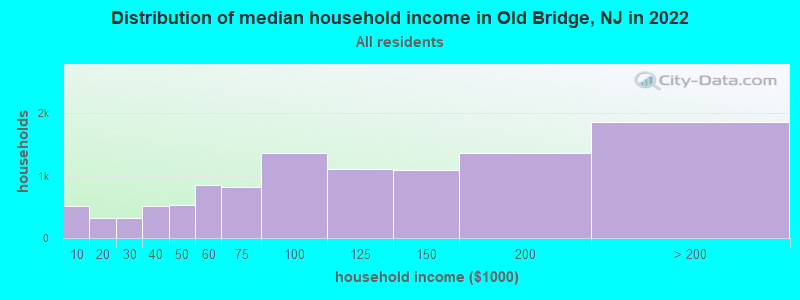
Old Bridge, NJ household income distribution 509 Less than $10,000314 $10,000 to $19,999317 $20,000 to $29,999516 $30,000 to $39,999522 $40,000 to $49,999856 $50,000 to $59,999813 $60,000 to $74,9991,358 $75,000 to $99,9991,107 $100,000 to $124,9991,085 $125,000 to $149,9991,370 $150,000 to $199,9991,863 $200,000 or more
Home value of owner - occupied houses in 2022 in Old Bridge, NJ 85 Less than $10,0009 $25,000 to $29,9996 $30,000 to $34,99914 $35,000 to $39,99977 $40,000 to $49,99915 $50,000 to $59,9997 $60,000 to $69,9996 $90,000 to $99,99920 $150,000 to $174,99920 $175,000 to $199,999233 $200,000 to $249,999237 $250,000 to $299,9991,733 $300,000 to $399,9992,896 $400,000 to $499,9992,525 $500,000 to $749,999224 $750,000 to $999,99911 $1,500,000 to $1,999,9991 $2,000,000 or moreRent paid by renters in 2022 in Old Bridge, NJ 21 $100 to $14973 $150 to $199156 $200 to $2495 $250 to $29928 $300 to $34988 $350 to $3994 $400 to $44994 $500 to $54918 $550 to $59917 $600 to $649149 $700 to $7498 $750 to $79927 $800 to $89977 $900 to $999823 $1,000 to $1,249496 $1,250 to $1,499599 $1,500 to $1,999150 $2,000 to $2,49924 $2,500 to $2,99914 $3,000 to $3,49981 No cash rent
Percentage of workers working in this county: 53.7%Number of people working at home: 1,830 (12.4% of all workers )
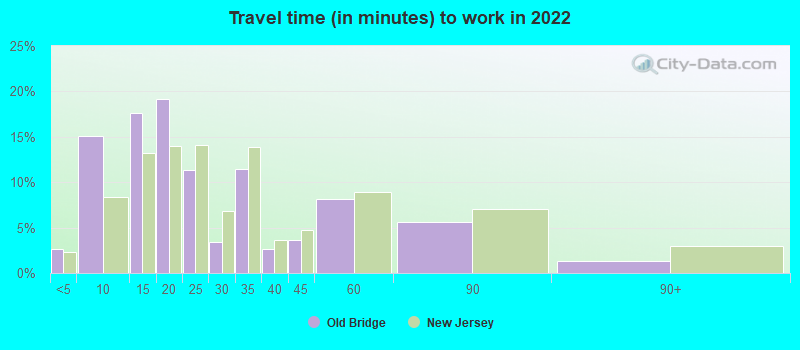
Travel time to work (commute)
Less than 5 minutes: 2035 to 9 minutes: 96910 to 14 minutes: 1,02615 to 19 minutes: 1,37820 to 24 minutes: 1,38325 to 29 minutes: 67730 to 34 minutes: 1,79835 to 39 minutes: 52040 to 44 minutes: 72045 to 59 minutes: 1,45960 to 89 minutes: 1,34690 or more minutes: 997
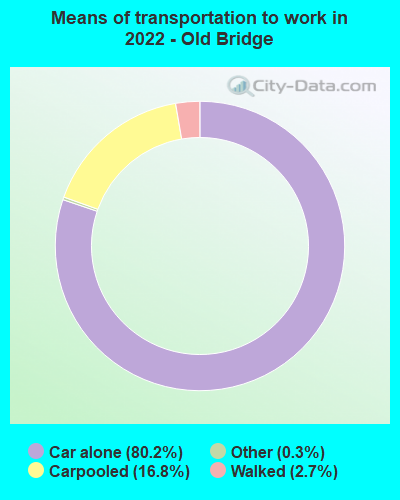
Means of transportation to work:
Drove a car alone: 3,357 (55.7%)Carpooled: 834 (13.8%)Taxi: 14 (0.2%)Walked: 166 (2.8%)Worked at home: 1,830 (30.4%)
Unemployment by race in 2022
Unemployment rate for White non-Hispanic residents 4.5% Males4.6% FemalesUnemployment rate for Black residents 9.4% Males5.8% FemalesUnemployment rate for Asian residents 5.9% Males0.7% FemalesUnemployment rate for other race residents 2.8% FemalesUnemployment rate for two or more race residents 22.2% Males8.3% FemalesUnemployment rate for Hispanic or Latino residents 5.5% Males3.5% Females
Year of entry for the foreign-born population in Old Bridge, New Jersey
1,010 2010 or later 1,592 2000 to 2009 1,823 1990 to 1999 1,134 1980 to 1989 704 1970 to 1979 760 Before 1970
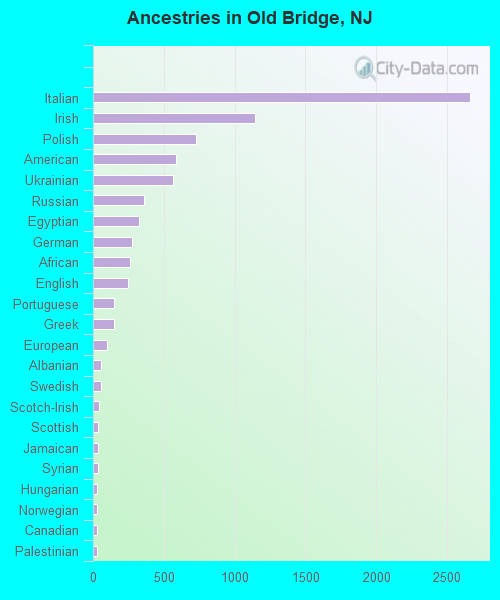
First ancestries reported:
Italian: 2,665 (19.4%)
Irish: 1,147 (8.3%)
Polish: 727 (5.3%)
American: 590 (4.3%)
Ukrainian: 564 (4.1%)
Russian: 361 (2.6%)
Egyptian: 325 (2.4%)
German: 275 (2.0%)
African: 260 (1.9%)
English: 246 (1.8%)
Portuguese: 146 (1.1%)
Greek: 146 (1.1%)
European: 100 (0.7%)
Albanian: 57 (0.4%)
Swedish: 56 (0.4%)
Scotch-Irish: 43 (0.3%)
Scottish: 38 (0.3%)
Jamaican: 34 (0.2%)
Syrian: 33 (0.2%)
Hungarian: 31 (0.2%)
Norwegian: 31 (0.2%)
Canadian: 30 (0.2%)
Palestinian: 29 (0.2%)
Romanian: 24 (0.2%)
Slovak: 24 (0.2%)
Israeli: 22 (0.2%)
Czech: 20 (0.1%)
Trinidadian and Tobagonian: 15 (0.1%)
Pennsylvania German: 12 (0.09%)
Eastern European: 11 (0.08%)
British West Indian: 11 (0.08%)
British: 10 (0.07%)
Guyanese: 10 (0.07%)
Czechoslovakian: 9 (0.07%)
Dutch: 9 (0.07%)
Slavic: 8 (0.06%)
Kenyan: 8 (0.06%)
French: 6 (0.04%)
Danish: 4 (0.03%) Most common places of birth for foreign-born residents (%): India Old Bridge:
20.8% (1,353)New Jersey:
12.8% (274,609)
Mexico Old Bridge:
7.4% (482)New Jersey:
4.8% (102,527)
Ukraine Old Bridge:
7.3% (475)New Jersey:
1.1% (22,760)
Dominican Republic Old Bridge:
6.0% (390)New Jersey:
9.7% (209,055)
Poland Old Bridge:
5.6% (362)New Jersey:
2.3% (48,811)
Russia Old Bridge:
3.5% (227)New Jersey:
0.9% (20,371)
Korea Old Bridge:
3.5% (225)New Jersey:
3.3% (70,512)
Egypt Old Bridge:
3.2% (208)New Jersey:
1.6% (33,678)
Philippines Old Bridge:
2.7% (177)New Jersey:
4.0% (85,934)
China, excluding Hong Kong and Taiwan Old Bridge:
2.6% (169)New Jersey:
3.7% (78,969)
Moldova Old Bridge:
2.5% (162)New Jersey:
0.1% (2,316)
Sierra Leone Old Bridge:
2.4% (157)New Jersey:
0.1% (2,373)
Vietnam Old Bridge:
2.3% (147)New Jersey:
0.7% (15,644)
Pakistan Old Bridge:
2.1% (134)New Jersey:
1.3% (27,580)
Guyana Old Bridge:
1.9% (124)New Jersey:
1.2% (26,173)
Canada Old Bridge:
1.7% (109)New Jersey:
0.9% (18,317)
Ecuador Old Bridge:
1.6% (105)New Jersey:
4.4% (95,275)
Place of birth for U.S.-born residents:
This state: 11,793Other state: 9,118Northeast: 8,615Midwest: 226South: 221West: 126 95.9% of Old Bridge residents lived in the same house 1 years ago.
Out of people who lived in different houses, 27.5% lived in this county.
Out of people who lived in different counties, 25.5% lived in New Jersey.
Old Bridge:
95.9%State average:
90.4%
Education attainment for males 25 years and older:
No schooling: 209Nursery to 4th grade: 415th and 6th grade: 227th and 8th grade: 389th grade: 7110th grade: 10011th grade: 2412th grade, no diploma: 217High school graduate (or equivalency): 2,951Less than 1 year of college: 490Some college more than 1 year, no degree: 1,127Associate degree: 964Bachelor's degree: 2,654Master's degree: 848Professional school degree: 206Doctorate degree: 49
Education attainment for females 25 years and older:
No schooling: 244Nursery to 4th grade: 275th and 6th grade: 357th and 8th grade: 549th grade: 4210th grade: 3911th grade: 8812th grade, no diploma: 207High school graduate (or equivalency): 2,746Less than 1 year of college: 811Some college more than 1 year, no degree: 1,078Associate degree: 1,055Bachelor's degree: 2,481Master's degree: 1,414Professional school degree: 275Doctorate degree: 35
Housing units in structures:
One, detached: 7,552One, attached: 598Two: 1073 or 4: 8775 to 9: 15810 to 19: 58920 to 49: 15050 or more: 719Mobile homes: 5Housing units lacking complete kitchen facilities in 2022: 0.5%House/condo owner moved in on average 20 years ago
Renter moved in on average 3 years ago
Private vs. public school enrollment:
Students in private schools in grades 1 to 8 (elementary and middle school): 147 Here:
6.2%New Jersey:
12.3%
Students in private schools in grades 9 to 12 (high school): 260 Here:
16.0%New Jersey:
13.1%
Students in private undergraduate colleges: 450 Here:
29.3%New Jersey:
33.2%