Oberlin, OH (Ohio) Houses and Residents
| Oberlin: | $199,174 |
| Ohio: | $204,100 |
Total population: 8,251 (Urban population: 8,047, Rural population: 210 (all nonfarm))
Houses: 2,787 (2,501 occupied: 1,257 owner occupied, 1,245 renter occupied)
| % of renters here: | 50% |
| State: | 33% |
Housing density: 636 houses/condos per square mile
Median price asked for vacant for-sale houses and condos in 2022 in this county: $147,194.
Median contract rent in 2022: $822 (lower quartile is $608, upper quartile is $1,341)
Median rent asked for vacant for-rent units in 2022: $680
Median gross rent in Oberlin, OH in 2022: $963
Housing units in Oberlin with a mortgage: 790 (43 second mortgage, 0 home equity loan, 35 both second mortgage and home equity loan)
Houses without a mortgage: 30
Median household income for houses/condos with a mortgage: $93,007
Median household income for apartments without a mortgage: $93,213
Median monthly housing costs: $934
Compare current foreclosures near Oberlin, OH:
| Photo | Address | Area | Beds / Baths | Price | Details |
|---|---|---|---|---|---|

|
#1
E Lorain St
Oberlin, OH 44074
|
1,523 sq. feet
|
1 baths 4 beds |
$69,900
|
show details |

|
#2
S Pleasant St
Oberlin, OH 44074
|
1,440 sq. feet
|
1 baths 3 beds |
show details | |

|
#3
Kimberly Cir
Oberlin, OH 44074
|
936 sq. feet
|
1 baths 3 beds |
show details | |

|
#4
Quarry Rd
Oberlin, OH 44074
|
1,232 sq. feet
|
2 baths 3 beds |
show details | |

|
#5
Elm St
Oberlin, OH 44074
|
1,325 sq. feet
|
1 baths 3 beds |
show details | |

|
#6
Butternut Ridge Rd
Oberlin, OH 44074
|
1,932 sq. feet
|
3 baths 3 beds |
show details | |

|
#7
S Pleasant St
Oberlin, OH 44074
|
1,953 sq. feet
|
1 baths 3 beds |
show details | |

|
#8
E Lorain St Apt D
Oberlin, OH 44074
|
- sq. feet
|
- baths - beds |
show details | |

|
#9
Us Highway 20
Oberlin, OH 44074
|
- sq. feet
|
- baths - beds |
show details | |

|
#10
Sumner St
Oberlin, OH 44074
|
- sq. feet
|
- baths - beds |
show details |
| Photo | Address | Area | Beds / Baths | Price | Details |
|---|---|---|---|---|---|

|
#11
E Hamilton St
Oberlin, OH 44074
|
- sq. feet
|
- baths - beds |
show details | |

|
#12
E Vine St Apt 301
Oberlin, OH 44074
|
- sq. feet
|
- baths - beds |
show details | |

|
#13
Maple St Apt F50
Oberlin, OH 44074
|
- sq. feet
|
- baths - beds |
show details | |

|
#14
Stag Horn Lane
Lorain, OH 44053
|
3,028 sq. feet
|
3 baths 4 beds |
$439,900
|
show details |

|
#15
Denison Ave
Elyria, OH 44035
|
875 sq. feet
|
1 baths 3 beds |
$149,900
|
show details |

|
#16
Sugar Ridge Rd
North Ridgeville, OH 44039
|
1,823 sq. feet
|
2 baths 4 beds |
$354,900
|
show details |

|
#17
Oakhill Blvd Apt 304
Lorain, OH 44053
|
1,452 sq. feet
|
3 baths 2 beds |
$149,900
|
show details |

|
#18
E Lake Ct
Lagrange, OH 44050
|
1,317 sq. feet
|
1 baths 3 beds |
$44,900
|
show details |

|
#19
Vineyard Dr
Lorain, OH 44053
|
1,920 sq. feet
|
3 baths 4 beds |
show details | |

|
#20
Julia Ave
Avon, OH 44011
|
1,185 sq. feet
|
1 baths 3 beds |
show details |
| Photo | Address | Area | Beds / Baths | Price | Details |
|---|---|---|---|---|---|

|
#21
Woodworth Dr
Lorain, OH 44053
|
2,180 sq. feet
|
3 baths 4 beds |
show details | |

|
#22
Barton Rd
North Ridgeville, OH 44039
|
1,910 sq. feet
|
2 baths 4 beds |
show details | |

|
#23
W 38th St
Lorain, OH 44052
|
1,134 sq. feet
|
1 baths 3 beds |
show details | |

|
#24
Woodworth Dr
Lorain, OH 44053
|
2,220 sq. feet
|
3 baths 4 beds |
show details | |

|
#25
Barton Rd Unit 301
North Olmsted, OH 44070
|
1,247 sq. feet
|
2 baths 3 beds |
show details | |

|
#26
Crestview Dr
Elyria, OH 44035
|
2,376 sq. feet
|
2 baths 3 beds |
show details | |

|
#27
Miami Ave
Lorain, OH 44053
|
1,552 sq. feet
|
2 baths 3 beds |
show details | |

|
#28
Timber Trail Dr
North Olmsted, OH 44070
|
1,662 sq. feet
|
2 baths 3 beds |
show details | |

|
#29
State Route 18
Norwalk, OH 44857
|
2,212 sq. feet
|
3 baths 4 beds |
show details | |

|
#30
Redwood Dr
Sheffield Lake, OH 44054
|
1,676 sq. feet
|
2 baths 4 beds |
show details |
| Photo | Address | Area | Beds / Baths | Price | Details |
|---|---|---|---|---|---|

|
#31
Rosewood St
Elyria, OH 44035
|
1,632 sq. feet
|
1 baths 3 beds |
show details | |

|
#32
Josephine Dr
North Olmsted, OH 44070
|
2,632 sq. feet
|
3 baths 4 beds |
show details | |

|
#33
W 40th St
Lorain, OH 44053
|
1,560 sq. feet
|
2 baths 4 beds |
show details | |

|
#34
Dellwood Rd
Grafton, OH 44044
|
1,760 sq. feet
|
2 baths 3 beds |
show details | |

|
#35
High Ct
Lorain, OH 44055
|
676 sq. feet
|
1 baths 2 beds |
show details | |

|
#36
Edgewood Dr
Lorain, OH 44053
|
2,462 sq. feet
|
3 baths 4 beds |
show details | |

|
#37
Salem Ave
Elyria, OH 44035
|
1,345 sq. feet
|
2 baths 3 beds |
show details | |

|
#38
Watson Ct
Lorain, OH 44053
|
1,485 sq. feet
|
2 baths 4 beds |
show details | |

|
#39
Birchview Dr
Vermilion, OH 44089
|
1,134 sq. feet
|
2 baths 3 beds |
show details | |

|
#40
Seneca Ave
Lorain, OH 44055
|
1,392 sq. feet
|
1 baths 3 beds |
show details |
| Photo | Address | Area | Beds / Baths | Price | Details |
|---|---|---|---|---|---|

|
#41
Norfolk Ave
Lorain, OH 44055
|
912 sq. feet
|
1 baths 3 beds |
show details | |

|
#42
E 40th St
Lorain, OH 44055
|
1,860 sq. feet
|
3 baths 4 beds |
show details | |

|
#43
Elm Rd
Grafton, OH 44044
|
1,702 sq. feet
|
1 baths 3 beds |
show details | |

|
#44
Carleen Ave
Avon, OH 44011
|
975 sq. feet
|
1 baths 3 beds |
show details | |

|
#45
Schady Rd
Olmsted Falls, OH 44138
|
2,264 sq. feet
|
3 baths 4 beds |
show details | |

|
#46
Park Dr
Lorain, OH 44052
|
2,218 sq. feet
|
2 baths 3 beds |
show details | |

|
#47
Albany Ave
Lorain, OH 44055
|
936 sq. feet
|
2 baths 3 beds |
show details | |

|
#48
Meister Rd
Lorain, OH 44052
|
1,464 sq. feet
|
1 baths 3 beds |
show details | |

|
#49
Abbe Rd N
Elyria, OH 44035
|
1,656 sq. feet
|
2 baths 3 beds |
show details | |

|
Check over 1 million property listings on Foreclosure.com!
|
browse all offers | |||

Latest news about housing in Oberlin, OH collected exclusively by city-data.com from local newspapers, TV, and radio stations

 | Oberlin Question (12 replies) |
| Ohio, better or worse with no true major city? (107 replies) |
| Liberal, Affordable Places to Rent in Ohio (11 replies) |
| When will the Great Climate Migration to Ohio begin in full force? (323 replies) |
| Eastlake vs Amhurst? please rate and compare... (28 replies) |
| Relocating to Small Town Ohio (37 replies) |

Median year apartment built: 1970
Household type by relationship:
Households: 8,276- Male householders: 1,008 (220 living alone), Female householders: 1,480 (700 living alone)
1,086 spouses (1,078 opposite-sex spouses), 111 unmarried partners, (101 opposite-sex unmarried partners), 1,050 children (972 natural, 48 adopted, 29 stepchildren), 174 grandchildren, 35 brothers or sisters, 24 parents, 0 foster children, 15 other relatives, 642 non-relatives
- In group quarters: 2,647
Size of family households: 876 2-persons, 194 3-persons, 168 4-persons, 33 5-persons, 23 6-persons, 1 7-or-more-persons.
Size of nonfamily households: 949 1-person, 96 2-persons, 96 3-persons, 84 4-persons.
350 married couples with children.
205 single-parent households (23 men, 182 women).
89.8% of residents of Oberlin speak English at home.
3.6% of residents speak Spanish at home (51% speak English very well, 28% speak English well, 20% speak English not well).
4.4% of residents speak other Indo-European language at home (86% speak English very well, 12% speak English well, 2% speak English not well).
2.1% of residents speak Asian or Pacific Island language at home (69% speak English very well, 17% speak English well, 15% speak English not well).
0.4% of residents speak other language at home (100% speak English very well).
Foreign born population: 439 (5.3%)
(43.3% of them are naturalized citizens)
| Here: | 6.9 |
| State: | 6.7 |
| Here: | 4.1 |
| State: | 4.4 |

- Bedrooms in owner-occupied houses and condos in Oberlin, Ohio
- 0no bedroom
- 141 bedroom
- 1982 bedrooms
- 6873 bedrooms
- 2924 bedrooms
- 675+ bedrooms

- Bedrooms in renter-occupied apartments in Oberlin, Ohio
- 82no bedroom
- 4261 bedroom
- 3232 bedrooms
- 2793 bedrooms
- 1254 bedrooms
- 105+ bedrooms

- Cars and other vehicles available in Oberlin in owner-occupied houses/condos
- 0no vehicle
- 5121 vehicle
- 5462 vehicles
- 1723 vehicles
- 284 vehicles
- 05+ vehicles

- Cars and other vehicles available in Oberlin in renter-occupied apartments
- 181no vehicle
- 8261 vehicle
- 2062 vehicles
- 333 vehicles
- 04 vehicles
- 05+ vehicles

- Rooms in owner-occupied houses in Oberlin, Ohio
- 01 room
- 72 rooms
- 03 rooms
- 214 rooms
- 1665 rooms
- 2546 rooms
- 4157 rooms
- 1348 rooms
- 2619+ rooms

- Rooms in renter-occupied apartments in Oberlin, Ohio
- 561 room
- 932 rooms
- 2463 rooms
- 2794 rooms
- 2645 rooms
- 1566 rooms
- 497 rooms
- 388 rooms
- 649+ rooms


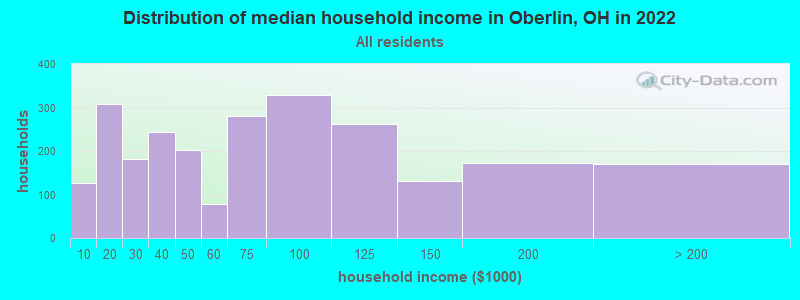
Oberlin, OH household income distribution

- 126Less than $10,000
- 307$10,000 to $19,999
- 182$20,000 to $29,999
- 243$30,000 to $39,999
- 202$40,000 to $49,999
- 78$50,000 to $59,999
- 280$60,000 to $74,999
- 329$75,000 to $99,999
- 261$100,000 to $124,999
- 132$125,000 to $149,999
- 173$150,000 to $199,999
- 171$200,000 or more
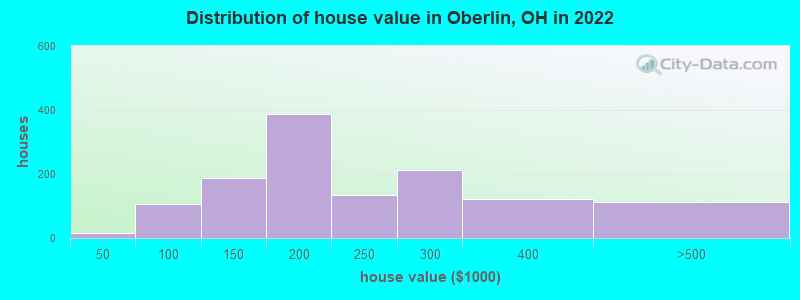
Home value of owner - occupied houses in 2022 in Oberlin, OH
-
- 12Less than $10,000
- 3$15,000 to $19,999
- 5$50,000 to $59,999
- 7$60,000 to $69,999
- 28$70,000 to $79,999
- 55$80,000 to $89,999
- 9$90,000 to $99,999
- 134$100,000 to $124,999
- 52$125,000 to $149,999
- 235$150,000 to $174,999
- 151$175,000 to $199,999
- 133$200,000 to $249,999
- 212$250,000 to $299,999
- 121$300,000 to $399,999
- 112$400,000 to $499,999
Rent paid by renters in 2022 in Oberlin, OH
-
- 8$200 to $249
- 32$250 to $299
- 52$300 to $349
- 12$350 to $399
- 12$500 to $549
- 87$550 to $599
- 61$600 to $649
- 23$650 to $699
- 156$700 to $749
- 39$750 to $799
- 95$800 to $899
- 93$900 to $999
- 51$1,000 to $1,249
- 113$1,250 to $1,499
- 56$1,500 to $1,999
- 30$2,000 to $2,499
- 14$3,000 to $3,499
- 292$3,500 or more
- 130No cash rent


Percentage of workers working in this county: 83.9%
Number of people working at home: 686 (18.2% of all workers)
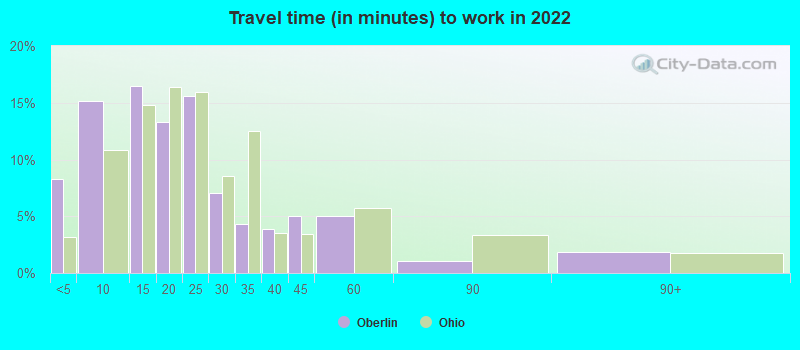
Travel time to work (commute)
- Less than 5 minutes: 426
- 5 to 9 minutes: 638
- 10 to 14 minutes: 512
- 15 to 19 minutes: 278
- 20 to 24 minutes: 273
- 25 to 29 minutes: 79
- 30 to 34 minutes: 257
- 35 to 39 minutes: 76
- 40 to 44 minutes: 165
- 45 to 59 minutes: 131
- 60 to 89 minutes: 64
- 90 or more minutes: 25
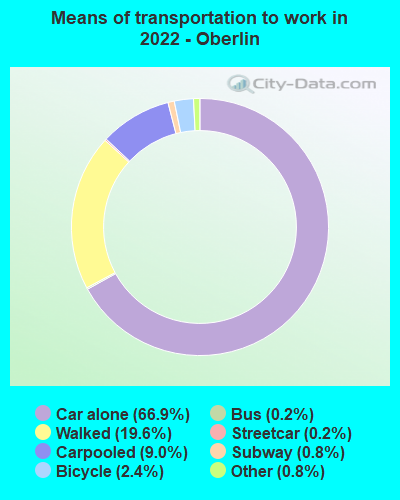
Means of transportation to work:
- Drove a car alone: 3,655 (59.2%)
- Carpooled: 452 (7.3%)
- Bus: 10 (0.2%)
- Subway or elevated rail: 10 (0.2%)
- Long-distance train or commuter rail: 41 (0.7%)
- Light rail, streetcar or trolley: 5 (0.1%)
- Taxi: 40 (0.6%)
- Bicycle: 137 (2.2%)
- Walked: 886 (14.3%)
- Worked at home: 686 (11.1%)

- Unemployment by race in 2022
- Unemployment rate for White non-Hispanic residents
- 3.9%Males
- 4.9%Females
- Unemployment rate for two or more race residents
- 4.6%Males
- 13.7%Females
- Unemployment rate for Hispanic or Latino residents
- 6.6%Males
- 25.4%Females

- Year of entry for the foreign-born population in Oberlin, Ohio
- 2762010 or later
- 342000 to 2009
- 911990 to 1999
- 951980 to 1989
- 521970 to 1979
- 92Before 1970

First ancestries reported:
- English: 547 (14.5%)
- American: 438 (11.6%)
- German: 430 (11.4%)
- Irish: 411 (10.9%)
- Italian: 142 (3.8%)
- Polish: 83 (2.2%)
- European: 57 (1.5%)
- Scottish: 55 (1.5%)
- Scotch-Irish: 53 (1.4%)
- Russian: 37 (1.0%)
- Kenyan: 35 (0.9%)
- African: 33 (0.9%)
- Nigerian: 31 (0.8%)
- Ukrainian: 22 (0.6%)
- Hungarian: 19 (0.5%)
- Czech: 17 (0.5%)
- Eastern European: 16 (0.4%)
- Romanian: 15 (0.4%)
- Afghan: 13 (0.3%)
- British: 12 (0.3%)
- Scandinavian: 8 (0.2%)
- Slovak: 7 (0.2%)
- French: 7 (0.2%)
- Croatian: 6 (0.2%)
- Serbian: 6 (0.2%)
- Slovene: 6 (0.2%)
- Turkish: 6 (0.2%)
- Danish: 5 (0.1%)
- Greek: 5 (0.1%)
- Lithuanian: 4 (0.1%)
- Czechoslovakian: 3 (0.08%)
- Slavic: 3 (0.08%)
- South African: 3 (0.08%)
Most common places of birth for foreign-born residents (%):
| Oberlin: | 12.3% (60) |
| Ohio: | 6.2% (35,703) |
| Oberlin: | 10.0% (49) |
| Ohio: | 1.0% (5,553) |
| Oberlin: | 8.0% (39) |
| Ohio: | 0.5% (3,042) |
| Oberlin: | 7.4% (36) |
| Ohio: | 2.2% (12,846) |
| Oberlin: | 7.0% (34) |
| Ohio: | 11.6% (66,525) |
| Oberlin: | 6.8% (33) |
| Ohio: | 3.1% (17,818) |
| Oberlin: | 4.3% (21) |
| Ohio: | 2.6% (14,988) |
| Oberlin: | 4.1% (20) |
| Ohio: | 1.0% (5,674) |
| Oberlin: | 3.5% (17) |
| Ohio: | 0.7% (4,155) |
| Oberlin: | 3.3% (16) |
| Ohio: | 1.5% (8,452) |
| Oberlin: | 3.1% (15) |
| Ohio: | 0.9% (5,422) |
| Oberlin: | 3.1% (15) |
| Ohio: | 1.0% (5,979) |
| Oberlin: | 2.7% (13) |
| Ohio: | 0.2% (1,151) |
| Oberlin: | 2.7% (13) |
| Ohio: | 1.1% (6,346) |
| Oberlin: | 2.7% (13) |
| Ohio: | 0.1% (482) |
| Oberlin: | 2.0% (10) |
| Ohio: | 0.1% (700) |
| Oberlin: | 2.0% (10) |
| Ohio: | 2.0% (11,398) |
| Oberlin: | 2.0% (10) |
| Ohio: | 1.2% (6,679) |
| Oberlin: | 2.0% (10) |
| Ohio: | 0.3% (1,763) |
Place of birth for U.S.-born residents:
- This state: 3,930
- Other state: 3,981
- Northeast: 1,583
- Midwest: 794
- South: 1,138
- West: 469
71.3% of Oberlin residents lived in the same house 1 years ago.
Out of people who lived in different houses, 29.3% lived in this county.
Out of people who lived in different counties, 34.4% lived in Ohio.
| Oberlin: | 71.3% |
| State average: | 87.8% |
Education attainment for males 25 years and older:
- No schooling: 37
- Nursery to 4th grade: 0
- 5th and 6th grade: 0
- 7th and 8th grade: 6
- 9th grade: 2
- 10th grade: 0
- 11th grade: 4
- 12th grade, no diploma: 34
- High school graduate (or equivalency): 448
- Less than 1 year of college: 114
- Some college more than 1 year, no degree: 117
- Associate degree: 70
- Bachelor's degree: 403
- Master's degree: 503
- Professional school degree: 67
- Doctorate degree: 178

Education attainment for females 25 years and older:
- No schooling: 156
- Nursery to 4th grade: 0
- 5th and 6th grade: 0
- 7th and 8th grade: 0
- 9th grade: 16
- 10th grade: 5
- 11th grade: 11
- 12th grade, no diploma: 12
- High school graduate (or equivalency): 445
- Less than 1 year of college: 73
- Some college more than 1 year, no degree: 184
- Associate degree: 189
- Bachelor's degree: 503
- Master's degree: 581
- Professional school degree: 96
- Doctorate degree: 186


Housing units in structures:
- One, detached: 1,625
- One, attached: 226
- Two: 206
- 3 or 4: 319
- 5 to 9: 34
- 10 to 19: 67
- 20 to 49: 95
- 50 or more: 212
Housing units lacking complete kitchen facilities in 2022: 3.9%
House/condo owner moved in on average 18 years ago
Renter moved in on average 3 years ago

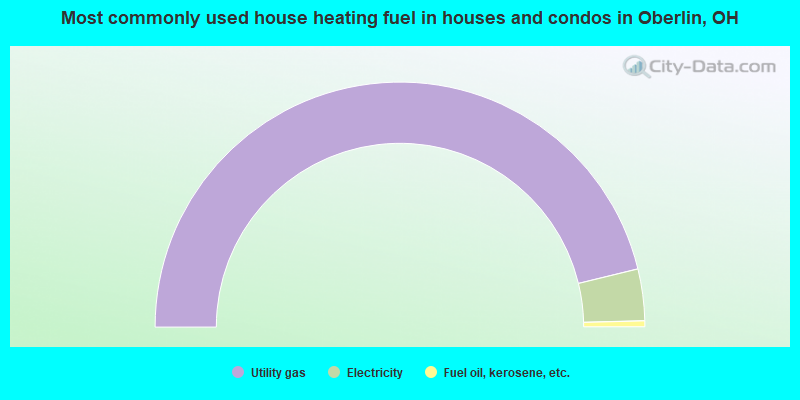
- 92.4%Utility gas
- 6.8%Electricity
- 0.8%Fuel oil, kerosene, etc.
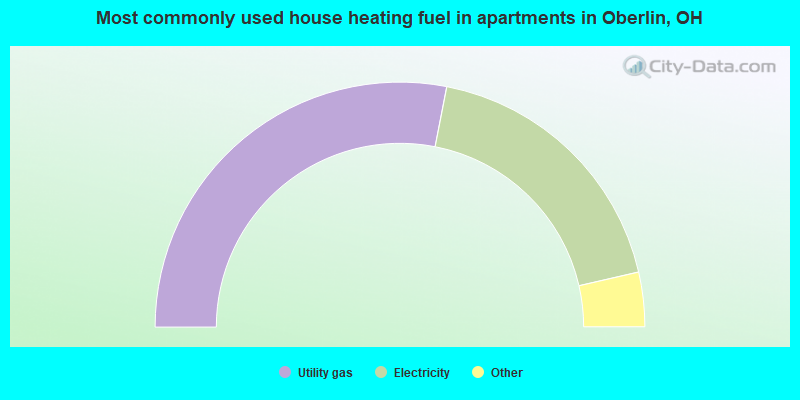
- 56.2%Utility gas
- 36.7%Electricity
- 4.0%Other fuel
- 2.4%No fuel used
- 0.7%Fuel oil, kerosene, etc.
Private vs. public school enrollment:
| Here: | 26.4% |
| Ohio: | 16.0% |
| Here: | 14.8% |
| Ohio: | 13.1% |
| Here: | 65.7% |
| Ohio: | 22.3% |


