Housing density: 711 houses/condos per square mile
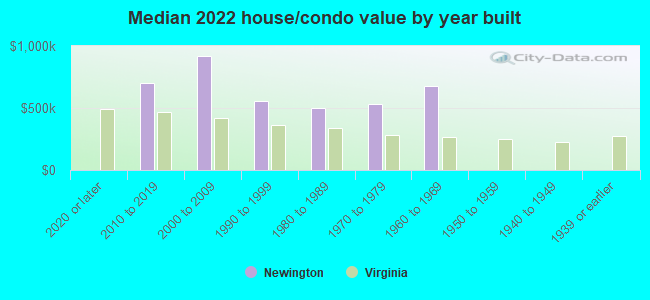
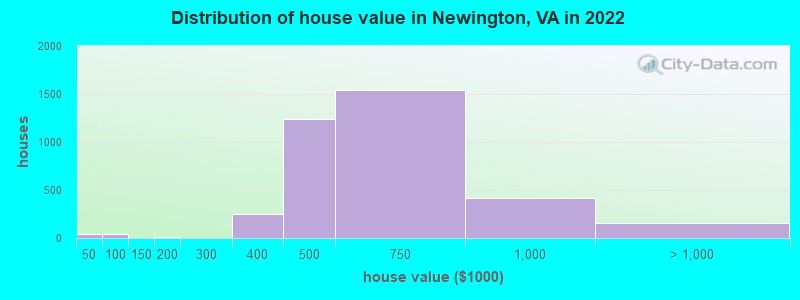
Median price asked for vacant for-sale houses and condos in 2022: $1,474,584.
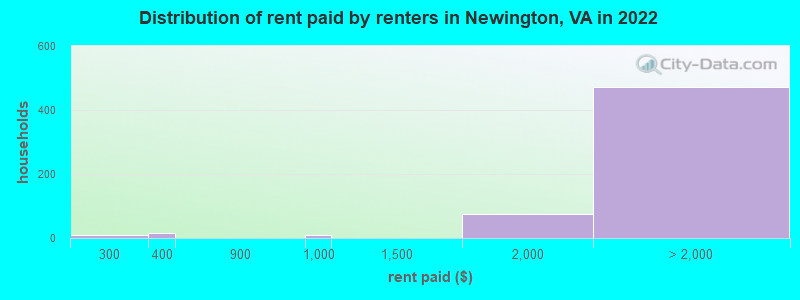
Median contract rent in 2022: over $2,000 (lower quartile is over $2,000, upper quartile is over $2,000)
Median rent asked for vacant for-rent units in 2022: $3,217
Median gross rent in Newington, VA in 2022: over $2,000
Housing units in Newington with a mortgage: 3,181 (291 second mortgage, 0 home equity loan, 264 both second mortgage and home equity loan) Houses without a mortgage: 121
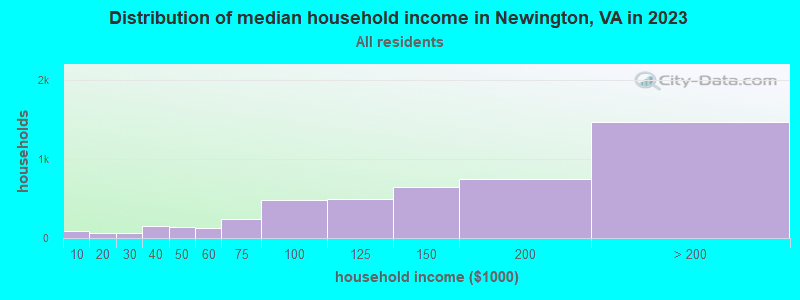
Median household income for houses/condos with a mortgage: $162,303
Median household income for apartments without a mortgage: $146,584
Median monthly housing costs: $2,443
Compare current foreclosures near Newington, VA:
#1
Backlick Rd, Unit 872
Newington, VA 22122
-
sq. feet
-
baths
-
beds
#2
$359,900
Wilson Ln Apt 204
Mc Lean, VA 22102
925
sq. feet
1
baths
2
beds
#3
$259,900
Cathedral Ave NW Apt 108
Washington, DC 20016
765
sq. feet
1
baths
1
beds
#4
$300,000
Henson Ln
Temple Hills, MD 20748
1,566
sq. feet
2
baths
3
beds
#5
$665,000
Monroe St NW
Washington, DC 20010
-
sq. feet
2
baths
2
beds
#6
$265,900
Crafford Pl
Fort Washington, MD 20744
1,890
sq. feet
1
baths
3
beds
#7
$179,900
Old Fort Rd
Fort Washington, MD 20744
721
sq. feet
1
baths
2
beds
#8
$395,000
17th St NW Apt 504
Washington, DC 20009
800
sq. feet
1
baths
1
beds
#9
$331,760
Snowflower Blvd
Oxon Hill, MD 20745
-
sq. feet
2
baths
3
beds
#10
$99,750
Wilson Bridge Dr Unit #6770 A-2
Oxon Hill, MD 20745
-
sq. feet
1
baths
1
beds
#11
$307,500
T St SE Apt 3
Washington, DC 20020
-
sq. feet
2
baths
4
beds
#12
$139,900
Delaware Ave SW Apt N720
Washington, DC 20024
-
sq. feet
1
baths
1
beds
#13
Oakwood St SE Apt B5
Washington, DC 20032
628
sq. feet
1
baths
1
beds
#14
Beechcliff Dr
Alexandria, VA 22306
2,365
sq. feet
3
baths
3
beds
#15
Yoakum Pkwy Apt 22304
Alexandria, VA 22304
1,098
sq. feet
2
baths
1
beds
#16
1st St NW Apt 10
Washington, DC 20001
551
sq. feet
1
baths
1
beds
#17
8th St NE
Washington, DC 20002
1,444
sq. feet
1
baths
3
beds
#18
Warner St NW
Washington, DC 20001
1,279
sq. feet
2
baths
3
beds
#19
Wilson Boulevard, Unit 101, Falls Church, Va 22044
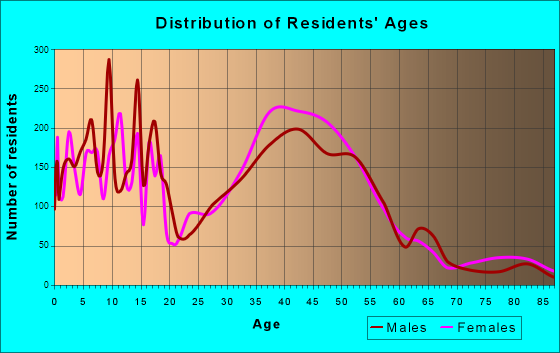
2,285 married couples with children.
468 single-parent households (127 men, 341 women).
64.6% of residents of Newington speak English at home.
15.2% of residents speak Spanish at home (65% speak English very well, 22% speak English well, 13% speak English not well).
6.4% of residents speak other Indo-European language at home (62% speak English very well, 28% speak English well, 6% speak English not well, 4% don't speak English at all).
7.4% of residents speak Asian or Pacific Island language at home (53% speak English very well, 30% speak English well, 16% speak English not well, 1% don't speak English at all).
6.3% of residents speak other language at home (74% speak English very well, 19% speak English well, 2% speak English not well, 5% don't speak English at all).
Foreign born population: 3,590 (26.6%)
(79.4% of them are naturalized citizens)
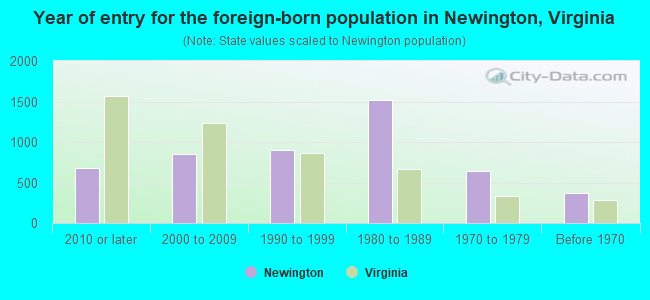
Year of entry for the foreign-born population in Newington, Virginia
6752010 or later
8462000 to 2009
9041990 to 1999
1,5141980 to 1989
6411970 to 1979
365Before 1970
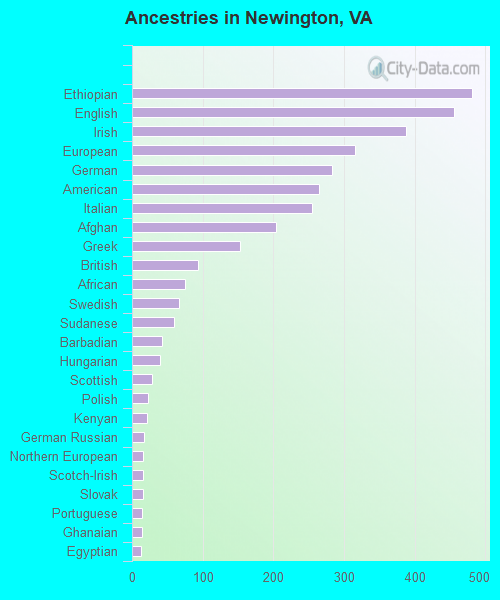
First ancestries reported:
Ethiopian: 481 (6.7%)
English: 455 (6.4%)
Irish: 388 (5.4%)
European: 315 (4.4%)
German: 283 (4.0%)
American: 264 (3.7%)
Italian: 254 (3.6%)
Afghan: 204 (2.9%)
Greek: 153 (2.1%)
British: 94 (1.3%)
African: 75 (1.1%)
Swedish: 66 (0.9%)
Sudanese: 59 (0.8%)
Barbadian: 42 (0.6%)
Hungarian: 40 (0.6%)
Scottish: 29 (0.4%)
Polish: 23 (0.3%)
Kenyan: 21 (0.3%)
German Russian: 17 (0.2%)
Northern European: 16 (0.2%)
Scotch-Irish: 15 (0.2%)
Slovak: 15 (0.2%)
Portuguese: 14 (0.2%)
Ghanaian: 14 (0.2%)
Egyptian: 13 (0.2%)
Belgian: 12 (0.2%)
Turkish: 12 (0.2%)
French: 10 (0.1%)
Czechoslovakian: 9 (0.1%)
Norwegian: 9 (0.1%)
Scandinavian: 9 (0.1%)
French Canadian: 8 (0.1%)
Lithuanian: 8 (0.1%)
Canadian: 7 (0.10%)
Ukrainian: 6 (0.08%)
Welsh: 6 (0.08%)
Dutch: 4 (0.06%)
Bulgarian: 3 (0.04%)
Most common places of birth for foreign-born residents (%):
Vietnam
Newington:
13.1% (469)
Virginia:
4.2% (45,750)
Honduras
Newington:
13.0% (465)
Virginia:
3.0% (32,892)
Ethiopia
Newington:
12.2% (438)
Virginia:
2.9% (32,082)
Philippines
Newington:
7.2% (259)
Virginia:
4.8% (52,629)
Afghanistan
Newington:
6.6% (238)
Virginia:
1.8% (19,426)
Peru
Newington:
6.1% (218)
Virginia:
2.4% (26,366)
El Salvador
Newington:
4.2% (151)
Virginia:
9.9% (107,534)
India
Newington:
4.0% (145)
Virginia:
9.0% (97,830)
Bangladesh
Newington:
3.7% (133)
Virginia:
1.1% (12,049)
Nicaragua
Newington:
3.3% (119)
Virginia:
0.6% (6,916)
Korea
Newington:
2.5% (91)
Virginia:
4.9% (52,857)
Ghana
Newington:
2.0% (72)
Virginia:
1.6% (17,346)
Sudan
Newington:
1.6% (59)
Virginia:
0.4% (4,442)
Eritrea
Newington:
1.6% (58)
Virginia:
0.3% (3,058)
Guatemala
Newington:
1.5% (54)
Virginia:
3.3% (35,938)
Place of birth for U.S.-born residents:
This state: 4,051
Other state: 5,397
Northeast: 1,789
Midwest: 738
South: 2,190
West: 682
88.6% of Newington residents lived in the same house 1 years ago. Out of people who lived in different houses, 30.5% lived in this county. Out of people who lived in different counties, 34.7% lived in Virginia.
Newington:
88.6%
State average:
86.6%
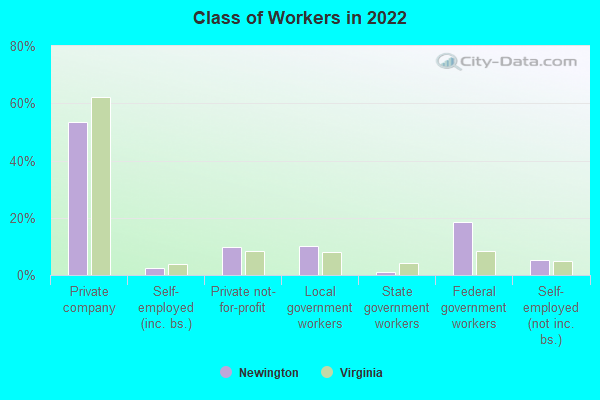
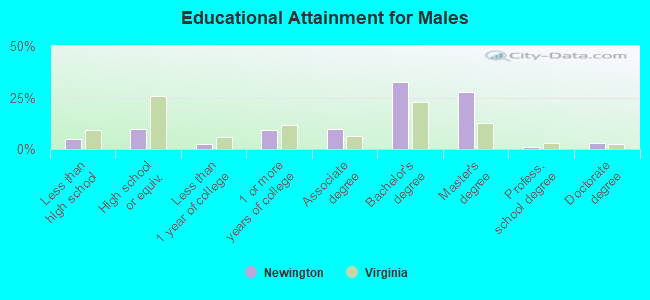
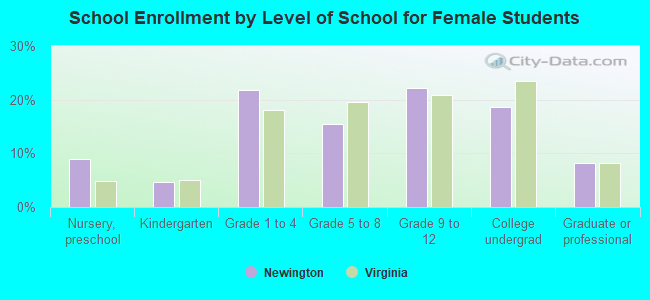
Education attainment for males 25 years and older:
No schooling: 113
Nursery to 4th grade: 0
5th and 6th grade: 0
7th and 8th grade: 0
9th grade: 7
10th grade: 14
11th grade: 75
12th grade, no diploma: 32
High school graduate (or equivalency): 453
Less than 1 year of college: 120
Some college more than 1 year, no degree: 433
Associate degree: 465
Bachelor's degree: 1,549
Master's degree: 1,307
Professional school degree: 45
Doctorate degree: 128
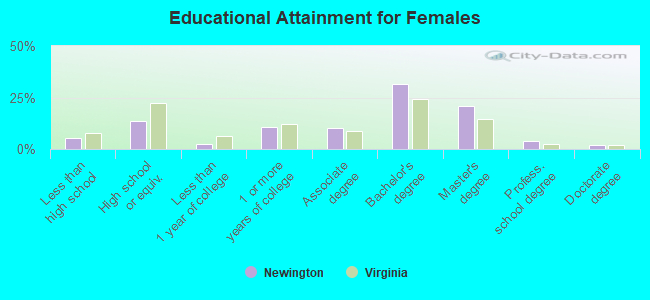
Education attainment for females 25 years and older:
No schooling: 73
Nursery to 4th grade: 69
5th and 6th grade: 51
7th and 8th grade: 0
9th grade: 0
10th grade: 7
11th grade: 9
12th grade, no diploma: 52
High school graduate (or equivalency): 643
Less than 1 year of college: 119
Some college more than 1 year, no degree: 503
Associate degree: 475
Bachelor's degree: 1,502
Master's degree: 989
Professional school degree: 178
Doctorate degree: 91
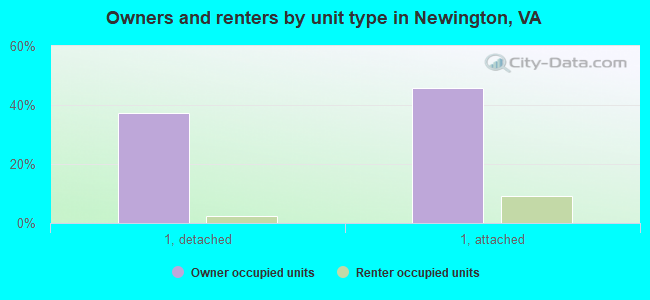
Housing units in structures:
One, detached: 1,868
One, attached: 2,762
3 or 4: 10
10 to 19: 66
50 or more: 14
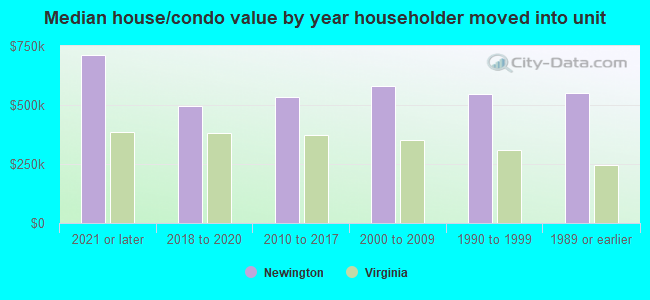
House/condo owner moved in on average 13 years ago