New Iberia, LA (Louisiana) Houses and Residents
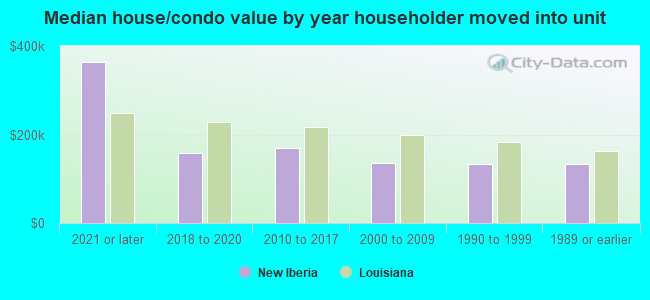
| New Iberia: | $146,548 |
| Louisiana: | $209,200 |
Total population: 30,745 (All urban)
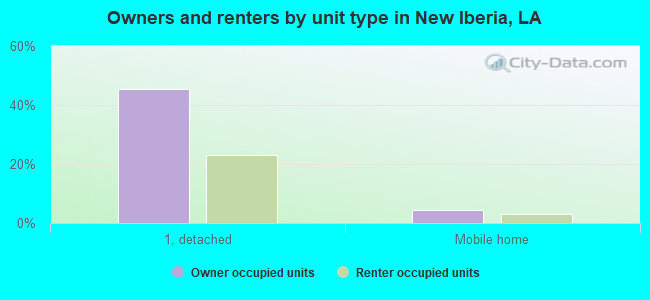
Houses: 13,459 (11,282 occupied: 5,945 owner occupied, 5,706 renter occupied)
| % of renters here: | 49% |
| State: | 32% |
Housing density: 1,274 houses/condos per square mile
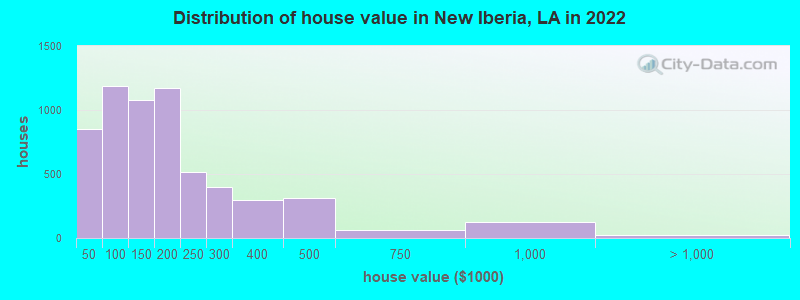
Median price asked for vacant for-sale houses and condos in 2022: $109,857.
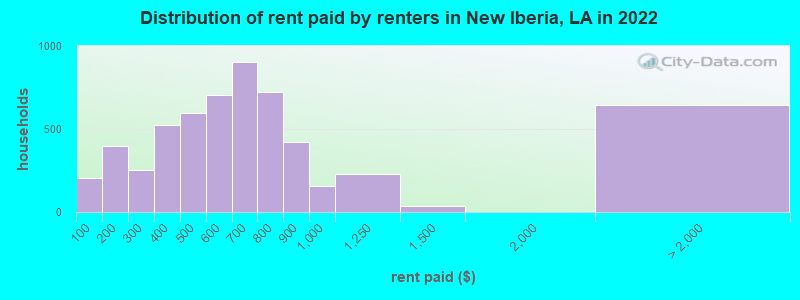
Median contract rent in 2022: $555 (lower quartile is $378, upper quartile is $627)
Median rent asked for vacant for-rent units in 2022: $424
Median gross rent in New Iberia, LA in 2022: $705
Housing units in New Iberia with a mortgage: 2,386 (373 second mortgage, 16 home equity loan, 283 both second mortgage and home equity loan)
Houses without a mortgage: 60
Median household income for houses/condos with a mortgage: $75,614
Median household income for apartments without a mortgage: $41,725
Median monthly housing costs: $684
Compare current foreclosures in New Iberia, LA:
| Photo | Address | Area | Beds / Baths | Price | Details |
|---|---|---|---|---|---|

|
#1
Johnson Aly
New Iberia, LA 70563
|
1,022 sq. feet
|
1 baths 2 beds |
$119,900
|
show details |

|
#2
Crochet Rd
New Iberia, LA 70563
|
1,810 sq. feet
|
2 baths 4 beds |
$299,900
|
show details |

|
#3
Astor Place Dr
New Iberia, LA 70563
|
2,903 sq. feet
|
2 baths 4 beds |
$415,000
|
show details |

|
#4
St
New Iberia, LA 70560
|
- sq. feet
|
- baths - beds |
$5,250
|
show details |

|
#5
B Henderson Aly
New Iberia, LA 70560
|
- sq. feet
|
- baths - beds |
$5,475
|
show details |

|
#6
Loop
New Iberia, LA 70560
|
- sq. feet
|
- baths - beds |
$5,475
|
show details |

|
#7
Saint Jude Ave
New Iberia, LA 70560
|
- sq. feet
|
- baths - beds |
$5,475
|
show details |

|
#8
Saint Jude Ave
New Iberia, LA 70560
|
- sq. feet
|
- baths - beds |
$5,475
|
show details |

|
#9
Ann St
New Iberia, LA 70560
|
- sq. feet
|
- baths - beds |
$5,250
|
show details |

|
#10
St
New Iberia, LA 70560
|
- sq. feet
|
- baths - beds |
$5,250
|
show details |
| Photo | Address | Area | Beds / Baths | Price | Details |
|---|---|---|---|---|---|

|
#11
E Saint Peter St
New Iberia, LA 70560
|
- sq. feet
|
- baths - beds |
$5,250
|
show details |

|
#12
Hortense St
New Iberia, LA 70563
|
- sq. feet
|
- baths - beds |
$5,250
|
show details |

|
#13
Paul St
New Iberia, LA 70560
|
- sq. feet
|
- baths - beds |
$5,250
|
show details |

|
#14
St
New Iberia, LA Array
|
- sq. feet
|
- baths - beds |
$5,475
|
show details |

|
#15
Corrine St
New Iberia, LA 70560
|
- sq. feet
|
- baths - beds |
$5,250
|
show details |

|
#16
St
New Iberia, LA 70560
|
- sq. feet
|
- baths - beds |
$5,250
|
show details |

|
#17
Rd
New Iberia, LA 70560
|
- sq. feet
|
- baths - beds |
$5,250
|
show details |

|
#18
Ann St
New Iberia, LA 70560
|
- sq. feet
|
- baths - beds |
$5,250
|
show details |

|
#19
Lee St
New Iberia, LA 70560
|
- sq. feet
|
- baths - beds |
$5,250
|
show details |

|
#20
Lee St
New Iberia, LA 70560
|
- sq. feet
|
- baths - beds |
$5,250
|
show details |
| Photo | Address | Area | Beds / Baths | Price | Details |
|---|---|---|---|---|---|

|
#21
St
New Iberia, LA Array
|
- sq. feet
|
- baths - beds |
$5,475
|
show details |

|
#22
Emery Lewis Ave
New Iberia, LA 70560
|
- sq. feet
|
- baths - beds |
$5,839
|
show details |

|
#23
Brian St
New Iberia, LA 70560
|
- sq. feet
|
- baths - beds |
$5,475
|
show details |

|
#24
Malain St
New Iberia, LA 70560
|
- sq. feet
|
- baths - beds |
$5,475
|
show details |

|
#25
Calhoun St
New Iberia, LA 70560
|
- sq. feet
|
- baths - beds |
$5,475
|
show details |

|
#26
W Washington St
New Iberia, LA 70560
|
- sq. feet
|
- baths - beds |
$5,475
|
show details |

|
#27
Dore Aly
New Iberia, LA 70560
|
- sq. feet
|
- baths - beds |
$5,475
|
show details |

|
#28
Anderson St
New Iberia, LA 70560
|
- sq. feet
|
- baths - beds |
$5,475
|
show details |

|
#29
W Pershing St
New Iberia, LA 70560
|
- sq. feet
|
- baths - beds |
$5,475
|
show details |

|
#30
Adam St
New Iberia, LA 70560
|
- sq. feet
|
- baths - beds |
$5,475
|
show details |
| Photo | Address | Area | Beds / Baths | Price | Details |
|---|---|---|---|---|---|

|
#31
Rosalie St
New Iberia, LA 70560
|
- sq. feet
|
- baths - beds |
$5,475
|
show details |

|
#32
Ann St
New Iberia, LA 70560
|
- sq. feet
|
- baths - beds |
$5,250
|
show details |

|
#33
W Pershing St
New Iberia, LA 70560
|
- sq. feet
|
- baths - beds |
$5,250
|
show details |

|
#34
Rosalie St
New Iberia, LA 70560
|
- sq. feet
|
- baths - beds |
$5,250
|
show details |

|
#35
Cherokee St
New Iberia, LA 70560
|
- sq. feet
|
- baths - beds |
$5,250
|
show details |

|
#36
W Washington St
New Iberia, LA 70560
|
- sq. feet
|
- baths - beds |
$5,620
|
show details |

|
#37
Ann St
New Iberia, LA 70560
|
- sq. feet
|
- baths - beds |
$5,250
|
show details |

|
#38
Mississippi St
New Iberia, LA 70560
|
- sq. feet
|
- baths - beds |
$5,250
|
show details |

|
#39
Field St
New Iberia, LA 70560
|
- sq. feet
|
- baths - beds |
$5,475
|
show details |

|
#40
Ave
New Iberia, LA 70560
|
- sq. feet
|
- baths - beds |
$5,475
|
show details |
| Photo | Address | Area | Beds / Baths | Price | Details |
|---|---|---|---|---|---|

|
#41
St
New Iberia, LA 70563
|
- sq. feet
|
- baths - beds |
$5,475
|
show details |

|
#42
Saint Mary St
New Iberia, LA 70560
|
- sq. feet
|
- baths - beds |
$5,250
|
show details |

|
#43
Field St
New Iberia, LA 70560
|
- sq. feet
|
- baths - beds |
$5,475
|
show details |

|
#44
Breaux Aly
New Iberia, LA 70560
|
- sq. feet
|
- baths - beds |
$5,250
|
show details |

|
#45
Saint Jude Ave
New Iberia, LA 70560
|
- sq. feet
|
- baths - beds |
$5,620
|
show details |

|
#46
Ann St
New Iberia, LA 70560
|
- sq. feet
|
- baths - beds |
$5,245
|
show details |

|
#47
Lafayette St
New Iberia, LA 70560
|
- sq. feet
|
- baths - beds |
$5,338
|
show details |

|
#48
Emery Lewis Ave
New Iberia, LA 70560
|
- sq. feet
|
- baths - beds |
$5,245
|
show details |

|
#49
Abraham Roy St
New Iberia, LA 70560
|
- sq. feet
|
- baths - beds |
$5,245
|
show details |

|
Check over 1 million property listings on Foreclosure.com!
|
browse all offers | |||


 | New Iberia (19 replies) |
| Pros and cons of living in New Iberia (7 replies) |
| Moving to New Iberia / Lafayette (20 replies) |
| Lafayette was a dump (187 replies) |
| Another Person Considering Moving Back to New Orleans (23 replies) |
| Louisiana thread calling for input from those living in Shreveport/Bossier City, Baton Rouge, and Lake Charles areas. (80 replies) |

Median year apartment built: 1975
Household type by relationship:
Households: 27,701- Male householders: 5,201 (1,596 living alone), Female householders: 5,738 (1,597 living alone)
3,744 spouses (3,612 opposite-sex spouses), 1,062 unmarried partners, (1,053 opposite-sex unmarried partners), 8,843 children (8,348 natural, 69 adopted, 425 stepchildren), 1,511 grandchildren, 213 brothers or sisters, 157 parents, 0 foster children, 427 other relatives, 444 non-relatives
- In group quarters: 355
Size of family households: 2,843 2-persons, 1,249 3-persons, 1,143 4-persons, 902 5-persons, 211 6-persons, 477 7-or-more-persons.
Size of nonfamily households: 4,343 1-person, 724 2-persons, 187 3-persons, 8 6-persons.
2,514 married couples with children.
3,669 single-parent households (648 men, 3,021 women).
92.7% of residents of New Iberia speak English at home.
2.0% of residents speak Spanish at home (51% speak English very well, 7% speak English well, 40% speak English not well, 2% don't speak English at all).
3.2% of residents speak other Indo-European language at home (87% speak English very well, 9% speak English well, 4% speak English not well).
1.3% of residents speak Asian or Pacific Island language at home (36% speak English very well, 11% speak English well, 32% speak English not well, 21% don't speak English at all).
0.4% of residents speak other language at home (66% speak English very well, 34% speak English well).
Foreign born population: 717 (2.6%)
(41.3% of them are naturalized citizens)
| Here: | 5.7 |
| State: | 6.2 |
| Here: | 4.1 |
| State: | 4.4 |
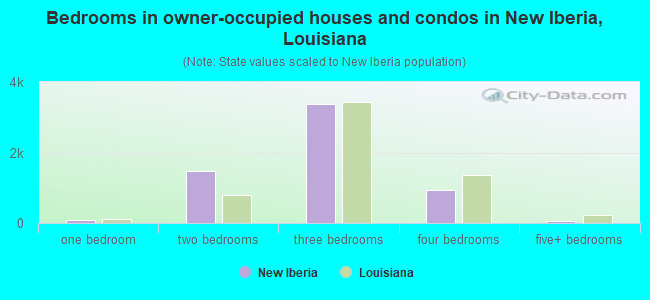
- Bedrooms in owner-occupied houses and condos in New Iberia, Louisiana
- 0no bedroom
- 861 bedroom
- 1,4832 bedrooms
- 3,3713 bedrooms
- 9394 bedrooms
- 645+ bedrooms
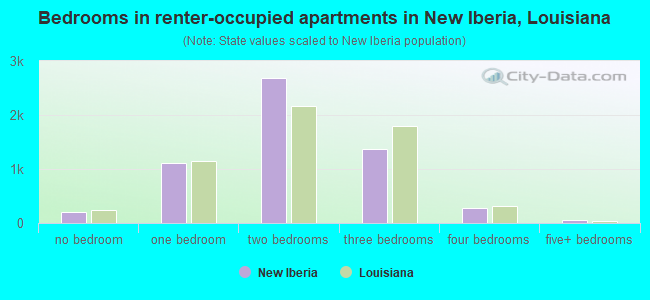
- Bedrooms in renter-occupied apartments in New Iberia, Louisiana
- 199no bedroom
- 1,1051 bedroom
- 2,6872 bedrooms
- 1,3683 bedrooms
- 2844 bedrooms
- 645+ bedrooms
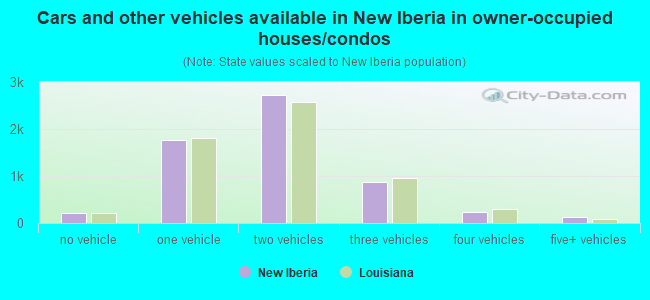
- Cars and other vehicles available in New Iberia in owner-occupied houses/condos
- 216no vehicle
- 1,7691 vehicle
- 2,7162 vehicles
- 8693 vehicles
- 2444 vehicles
- 1305+ vehicles
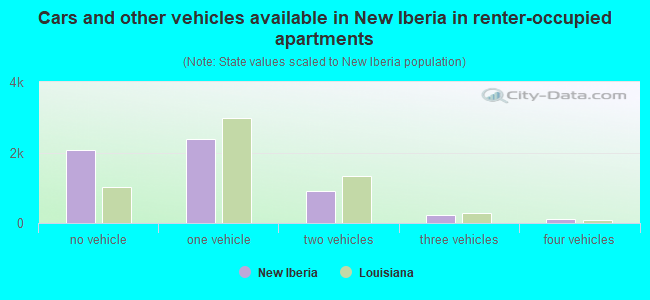
- Cars and other vehicles available in New Iberia in renter-occupied apartments
- 2,068no vehicle
- 2,3831 vehicle
- 9012 vehicles
- 2373 vehicles
- 1034 vehicles
- 155+ vehicles
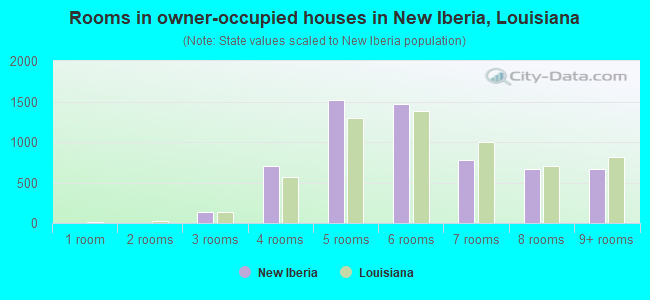
- Rooms in owner-occupied houses in New Iberia, Louisiana
- 01 room
- 02 rooms
- 1363 rooms
- 7074 rooms
- 1,5165 rooms
- 1,4746 rooms
- 7817 rooms
- 6618 rooms
- 6709+ rooms
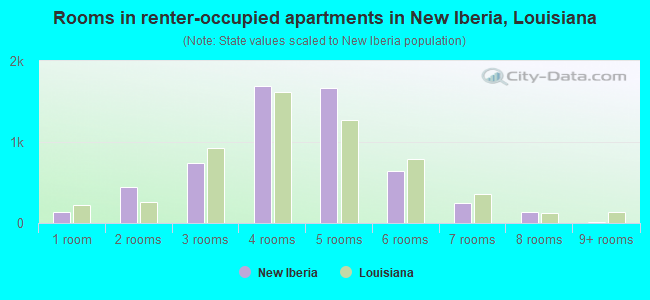
- Rooms in renter-occupied apartments in New Iberia, Louisiana
- 1331 room
- 4392 rooms
- 7363 rooms
- 1,6884 rooms
- 1,6725 rooms
- 6436 rooms
- 2497 rooms
- 1388 rooms
- 89+ rooms
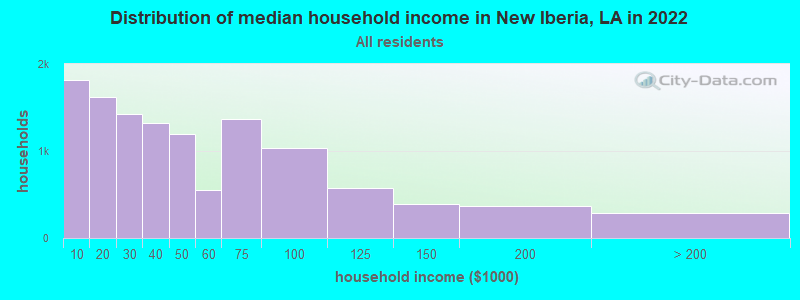
New Iberia, LA household income distribution

- 1,818Less than $10,000
- 1,626$10,000 to $19,999
- 1,421$20,000 to $29,999
- 1,321$30,000 to $39,999
- 1,191$40,000 to $49,999
- 555$50,000 to $59,999
- 1,373$60,000 to $74,999
- 1,035$75,000 to $99,999
- 571$100,000 to $124,999
- 389$125,000 to $149,999
- 373$150,000 to $199,999
- 290$200,000 or more
Home value of owner - occupied houses in 2022 in New Iberia, LA
-
- 66Less than $10,000
- 20$10,000 to $14,999
- 89$15,000 to $19,999
- 349$20,000 to $24,999
- 134$25,000 to $29,999
- 38$30,000 to $34,999
- 17$35,000 to $39,999
- 132$40,000 to $49,999
- 188$50,000 to $59,999
- 131$60,000 to $69,999
- 455$70,000 to $79,999
- 180$80,000 to $89,999
- 103$90,000 to $99,999
- 340$100,000 to $124,999
- 739$125,000 to $149,999
- 926$150,000 to $174,999
- 241$175,000 to $199,999
- 513$200,000 to $249,999
- 397$250,000 to $299,999
- 297$300,000 to $399,999
- 315$400,000 to $499,999
- 59$500,000 to $749,999
- 125$750,000 to $999,999
- 24$1,000,000 to $1,499,999
Rent paid by renters in 2022 in New Iberia, LA
-
- 204Less than $100
- 136$100 to $149
- 263$150 to $199
- 161$200 to $249
- 88$250 to $299
- 396$300 to $349
- 125$350 to $399
- 373$400 to $449
- 226$450 to $499
- 361$500 to $549
- 344$550 to $599
- 421$600 to $649
- 481$650 to $699
- 382$700 to $749
- 341$750 to $799
- 419$800 to $899
- 154$900 to $999
- 226$1,000 to $1,249
- 33$1,250 to $1,499
- 82$3,500 or more
- 561No cash rent
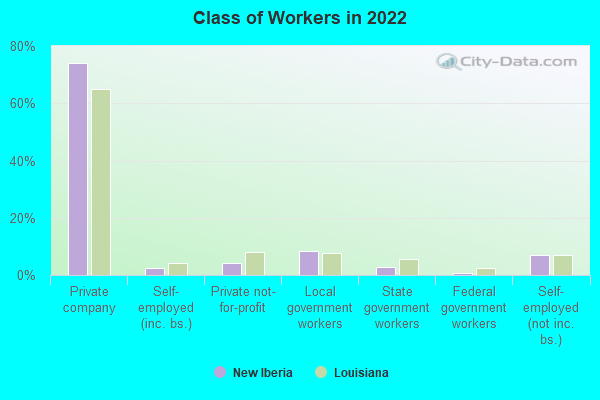
Percentage of workers working in this county: 74.9%
Number of people working at home: 462 (4.4% of all workers)
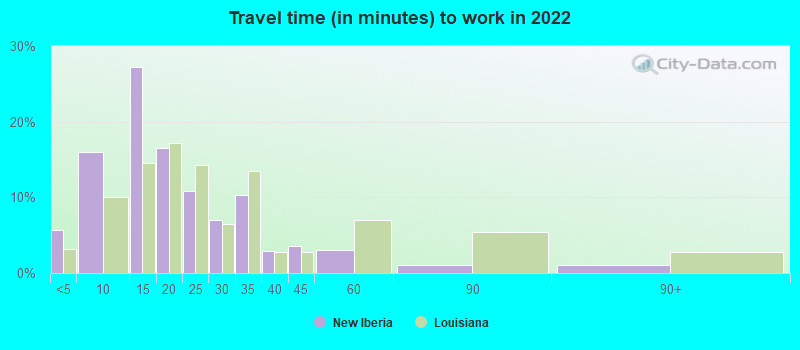
Travel time to work (commute)
- Less than 5 minutes: 774
- 5 to 9 minutes: 1,997
- 10 to 14 minutes: 2,883
- 15 to 19 minutes: 1,101
- 20 to 24 minutes: 794
- 25 to 29 minutes: 425
- 30 to 34 minutes: 1,101
- 35 to 39 minutes: 329
- 40 to 44 minutes: 370
- 45 to 59 minutes: 389
- 60 to 89 minutes: 374
- 90 or more minutes: 187
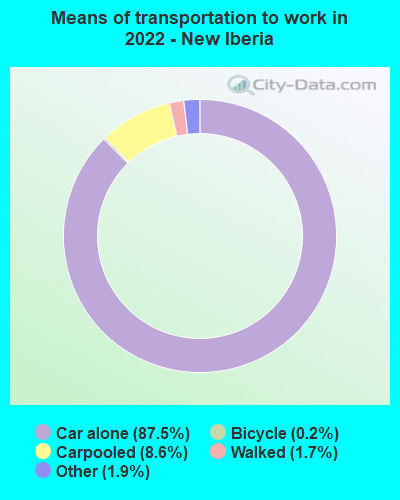
Means of transportation to work:
- Drove a car alone: 11,976 (83.5%)
- Carpooled: 1,179 (8.2%)
- Bus: 6 (0.0%)
- Taxi: 288 (2.0%)
- Bicycle: 19 (0.1%)
- Walked: 266 (1.9%)
- Worked at home: 462 (3.2%)
- Unemployment by race in 2022
- Unemployment rate for White non-Hispanic residents
- 5.4%Males
- 3.5%Females
- Unemployment rate for Black residents
- 23.4%Males
- 5.9%Females
- Unemployment rate for two or more race residents
- 11.5%Males
- Unemployment rate for Hispanic or Latino residents
- 10.3%Males
- 4.6%Females
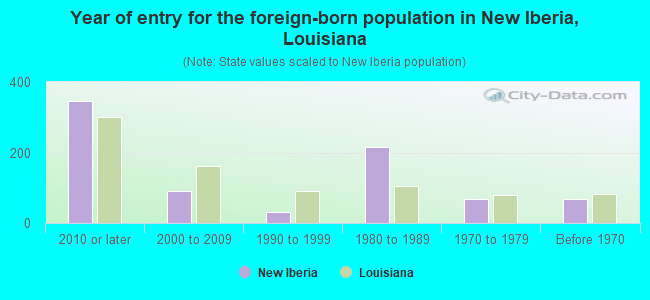
- Year of entry for the foreign-born population in New Iberia, Louisiana
- 3452010 or later
- 912000 to 2009
- 321990 to 1999
- 2161980 to 1989
- 671970 to 1979
- 67Before 1970
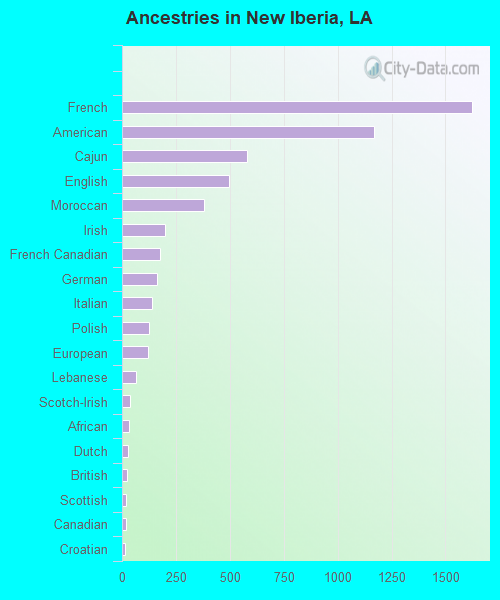
First ancestries reported:
- French: 1,621 (9.4%)
- American: 1,171 (6.8%)
- Cajun: 578 (3.4%)
- English: 496 (2.9%)
- Moroccan: 382 (2.2%)
- Irish: 198 (1.1%)
- French Canadian: 176 (1.0%)
- German: 162 (0.9%)
- Italian: 138 (0.8%)
- Polish: 125 (0.7%)
- European: 119 (0.7%)
- Lebanese: 67 (0.4%)
- Scotch-Irish: 36 (0.2%)
- African: 32 (0.2%)
- Dutch: 26 (0.2%)
- British: 25 (0.1%)
- Scottish: 19 (0.1%)
- Canadian: 17 (0.10%)
- Croatian: 15 (0.09%)
- Czech: 14 (0.08%)
- Scandinavian: 9 (0.05%)
- Portuguese: 6 (0.03%)
Most common places of birth for foreign-born residents (%):
| New Iberia: | 23.0% (160) |
| Louisiana: | 0.6% (1,184) |
| New Iberia: | 17.2% (120) |
| Louisiana: | 12.1% (23,732) |
| New Iberia: | 13.9% (97) |
| Louisiana: | 3.4% (6,779) |
| New Iberia: | 11.5% (80) |
| Louisiana: | 0.2% (374) |
| New Iberia: | 6.7% (47) |
| Louisiana: | 18.9% (37,225) |
| New Iberia: | 6.7% (47) |
| Louisiana: | 0.8% (1,538) |
| New Iberia: | 4.6% (32) |
| Louisiana: | 9.2% (18,115) |
| New Iberia: | 3.0% (21) |
| Louisiana: | 1.5% (2,933) |
| New Iberia: | 2.7% (19) |
| Louisiana: | 2.2% (4,241) |
| New Iberia: | 2.4% (17) |
| Louisiana: | 3.1% (6,086) |
| New Iberia: | 2.3% (16) |
| Louisiana: | 0.7% (1,281) |
| New Iberia: | 2.0% (14) |
| Louisiana: | 0.1% (288) |
Place of birth for U.S.-born residents:
- This state: 24,476
- Other state: 2,346
- Northeast: 302
- Midwest: 364
- South: 1,691
- West: 83
86.1% of New Iberia residents lived in the same house 1 years ago.
Out of people who lived in different houses, 42.3% lived in this county.
Out of people who lived in different counties, 77.3% lived in Louisiana.
| New Iberia: | 86.1% |
| State average: | 88.3% |
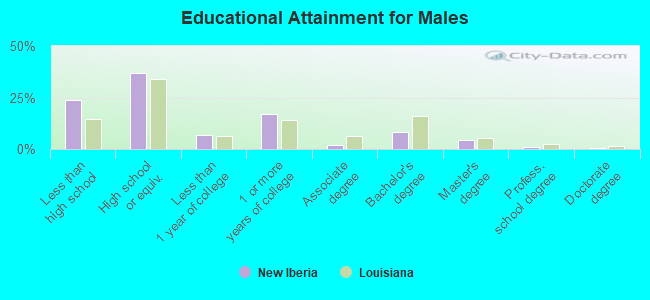
Education attainment for males 25 years and older:
- No schooling: 156
- Nursery to 4th grade: 86
- 5th and 6th grade: 66
- 7th and 8th grade: 246
- 9th grade: 332
- 10th grade: 332
- 11th grade: 305
- 12th grade, no diploma: 478
- High school graduate (or equivalency): 3,071
- Less than 1 year of college: 557
- Some college more than 1 year, no degree: 1,398
- Associate degree: 168
- Bachelor's degree: 695
- Master's degree: 344
- Professional school degree: 81
- Doctorate degree: 21
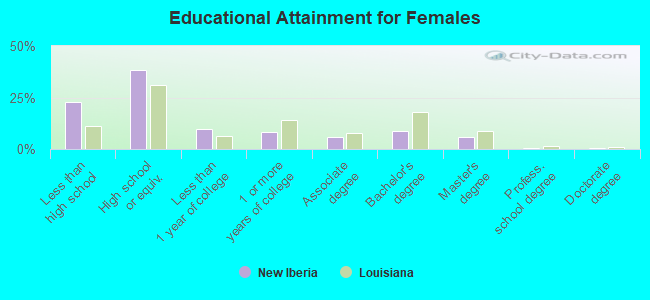
Education attainment for females 25 years and older:
- No schooling: 317
- Nursery to 4th grade: 8
- 5th and 6th grade: 98
- 7th and 8th grade: 119
- 9th grade: 271
- 10th grade: 513
- 11th grade: 503
- 12th grade, no diploma: 366
- High school graduate (or equivalency): 3,681
- Less than 1 year of college: 926
- Some college more than 1 year, no degree: 812
- Associate degree: 558
- Bachelor's degree: 840
- Master's degree: 551
- Professional school degree: 35
- Doctorate degree: 53


Housing units in structures:
- One, detached: 9,211
- One, attached: 221
- Two: 496
- 3 or 4: 866
- 5 to 9: 980
- 10 to 19: 176
- 20 to 49: 248
- 50 or more: 313
- Mobile homes: 944
Housing units lacking complete kitchen facilities in 2022: 3.3%
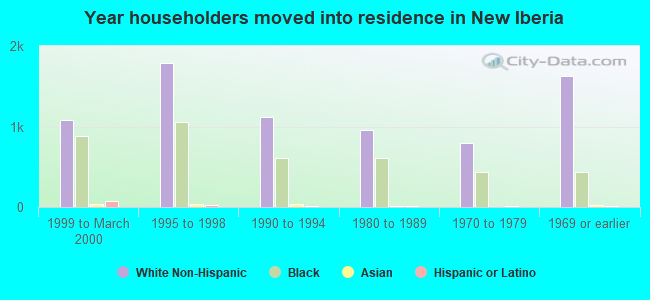
House/condo owner moved in on average 17 years ago
Renter moved in on average 2 years ago
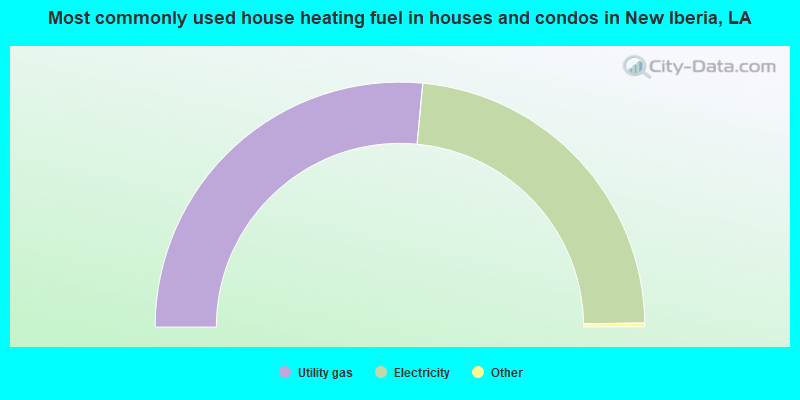
- 53.0%Utility gas
- 46.5%Electricity
- 0.3%Bottled, tank, or LP gas
- 0.2%No fuel used
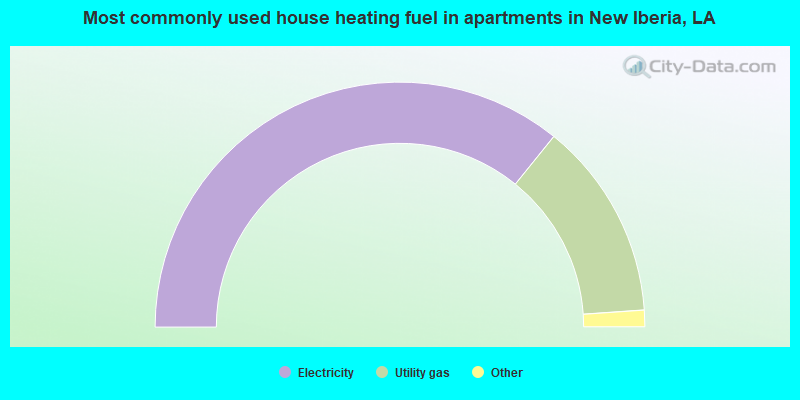
- 71.7%Electricity
- 26.2%Utility gas
- 1.8%Bottled, tank, or LP gas
- 0.4%No fuel used
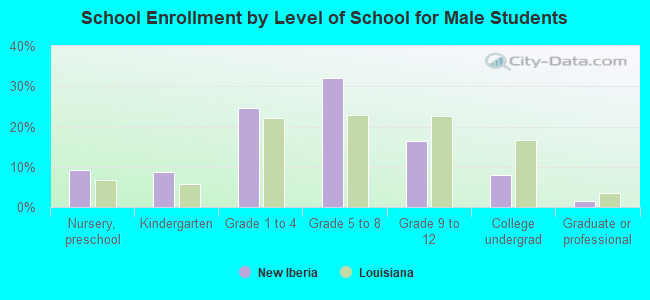
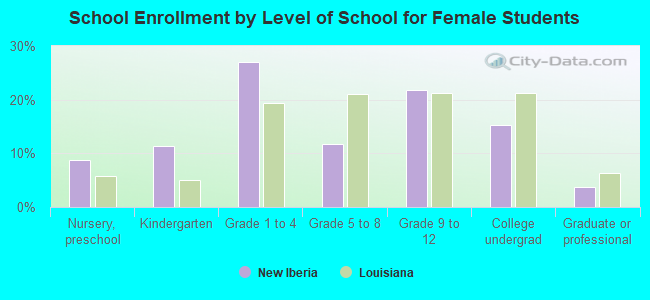
Private vs. public school enrollment:
| Here: | 18.5% |
| Louisiana: | 19.6% |
| Here: | 32.9% |
| Louisiana: | 18.3% |
| Here: | 11.0% |
| Louisiana: | 17.4% |