Housing density: 763 houses/condos per square mile
Median price asked for vacant for-sale houses and condos in 2022 in this county: $231,294.
Median contract rent in 2022: $1,968 (lower quartile is $1,681, upper quartile is over $2,000)
Median rent asked for vacant for-rent units in 2022: $2,061
Median gross rent in Millburn, NJ in 2022: over $2,000
Housing units in Millburn with a mortgage: 3,727 (264 second mortgage, 584 home equity loan, 17 both second mortgage and home equity loan) Houses without a mortgage: 1,714
In family households: 645,040 (104,343 male householders, 84,996 female householders)
113,673 spouses, 245,726 children (232,723 natural, 5,793 adopted, 7,210 stepchildren), 20,627 grandchildren, 15,422 brothers or sisters, 11,923 parents, foster children, 19,910 other relatives, 22,762 non-relatives
In nonfamily households: 115,157 (42,135 male householders (33,262 living alone)), 52,238 female householders (45,266 living alone)), 20,784 nonrelatives
In group quarters: 23,772 (12,126 institutionalized population)
108,634 married couples with children.
65,899 single-parent households (10,059 men, 55,840 women).
82.6% of residents of Millburn speak English at home.
2.9% of residents speak Spanish at home (78% speak English very well, 10% speak English well, 12% speak English not well).
7.8% of residents speak other Indo-European language at home (79% speak English very well, 15% speak English well, 5% speak English not well).
5.5% of residents speak Asian or Pacific Island language at home (69% speak English very well, 21% speak English well, 9% speak English not well, 2% don't speak English at all).
1.3% of residents speak other language at home (81% speak English very well, 15% speak English well, 4% speak English not well).
Foreign born population: 4,293 (20.3%)
(75.8% of them are naturalized citizens)
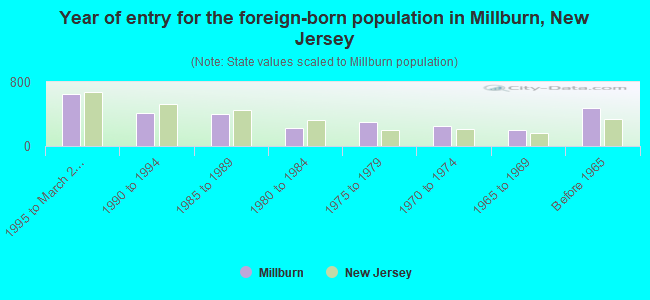
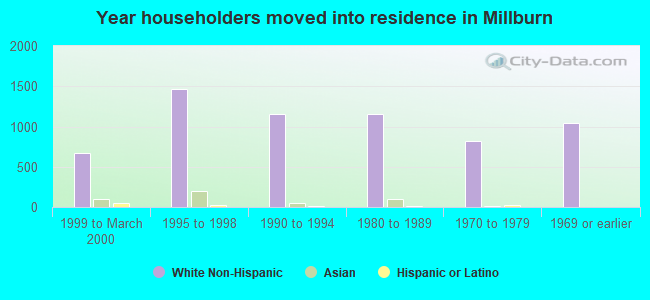
Year of entry for the foreign-born population in Millburn, New Jersey
6461995 to March 2000
4111990 to 1994
4031985 to 1989
2191980 to 1984
2951975 to 1979
2481970 to 1974
1981965 to 1969
479Before 1965
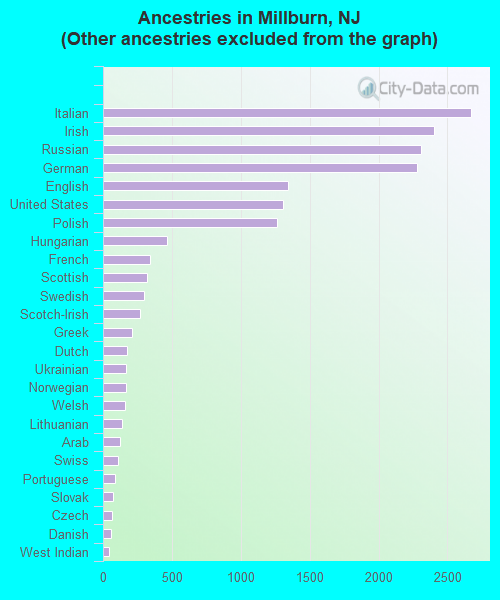
First ancestries reported:
Other: 6,161 (26.7%)
Italian: 2,668 (11.6%)
Irish: 2,403 (10.4%)
Russian: 2,309 (10.0%)
German: 2,277 (9.9%)
English: 1,345 (5.8%)
United States: 1,306 (5.7%)
Polish: 1,265 (5.5%)
Hungarian: 465 (2.0%)
French: 343 (1.5%)
Scottish: 319 (1.4%)
Swedish: 300 (1.3%)
Scotch-Irish: 270 (1.2%)
Greek: 208 (0.9%)
Dutch: 171 (0.7%)
Ukrainian: 170 (0.7%)
Norwegian: 168 (0.7%)
Welsh: 161 (0.7%)
Lithuanian: 137 (0.6%)
Arab: 127 (0.6%)
Swiss: 111 (0.5%)
Portuguese: 89 (0.4%)
Slovak: 74 (0.3%)
Czech: 67 (0.3%)
Danish: 55 (0.2%)
West Indian: 44 (0.2%)
Subsaharan African: 33 (0.1%)
French Canadian: 26 (0.1%)
Most common places of birth for foreign-born residents (%):
China, excluding Hong Kong and Taiwan
Millburn:
6.9% (199)
New Jersey:
2.7% (40,092)
India
Millburn:
6.8% (196)
New Jersey:
8.1% (119,497)
Taiwan
Millburn:
6.2% (179)
New Jersey:
1.2% (18,066)
Israel
Millburn:
5.4% (157)
New Jersey:
0.5% (7,675)
Italy
Millburn:
5.4% (157)
New Jersey:
4.0% (58,395)
Russia
Millburn:
5.3% (154)
New Jersey:
1.4% (20,243)
Other Eastern Europe
Millburn:
4.1% (120)
New Jersey:
1.2% (17,647)
Germany
Millburn:
4.0% (117)
New Jersey:
2.3% (33,531)
Philippines
Millburn:
3.7% (107)
New Jersey:
4.7% (69,773)
Canada
Millburn:
3.4% (98)
New Jersey:
1.1% (16,333)
Japan
Millburn:
3.1% (89)
New Jersey:
0.8% (11,245)
Poland
Millburn:
2.9% (85)
New Jersey:
3.8% (55,466)
Ukraine
Millburn:
2.9% (84)
New Jersey:
1.0% (14,768)
United Kingdom
Millburn:
2.8% (81)
New Jersey:
2.1% (30,355)
Korea
Millburn:
2.8% (81)
New Jersey:
3.5% (51,970)
Hong Kong
Millburn:
2.4% (69)
New Jersey:
0.6% (8,266)
Argentina
Millburn:
2.1% (60)
New Jersey:
0.6% (9,102)
Iran
Millburn:
1.8% (51)
New Jersey:
0.4% (5,220)
Colombia
Millburn:
1.7% (49)
New Jersey:
4.7% (69,754)
Other Northern Europe
Millburn:
1.6% (47)
New Jersey:
0.2% (3,519)
Brazil
Millburn:
1.6% (46)
New Jersey:
1.5% (22,097)
Place of birth for U.S.-born residents:
This state: 8,972
Other state: 7,658
Northeast: 5,709
Midwest: 837
South: 852
West: 260
67% of Millburn residents lived in the same house 5 years ago. Out of people who lived in different houses, 41% lived in this county. Out of people who lived in different counties, 42% lived in New Jersey.
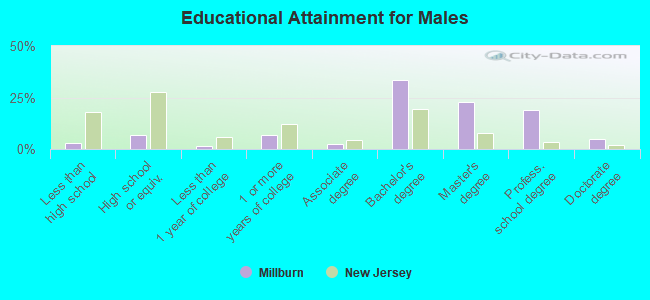
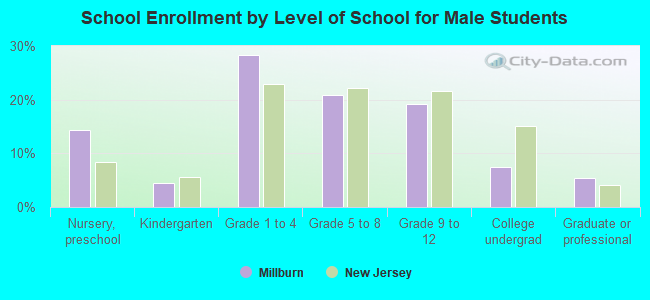
Education attainment for males 25 years and older:
No schooling: 10
Nursery to 4th grade: 23
5th and 6th grade: 27
7th and 8th grade: 10
9th grade: 7
10th grade: 48
11th grade: 25
12th grade, no diploma: 33
High school graduate (or equivalency): 409
Less than 1 year of college: 95
Some college more than 1 year, no degree: 415
Associate degree: 149
Bachelor's degree: 2,071
Master's degree: 1,416
Professional school degree: 1,166
Doctorate degree: 300
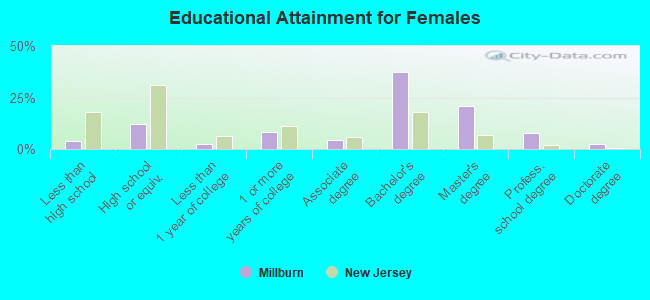
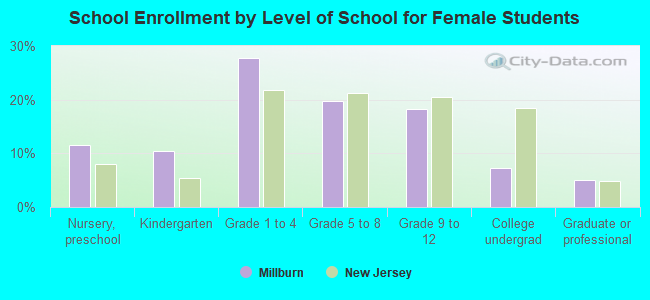
Education attainment for females 25 years and older:
No schooling: 5
Nursery to 4th grade: 0
5th and 6th grade: 46
7th and 8th grade: 35
9th grade: 31
10th grade: 34
11th grade: 19
12th grade, no diploma: 99
High school graduate (or equivalency): 846
Less than 1 year of college: 173
Some college more than 1 year, no degree: 582
Associate degree: 305
Bachelor's degree: 2,628
Master's degree: 1,467
Professional school degree: 547
Doctorate degree: 169
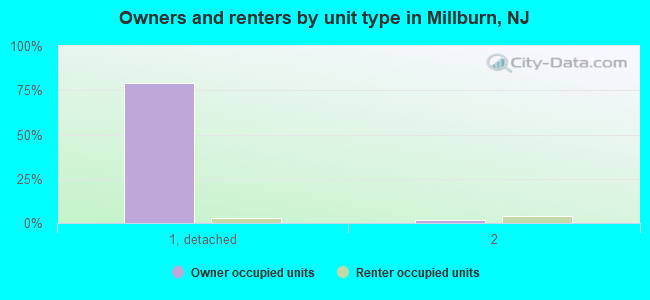
Housing units in structures:
One, detached: 5,837
One, attached: 65
Two: 404
3 or 4: 223
5 to 9: 105
10 to 19: 110
20 to 49: 296
50 or more: 110
Mobile homes: 8
Housing units lacking complete plumbing facilities: 0.4%
Housing units lacking complete kitchen facilities: 0.2%