Mill Plain, WA (Washington) Houses and Residents
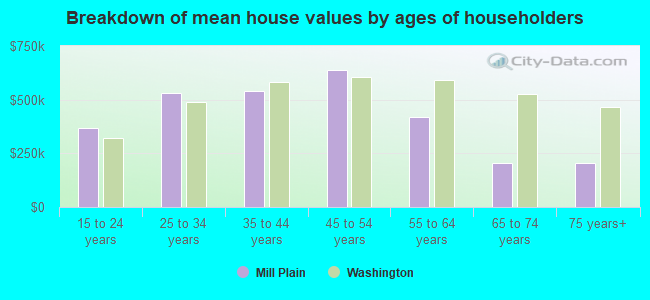
| Mill Plain: | $539,703 |
| Washington: | $569,500 |
Total population: 8,872 (Urban population: 6,526, Rural population: 964 (all nonfarm))
Houses: 2,516 (2,382 occupied: 1,951 owner occupied, 431 renter occupied)
| % of renters here: | 18% |
| State: | 36% |
Housing density: 421 houses/condos per square mile
Median price asked for vacant for-sale houses and condos in 2022 in this county: $858,483.
Median contract rent in 2022: over $2,000 (lower quartile is $1,844, upper quartile is over $2,000)
Median rent asked for vacant for-rent units in 2022: $2,063
Median gross rent in Mill Plain, WA in 2022: over $2,000
Housing units in Mill Plain with a mortgage: 1,418 (143 second mortgage, 131 home equity loan, 0 both second mortgage and home equity loan)
Houses without a mortgage: 120
Compare current foreclosures near Mill Plain, WA:
| Photo | Address | Area | Beds / Baths | Price | Details |
|---|---|---|---|---|---|

|
#1
SE 116th Ave
Portland, OR 97266
|
1,678 sq. feet
|
1 baths 4 beds |
$485,000
|
show details |

|
#2
SE Renada St
Portland, OR 97267
|
2,439 sq. feet
|
2 baths 3 beds |
$409,900
|
show details |

|
#3
SW 1st Ave Apt 2125
Portland, OR 97201
|
1,950 sq. feet
|
2 baths 3 beds |
$670,000
|
show details |

|
#4
NW Riverscape St Apt 105
Portland, OR 97209
|
756 sq. feet
|
1 baths 1 beds |
$389,900
|
show details |

|
#5
NW 11th Ave Apt E
Vancouver, WA 98685
|
964 sq. feet
|
1 baths 2 beds |
show details | |

|
#6
NE 121st Ave Apt E27
Vancouver, WA 98682
|
1,078 sq. feet
|
2 baths 2 beds |
show details | |

|
#7
W Burnside Rd Unit 527
Portland, OR 97210
|
1,288 sq. feet
|
2 baths 2 beds |
show details | |

|
#8
NW 1st Dr
Gresham, OR 97030
|
1,730 sq. feet
|
3 baths 2 beds |
show details | |

|
#9
N Seneca St
Portland, OR 97203
|
1,651 sq. feet
|
1 baths 3 beds |
show details | |

|
#10
SE Talbert St
Clackamas, OR 97015
|
767 sq. feet
|
1 baths 1 beds |
show details |
| Photo | Address | Area | Beds / Baths | Price | Details |
|---|---|---|---|---|---|

|
#11
SE 128th Ave
Portland, OR 97236
|
1,380 sq. feet
|
2 baths 3 beds |
show details | |

|
#12
NE 162nd Ave
Portland, OR 97230
|
1,073 sq. feet
|
2 baths 3 beds |
show details | |

|
#13
NE 166th Pl
Vancouver, WA 98682
|
2,130 sq. feet
|
2 baths 5 beds |
show details | |

|
#14
NW 8th Ave Apt B
Vancouver, WA 98685
|
964 sq. feet
|
1 baths 2 beds |
show details | |

|
#15
NE Klickitat St
Portland, OR 97230
|
1,693 sq. feet
|
1 baths 3 beds |
show details | |

|
#16
SE 33rd St
Troutdale, OR 97060
|
1,464 sq. feet
|
2 baths 3 beds |
show details | |

|
#17
SE 144th Ave
Portland, OR 97236
|
2,329 sq. feet
|
3 baths 4 beds |
show details | |

|
#18
SE Sunset View Rd
Washougal, WA 98671
|
1,448 sq. feet
|
1 baths 4 beds |
show details | |

|
#19
NE Gabriel Rd
Yacolt, WA 98675
|
1,880 sq. feet
|
2 baths 3 beds |
show details | |

|
#20
NE 130th Pl
Portland, OR 97230
|
- sq. feet
|
3 baths 4 beds |
show details |
| Photo | Address | Area | Beds / Baths | Price | Details |
|---|---|---|---|---|---|

|
#21
SE 150th Ave
Portland, OR 97236
|
614 sq. feet
|
1 baths 2 beds |
show details | |

|
#22
SE 150th Ave
Portland, OR 97236
|
1,900 sq. feet
|
2 baths 4 beds |
show details | |

|
#23
NE Rose Pkwy
Portland, OR 97230
|
1,638 sq. feet
|
2 baths 4 beds |
show details | |

|
#24
E 24th St
Vancouver, WA 98661
|
720 sq. feet
|
1 baths 2 beds |
show details | |

|
#25
SE Kingsfisher Way
Clackamas, OR 97015
|
1,746 sq. feet
|
3 baths 3 beds |
show details | |

|
#26
NE Mallory Ave
Portland, OR 97211
|
1,336 sq. feet
|
1 baths 3 beds |
show details | |

|
#27
NE Brazee St
Portland, OR 97230
|
1,260 sq. feet
|
2 baths 2 beds |
show details | |

|
#28
NE Morris Ct
Portland, OR 97230
|
2,162 sq. feet
|
2 baths 7 beds |
show details | |

|
#29
NE 63rd Ave
Portland, OR 97218
|
2,344 sq. feet
|
2 baths 3 beds |
show details | |

|
#30
SE James St
Camas, WA 98607
|
840 sq. feet
|
1 baths 2 beds |
show details |
| Photo | Address | Area | Beds / Baths | Price | Details |
|---|---|---|---|---|---|

|
#31
NE 19th St
Gresham, OR 97030
|
1,120 sq. feet
|
2 baths 2 beds |
show details | |

|
#32
NW 8th St
Battle Ground, WA 98604
|
2,466 sq. feet
|
3 baths 4 beds |
show details | |

|
#33
Norris Rd
Vancouver, WA 98661
|
967 sq. feet
|
2 baths 3 beds |
show details | |

|
#34
NE 155th Ave
Portland, OR 97230
|
2,280 sq. feet
|
2 baths 4 beds |
show details | |

|
#35
NE 130th Ave
Portland, OR 97230
|
4,565 sq. feet
|
4 baths 7 beds |
show details | |

|
#36
Norris Rd
Vancouver, WA 98661
|
1,116 sq. feet
|
1 baths 3 beds |
show details | |

|
#37
NE Skidmore St
Portland, OR 97220
|
3,810 sq. feet
|
7 baths 5 beds |
show details | |

|
#38
SE Franklin St
Portland, OR 97236
|
1,618 sq. feet
|
2 baths 3 beds |
show details | |

|
#39
NE Mallory Ave
Portland, OR 97211
|
2,118 sq. feet
|
2 baths 5 beds |
show details | |

|
#40
N Syracuse St
Portland, OR 97203
|
2,145 sq. feet
|
1 baths 4 beds |
show details |
| Photo | Address | Area | Beds / Baths | Price | Details |
|---|---|---|---|---|---|

|
#41
SE Rachel Ln
Portland, OR 97236
|
1,384 sq. feet
|
2 baths 3 beds |
show details | |

|
#42
NW 10th Ct Apt F
Vancouver, WA 98685
|
1,281 sq. feet
|
2 baths 2 beds |
show details | |

|
#43
Delaware Ln
Vancouver, WA 98664
|
1,674 sq. feet
|
2 baths 3 beds |
show details | |

|
#44
NW 25th Ave
Battle Ground, WA 98604
|
1,565 sq. feet
|
2 baths 3 beds |
show details | |

|
#45
SW Florence Ave Apt 59
Gresham, OR 97080
|
1,146 sq. feet
|
2 baths 3 beds |
show details | |

|
#46
SW 14th Ave
Portland, OR 97219
|
2,100 sq. feet
|
2 baths 4 beds |
show details | |

|
#47
SE 49th Ave
Portland, OR 97215
|
2,605 sq. feet
|
2 baths 6 beds |
show details | |

|
#48
SE Old Barn Ln
Damascus, OR 97089
|
3,744 sq. feet
|
3 baths 4 beds |
show details | |

|
#49
Ne82nd Street
Vancouver, WA 98662
|
- sq. feet
|
1 baths 3 beds |
show details | |

|
Check over 1 million property listings on Foreclosure.com!
|
browse all offers | |||

 | Rental houses that allow German Shepherds (6 replies) |
| Salem OR vs Vancouver WA - best quality of life for the rent prices (95 replies) |
| Moving to Vancouver early April - thoughts on these apartments? (8 replies) |
| Salmon Creek vs. Fishers Landing (222 replies) |
| Szechuan Brothers restaurant on Mill Plain? (9 replies) |
| Big public school budget cuts for 2023! (25 replies) |

Household type by relationship:
Households: 422,153- In family households: 360,563 (79,262 male householders, 31,410 female householders)
84,752 spouses, 131,505 children (121,185 natural, 3,296 adopted, 7,024 stepchildren), 7,226 grandchildren, 3,444 brothers or sisters, 3,549 parents, foster children, 4,498 other relatives, 12,056 non-relatives
- In nonfamily households: 61,590 (22,699 male householders (16,393 living alone)), 24,728 female householders (20,133 living alone)), 14,163 nonrelatives
- In group quarters: 3,210 (1,691 institutionalized population)
71,295 married couples with children.
20,273 single-parent households (5,325 men, 14,948 women).
82.2% of residents of Mill Plain speak English at home.
3.8% of residents speak Spanish at home (72% speak English very well, 20% speak English well, 8% speak English not well).
10.2% of residents speak other Indo-European language at home (50% speak English very well, 21% speak English well, 22% speak English not well, 7% don't speak English at all).
2.8% of residents speak Asian or Pacific Island language at home (54% speak English very well, 17% speak English well, 29% speak English not well).
1.0% of residents speak other language at home (100% speak English very well).
Foreign born population: 1,883 (16.8%)
(41.3% of them are naturalized citizens)
| Here: | 6.4 |
| State: | 6.5 |
| Here: | 5.1 |
| State: | 3.9 |
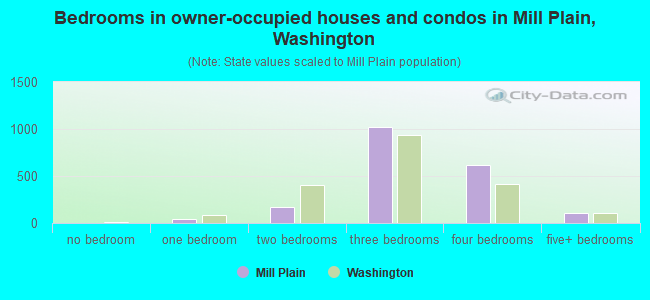
- Bedrooms in owner-occupied houses and condos in Mill Plain, Washington
- 0no bedroom
- 381 bedroom
- 1662 bedrooms
- 1,0223 bedrooms
- 6224 bedrooms
- 1035+ bedrooms
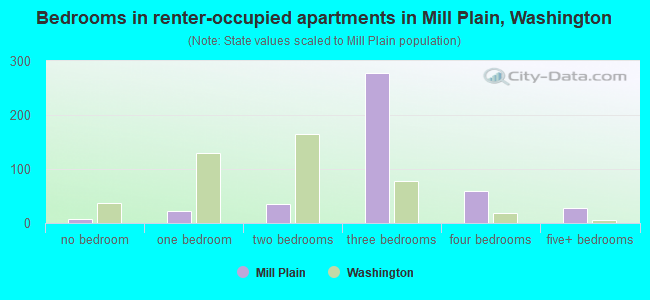
- Bedrooms in renter-occupied apartments in Mill Plain, Washington
- 8no bedroom
- 231 bedroom
- 362 bedrooms
- 2783 bedrooms
- 594 bedrooms
- 275+ bedrooms
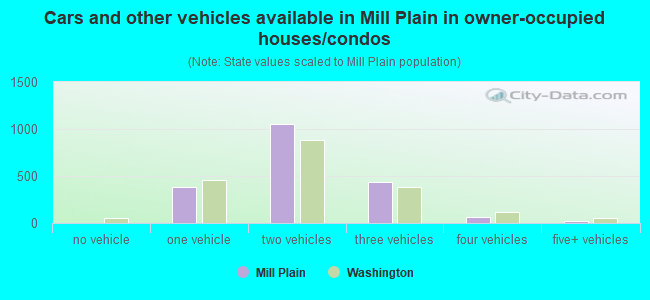
- Cars and other vehicles available in Mill Plain in owner-occupied houses/condos
- 0no vehicle
- 3811 vehicle
- 1,0542 vehicles
- 4393 vehicles
- 604 vehicles
- 175+ vehicles
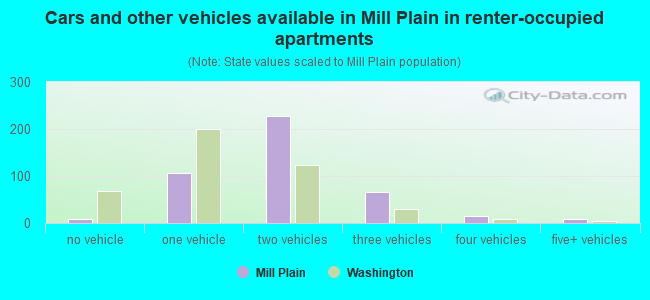
- Cars and other vehicles available in Mill Plain in renter-occupied apartments
- 8no vehicle
- 1071 vehicle
- 2282 vehicles
- 663 vehicles
- 144 vehicles
- 85+ vehicles
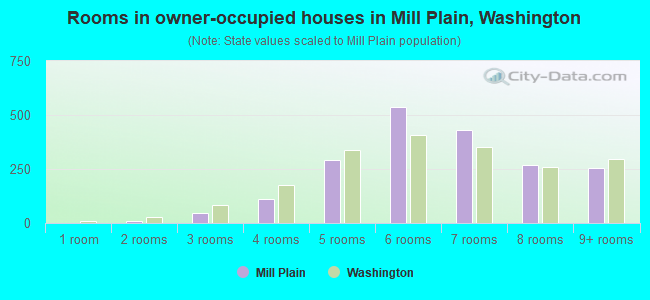
- Rooms in owner-occupied houses in Mill Plain, Washington
- 01 room
- 102 rooms
- 483 rooms
- 1134 rooms
- 2915 rooms
- 5366 rooms
- 4297 rooms
- 2688 rooms
- 2569+ rooms
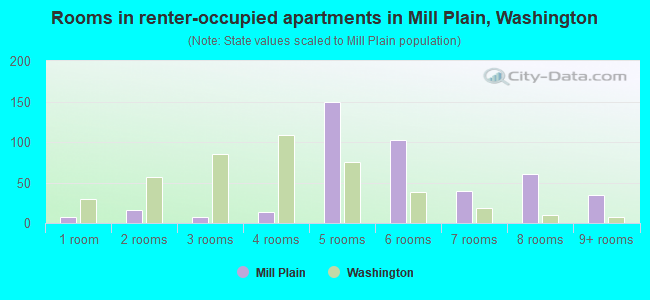
- Rooms in renter-occupied apartments in Mill Plain, Washington
- 81 room
- 162 rooms
- 73 rooms
- 134 rooms
- 1495 rooms
- 1036 rooms
- 407 rooms
- 618 rooms
- 349+ rooms
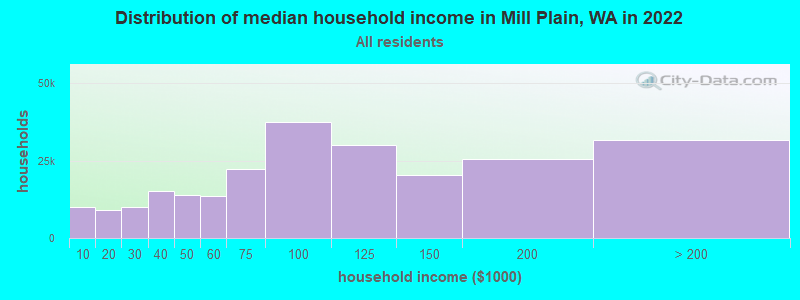
Mill Plain, WA household income distribution

- 9,958Less than $10,000
- 9,154$10,000 to $19,999
- 9,961$20,000 to $29,999
- 15,085$30,000 to $39,999
- 14,002$40,000 to $49,999
- 13,709$50,000 to $59,999
- 22,399$60,000 to $74,999
- 37,483$75,000 to $99,999
- 29,937$100,000 to $124,999
- 20,507$125,000 to $149,999
- 25,633$150,000 to $199,999
- 31,813$200,000 or more
Percentage of workers working in this county: 74.9%
Number of people working at home: 1,028 (19.9% of all workers)
Travel time to work (commute)
- Less than 5 minutes: 84
- 5 to 9 minutes: 273
- 10 to 14 minutes: 354
- 15 to 19 minutes: 465
- 20 to 24 minutes: 643
- 25 to 29 minutes: 211
- 30 to 34 minutes: 503
- 35 to 39 minutes: 132
- 40 to 44 minutes: 186
- 45 to 59 minutes: 188
- 60 to 89 minutes: 49
- 90 or more minutes: 47
Means of transportation to work:
- Drove a car alone: 2,758 (83.6%)
- Carpooled: 317 (9.6%)
- Bus or trolley bus: 16 (0.5%)
- Subway or elevated: 7 (0.2%)
- Bicycle: 9 (0.3%)
- Walked: 7 (0.2%)
- Other means: 21 (0.6%)
- Worked at home: 164 (5.0%)
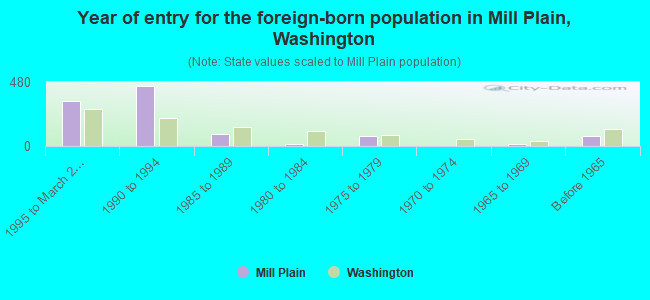
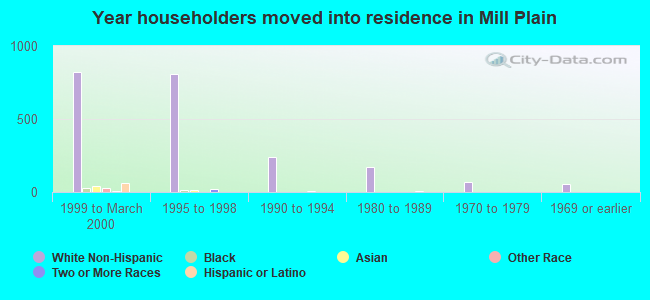
- Year of entry for the foreign-born population in Mill Plain, Washington
- 3391995 to March 2000
- 4531990 to 1994
- 881985 to 1989
- 161980 to 1984
- 721975 to 1979
- 01970 to 1974
- 121965 to 1969
- 74Before 1965
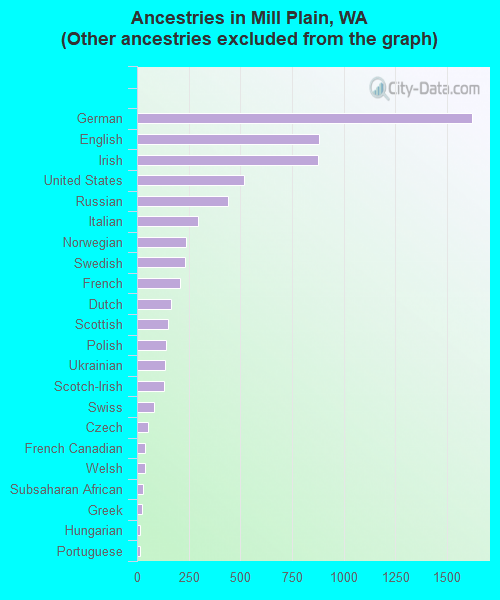
First ancestries reported:
- Other: 1,778 (21.9%)
- German: 1,623 (20.0%)
- English: 879 (10.8%)
- Irish: 877 (10.8%)
- United States: 517 (6.4%)
- Russian: 439 (5.4%)
- Italian: 297 (3.7%)
- Norwegian: 238 (2.9%)
- Swedish: 232 (2.9%)
- French: 208 (2.6%)
- Dutch: 165 (2.0%)
- Scottish: 149 (1.8%)
- Polish: 139 (1.7%)
- Ukrainian: 137 (1.7%)
- Scotch-Irish: 129 (1.6%)
- Swiss: 82 (1.0%)
- Czech: 52 (0.6%)
- French Canadian: 40 (0.5%)
- Welsh: 37 (0.5%)
- Subsaharan African: 28 (0.3%)
- Greek: 25 (0.3%)
- Hungarian: 16 (0.2%)
- Portuguese: 15 (0.2%)
- Danish: 9 (0.1%)
- West Indian: 8 (0.10%)
- Lithuanian: 7 (0.09%)
Most common places of birth for foreign-born residents (%):
| Mill Plain: | 29.0% (306) |
| Washington: | 2.5% (15,491) |
| Mill Plain: | 14.3% (151) |
| Washington: | 24.1% (148,115) |
| Mill Plain: | 6.4% (67) |
| Washington: | 3.0% (18,572) |
| Mill Plain: | 6.0% (63) |
| Washington: | 6.7% (40,879) |
| Mill Plain: | 4.6% (48) |
| Washington: | 1.2% (7,645) |
| Mill Plain: | 4.4% (46) |
| Washington: | 0.5% (2,889) |
| Mill Plain: | 3.8% (40) |
| Washington: | 6.2% (38,172) |
| Mill Plain: | 3.6% (38) |
| Washington: | 7.7% (47,568) |
| Mill Plain: | 3.4% (36) |
| Washington: | 3.3% (20,321) |
| Mill Plain: | 2.8% (30) |
| Washington: | 2.8% (16,936) |
| Mill Plain: | 2.8% (29) |
| Washington: | 0.4% (2,755) |
| Mill Plain: | 2.7% (28) |
| Washington: | 7.6% (46,733) |
| Mill Plain: | 2.5% (26) |
| Washington: | 0.7% (4,345) |
| Mill Plain: | 2.2% (23) |
| Washington: | 0.4% (2,661) |
| Mill Plain: | 1.9% (20) |
| Washington: | 0.2% (1,129) |
| Mill Plain: | 1.5% (16) |
| Washington: | 0.7% (4,573) |
| Mill Plain: | 1.5% (16) |
| Washington: | 0.3% (1,548) |
Place of birth for U.S.-born residents:
- This state: 2,100
- Other state: 4,256
- Northeast: 270
- Midwest: 688
- South: 366
- West: 2,932
27% of Mill Plain residents lived in the same house 5 years ago.
Out of people who lived in different houses, 53% lived in this county.
Out of people who lived in different counties, 23% lived in Washington.
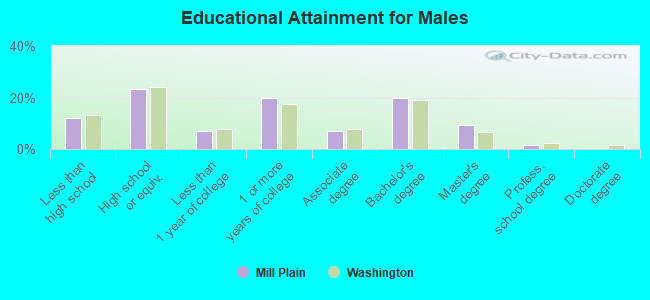
Education attainment for males 25 years and older:
- No schooling: 8
- Nursery to 4th grade: 6
- 5th and 6th grade: 5
- 7th and 8th grade: 34
- 9th grade: 9
- 10th grade: 40
- 11th grade: 59
- 12th grade, no diploma: 104
- High school graduate (or equivalency): 519
- Less than 1 year of college: 159
- Some college more than 1 year, no degree: 438
- Associate degree: 158
- Bachelor's degree: 437
- Master's degree: 208
- Professional school degree: 35
- Doctorate degree: 0
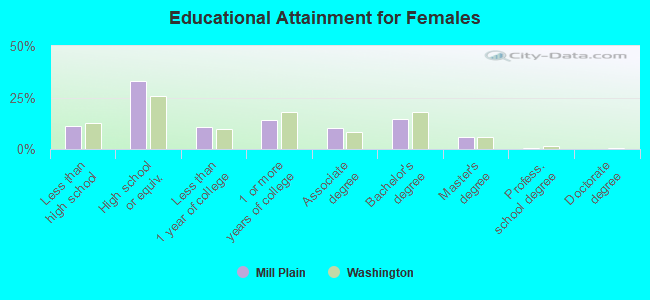
Education attainment for females 25 years and older:
- No schooling: 5
- Nursery to 4th grade: 21
- 5th and 6th grade: 0
- 7th and 8th grade: 34
- 9th grade: 19
- 10th grade: 31
- 11th grade: 23
- 12th grade, no diploma: 119
- High school graduate (or equivalency): 729
- Less than 1 year of college: 231
- Some college more than 1 year, no degree: 314
- Associate degree: 222
- Bachelor's degree: 319
- Master's degree: 133
- Professional school degree: 13
- Doctorate degree: 0


Housing units in structures:
- One, detached: 2,074
- One, attached: 64
- Two: 18
- 20 to 49: 8
- 50 or more: 8
- Mobile homes: 344
Median worth of mobile homes: $193,734
- 48.5%Utility gas
- 47.8%Electricity
- 1.4%Bottled, tank, or LP gas
- 1.3%Wood
- 0.9%Fuel oil, kerosene, etc.
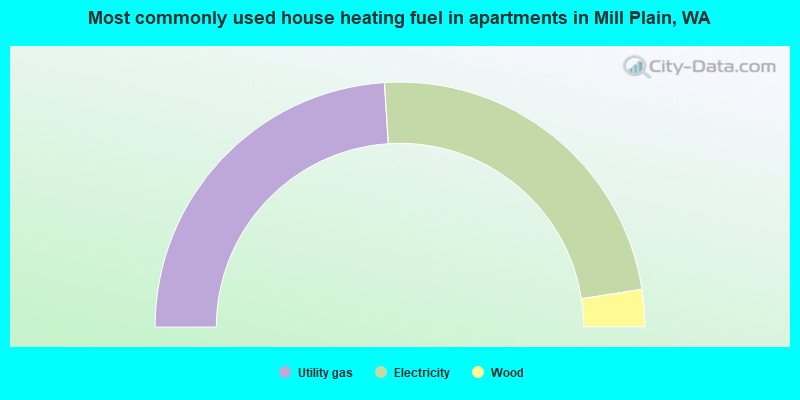
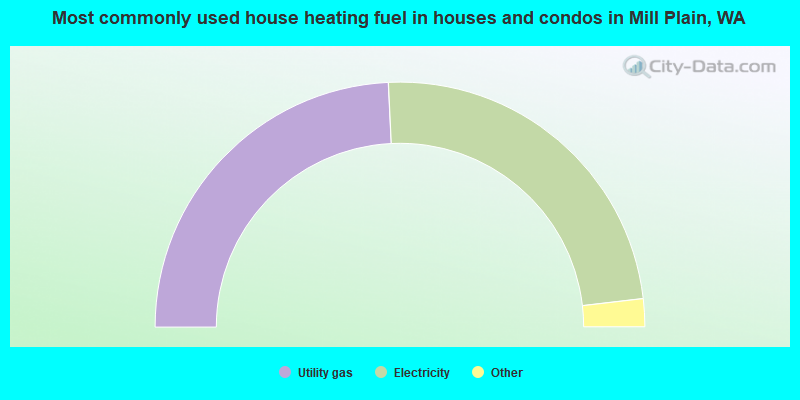
- 48.0%Utility gas
- 47.1%Electricity
- 4.9%Wood
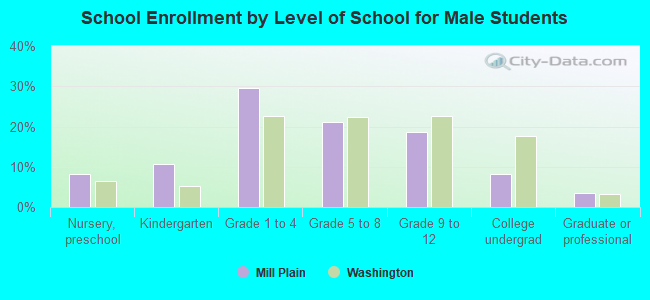
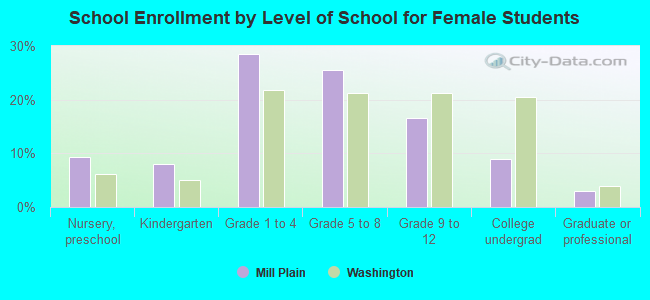
Private vs. public school enrollment:
| Here: | 15.9% |
| Washington: | 9.2% |
| Here: | 5.2% |
| Washington: | 7.0% |
| Here: | 27.4% |
| Washington: | 15.7% |