Madeira, OH (Ohio) Houses and Residents
| Madeira: | $497,096 |
| Ohio: | $204,100 |
Total population: 8,936 (All urban)
Houses: 3,593 (3,342 occupied: 3,018 owner occupied, 374 renter occupied)
| % of renters here: | 11% |
| State: | 33% |
Housing density: 1,067 houses/condos per square mile
Median price asked for vacant for-sale houses and condos in 2022 in this county: $136,154.
Median contract rent in 2022: $1,601 (lower quartile is $763, upper quartile is over $2,000)
Median rent asked for vacant for-rent units in 2022: $1,332
Median gross rent in Madeira, OH in 2022: over $2,000
Housing units in Madeira with a mortgage: 2,250 (172 second mortgage, 0 home equity loan, 142 both second mortgage and home equity loan)
Houses without a mortgage: 114
Median household income for houses/condos with a mortgage: $195,488
Median household income for apartments without a mortgage: $126,991
Median monthly housing costs: $2,035
Compare current foreclosures near Madeira, OH:
| Photo | Address | Area | Beds / Baths | Price | Details |
|---|---|---|---|---|---|

|
#1
Timbers Dr
Cincinnati, OH 45242
|
1,159 sq. feet
|
3 baths 2 beds |
show details | |

|
#2
High Trail Ct
Mason, OH 45040
|
1,040 sq. feet
|
2 baths 3 beds |
show details | |

|
#3
Dogwood Dr
Batavia, OH 45103
|
1,020 sq. feet
|
1 baths 2 beds |
show details | |

|
#4
Hood Ct
Cincinnati, OH 45231
|
1,169 sq. feet
|
2 baths 3 beds |
show details | |

|
#5
Wittmer Meadows Dr
Milford, OH 45150
|
2,712 sq. feet
|
4 baths 4 beds |
show details | |

|
#6
Lee Ct
Mason, OH 45040
|
1,578 sq. feet
|
3 baths 3 beds |
show details | |

|
#7
Chipley Ct
Cincinnati, OH 45240
|
1,688 sq. feet
|
2 baths 3 beds |
show details | |

|
#8
Esther Dr
Loveland, OH 45140
|
1,032 sq. feet
|
1 baths 3 beds |
show details | |

|
#9
Eyrich Rd
Cincinnati, OH 45248
|
800 sq. feet
|
1 baths 2 beds |
show details | |

|
#10
Romance Ln
Cincinnati, OH 45238
|
1,332 sq. feet
|
2 baths 4 beds |
show details |
| Photo | Address | Area | Beds / Baths | Price | Details |
|---|---|---|---|---|---|

|
#11
Chantilly Dr
Cincinnati, OH 45238
|
1,144 sq. feet
|
2 baths 3 beds |
show details | |

|
#12
Donora Ln
Cincinnati, OH 45240
|
1,687 sq. feet
|
2 baths 3 beds |
show details | |

|
#13
Clovernook Ave
Cincinnati, OH 45231
|
1,243 sq. feet
|
2 baths 4 beds |
show details | |

|
#14
Cascade Rd
Cincinnati, OH 45240
|
1,423 sq. feet
|
1 baths 4 beds |
show details | |

|
#15
Lakewood Dr
Cincinnati, OH 45248
|
1,557 sq. feet
|
3 baths 4 beds |
show details | |

|
#16
Simpson Ct
Mason, OH 45040
|
994 sq. feet
|
3 baths 3 beds |
show details | |

|
#17
King Ave
South Lebanon, OH 45065
|
1,152 sq. feet
|
1 baths 2 beds |
show details | |

|
#18
Skyridge Dr
Cincinnati, OH 45252
|
980 sq. feet
|
1 baths 3 beds |
show details | |

|
#19
Walter Ave
Fairfield, OH 45014
|
1,325 sq. feet
|
1 baths 3 beds |
show details | |

|
#20
Meadow Dr
Mason, OH 45040
|
1,008 sq. feet
|
2 baths 3 beds |
show details |
| Photo | Address | Area | Beds / Baths | Price | Details |
|---|---|---|---|---|---|

|
#21
Vineyard Green Dr
Cincinnati, OH 45255
|
1,693 sq. feet
|
3 baths 3 beds |
show details | |

|
#22
Cascade Rd
Cincinnati, OH 45240
|
1,630 sq. feet
|
2 baths 4 beds |
show details | |

|
#23
Baccarat Dr
Cincinnati, OH 45245
|
2,183 sq. feet
|
4 baths 4 beds |
show details | |

|
#24
Mark Ct
Cincinnati, OH 45255
|
1,886 sq. feet
|
2 baths 3 beds |
show details | |

|
#25
Bonaventure Ct
Cincinnati, OH 45238
|
1,682 sq. feet
|
2 baths 3 beds |
show details | |

|
#26
Dogwood Dr
Batavia, OH 45103
|
1,297 sq. feet
|
2 baths 3 beds |
show details | |

|
#27
Handel Ln
Cincinnati, OH 45218
|
1,773 sq. feet
|
3 baths 3 beds |
show details | |

|
#28
Pattison St
Cincinnati, OH 45204
|
1,685 sq. feet
|
2 baths 2 beds |
show details | |

|
#29
Spring Arbor Dr
Mason, OH 45040
|
1,939 sq. feet
|
3 baths 4 beds |
show details | |

|
#30
Carriage Oak Way
Hamilton, OH 45011
|
6,131 sq. feet
|
7 baths 4 beds |
show details |
| Photo | Address | Area | Beds / Baths | Price | Details |
|---|---|---|---|---|---|

|
#31
Dundee Dr
West Chester, OH 45069
|
2,100 sq. feet
|
3 baths 3 beds |
show details | |

|
#32
Milton St
Cincinnati, OH 45202
|
1,640 sq. feet
|
2 baths 4 beds |
show details | |

|
#33
Gracewind Ct
Cincinnati, OH 45231
|
1,900 sq. feet
|
4 baths 4 beds |
show details | |

|
#34
E Forest Ave
South Lebanon, OH 45065
|
1,498 sq. feet
|
2 baths 2 beds |
show details | |

|
#35
Kelly Dr
Loveland, OH 45140
|
2,462 sq. feet
|
3 baths 4 beds |
show details | |

|
#36
Esther Dr
West Chester, OH 45069
|
1,092 sq. feet
|
2 baths 3 beds |
show details | |

|
#37
Muskopf Rd
Fairfield, OH 45014
|
1,056 sq. feet
|
2 baths 3 beds |
show details | |

|
#38
Bennett Rd
Cincinnati, OH 45230
|
3,812 sq. feet
|
4 baths 3 beds |
show details | |

|
#39
Oaks Dr
Cincinnati, OH 45245
|
1,244 sq. feet
|
1 baths 3 beds |
show details | |

|
#40
Kelly Dr
Loveland, OH 45140
|
2,449 sq. feet
|
3 baths 4 beds |
show details |
| Photo | Address | Area | Beds / Baths | Price | Details |
|---|---|---|---|---|---|

|
#41
Centerbury Ct
Cincinnati, OH 45246
|
1,302 sq. feet
|
2 baths 2 beds |
show details | |

|
#42
E Crescentville Rd
Cincinnati, OH 45246
|
882 sq. feet
|
1 baths 2 beds |
show details | |

|
#43
Rapid Run Rd Apt 2
Cincinnati, OH 45238
|
1,190 sq. feet
|
2 baths 2 beds |
show details | |

|
#44
Valley View Dr
South Lebanon, OH 45065
|
778 sq. feet
|
1 baths 2 beds |
show details | |

|
#45
Anders Ct
Cincinnati, OH 45238
|
1,073 sq. feet
|
1 baths 3 beds |
show details | |

|
#46
Woodhaven Dr
Cincinnati, OH 45248
|
1,554 sq. feet
|
1 baths 4 beds |
show details | |

|
#47
Hollywood Ave
Cincinnati, OH 45224
|
1,640 sq. feet
|
2 baths 3 beds |
show details | |

|
#48
Hutchinson Rd
Cincinnati, OH 45248
|
1,172 sq. feet
|
1 baths 3 beds |
show details | |

|
#49
Roslyn Ave
Cincinnati, OH 45238
|
1,446 sq. feet
|
1 baths 2 beds |
show details | |

|
Check over 1 million property listings on Foreclosure.com!
|
browse all offers | |||

Latest news about housing in Madeira, OH collected exclusively by city-data.com from local newspapers, TV, and radio stations


Median year apartment built: 1984
Household type by relationship:
Households: 9,396- Male householders: 1,893 (237 living alone), Female householders: 1,419 (401 living alone)
2,385 spouses (2,385 opposite-sex spouses), 94 unmarried partners, (94 opposite-sex unmarried partners), 3,228 children (3,120 natural, 19 adopted, 88 stepchildren), 0 grandchildren, 8 brothers or sisters, 125 parents, 0 foster children, 0 other relatives, 56 non-relatives
- In group quarters: 182
Size of family households: 1,086 2-persons, 640 3-persons, 604 4-persons, 269 5-persons, 42 6-persons, 14 7-or-more-persons.
Size of nonfamily households: 636 1-person, 67 2-persons, 14 4-persons.
2,582 married couples with children.
234 single-parent households (24 men, 210 women).
92.5% of residents of Madeira speak English at home.
3.5% of residents speak Spanish at home (100% speak English very well).
3.1% of residents speak other Indo-European language at home (100% speak English very well).
1.1% of residents speak Asian or Pacific Island language at home (82% speak English very well, 18% speak English well).
Foreign born population: 476 (5.1%)
(93.9% of them are naturalized citizens)
| Here: | 7.7 |
| State: | 6.7 |
| Here: | 4.6 |
| State: | 4.4 |

- Bedrooms in owner-occupied houses and condos in Madeira, Ohio
- 0no bedroom
- 01 bedroom
- 2692 bedrooms
- 1,0743 bedrooms
- 1,3154 bedrooms
- 3615+ bedrooms

- Bedrooms in renter-occupied apartments in Madeira, Ohio
- 0no bedroom
- 941 bedroom
- 662 bedrooms
- 1263 bedrooms
- 894 bedrooms
- 05+ bedrooms

- Cars and other vehicles available in Madeira in owner-occupied houses/condos
- 17no vehicle
- 4881 vehicle
- 1,7392 vehicles
- 6093 vehicles
- 1324 vehicles
- 345+ vehicles

- Cars and other vehicles available in Madeira in renter-occupied apartments
- 38no vehicle
- 1341 vehicle
- 1672 vehicles
- 03 vehicles
- 364 vehicles
- 05+ vehicles

- Rooms in owner-occupied houses in Madeira, Ohio
- 01 room
- 02 rooms
- 03 rooms
- 354 rooms
- 2125 rooms
- 4536 rooms
- 7117 rooms
- 5818 rooms
- 1,0279+ rooms

- Rooms in renter-occupied apartments in Madeira, Ohio
- 01 room
- 02 rooms
- 863 rooms
- 754 rooms
- 1095 rooms
- 586 rooms
- 367 rooms
- 08 rooms
- 119+ rooms


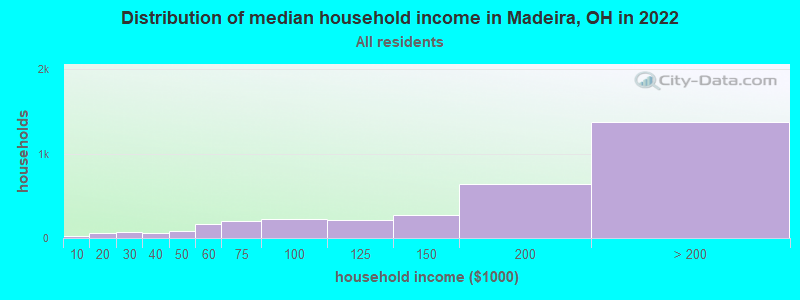
Madeira, OH household income distribution

- 20Less than $10,000
- 58$10,000 to $19,999
- 76$20,000 to $29,999
- 65$30,000 to $39,999
- 78$40,000 to $49,999
- 168$50,000 to $59,999
- 204$60,000 to $74,999
- 228$75,000 to $99,999
- 214$100,000 to $124,999
- 273$125,000 to $149,999
- 636$150,000 to $199,999
- 1,375$200,000 or more
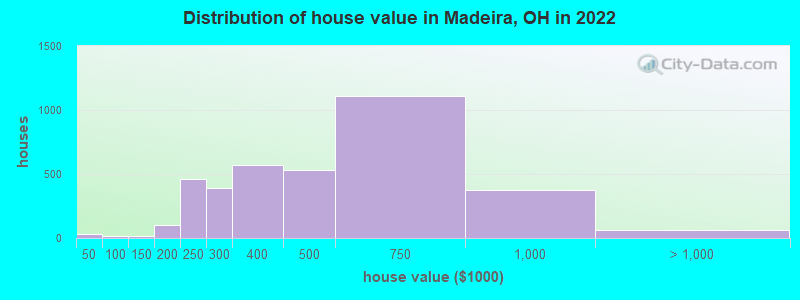
Home value of owner - occupied houses in 2022 in Madeira, OH
-
- 30Less than $10,000
- 13$80,000 to $89,999
- 5$100,000 to $124,999
- 10$125,000 to $149,999
- 30$150,000 to $174,999
- 69$175,000 to $199,999
- 462$200,000 to $249,999
- 393$250,000 to $299,999
- 573$300,000 to $399,999
- 527$400,000 to $499,999
- 1,110$500,000 to $749,999
- 376$750,000 to $999,999
- 44$1,000,000 to $1,499,999
- 14$2,000,000 or more
Rent paid by renters in 2022 in Madeira, OH
-
- 7$350 to $399
- 15$400 to $449
- 27$500 to $549
- 10$650 to $699
- 31$700 to $749
- 61$800 to $899
- 134$1,500 to $1,999
- 51$2,000 to $2,499
- 27$3,500 or more
- 9No cash rent


Percentage of workers working in this county: 89.2%
Number of people working at home: 1,501 (32.6% of all workers)
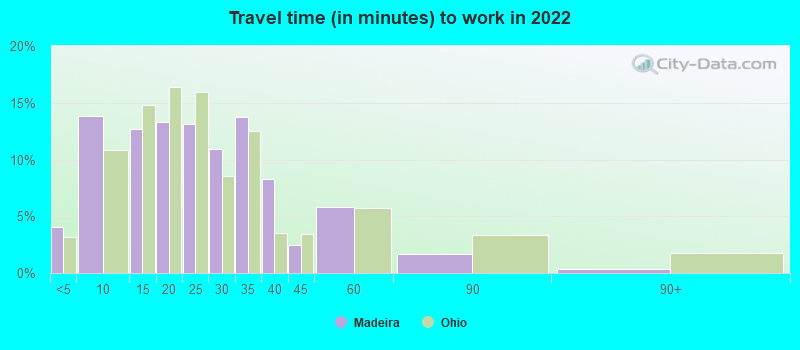
Travel time to work (commute)
- Less than 5 minutes: 86
- 5 to 9 minutes: 449
- 10 to 14 minutes: 474
- 15 to 19 minutes: 399
- 20 to 24 minutes: 984
- 25 to 29 minutes: 319
- 30 to 34 minutes: 304
- 35 to 39 minutes: 104
- 40 to 44 minutes: 99
- 45 to 59 minutes: 43
- 60 to 89 minutes: 28
- 90 or more minutes: 0
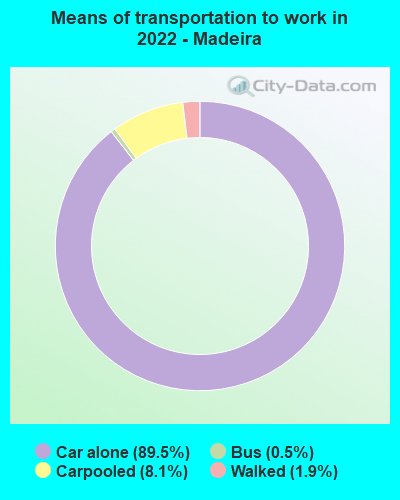
Means of transportation to work:
- Drove a car alone: 2,068 (58.2%)
- Carpooled: 197 (5.5%)
- Bus: 12 (0.3%)
- Walked: 45 (1.3%)
- Worked at home: 1,501 (42.2%)

- Unemployment by race in 2022
- Unemployment rate for White non-Hispanic residents
- 2.6%Males
- 0.6%Females
- Unemployment rate for Asian residents
- 12.8%Males

- Year of entry for the foreign-born population in Madeira, Ohio
- 882010 or later
- 1092000 to 2009
- 591990 to 1999
- 871980 to 1989
- 431970 to 1979
- 95Before 1970
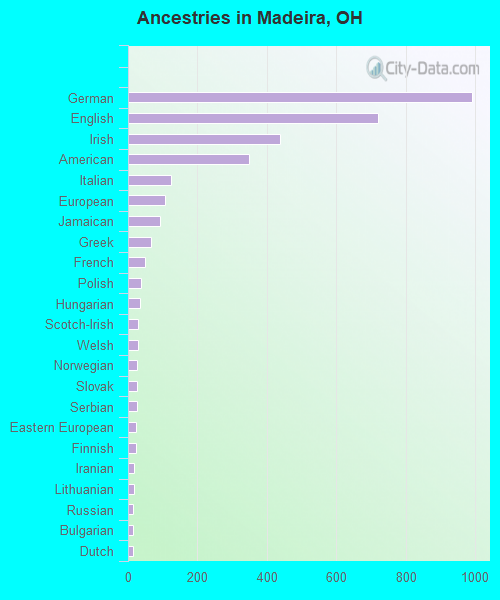
First ancestries reported:
- German: 991 (24.9%)
- English: 720 (18.1%)
- Irish: 438 (11.0%)
- American: 348 (8.8%)
- Italian: 123 (3.1%)
- European: 106 (2.7%)
- Jamaican: 93 (2.3%)
- Greek: 65 (1.6%)
- French: 50 (1.3%)
- Polish: 38 (1.0%)
- Hungarian: 34 (0.9%)
- Scotch-Irish: 29 (0.7%)
- Welsh: 28 (0.7%)
- Norwegian: 27 (0.7%)
- Slovak: 26 (0.7%)
- Serbian: 25 (0.6%)
- Eastern European: 23 (0.6%)
- Finnish: 22 (0.6%)
- Iranian: 17 (0.4%)
- Lithuanian: 17 (0.4%)
- Russian: 14 (0.4%)
- Bulgarian: 13 (0.3%)
- Dutch: 13 (0.3%)
- Swiss: 9 (0.2%)
- British: 8 (0.2%)
- Scottish: 7 (0.2%)
- Danish: 2 (0.05%)
Most common places of birth for foreign-born residents (%):
| Madeira: | 23.9% (116) |
| Ohio: | 11.6% (66,525) |
| Madeira: | 18.1% (88) |
| Ohio: | 0.5% (2,620) |
| Madeira: | 12.3% (60) |
| Ohio: | 0.3% (1,875) |
| Madeira: | 10.9% (53) |
| Ohio: | 1.2% (6,679) |
| Madeira: | 10.7% (52) |
| Ohio: | 0.7% (4,187) |
| Madeira: | 8.4% (41) |
| Ohio: | 0.8% (4,549) |
| Madeira: | 7.2% (35) |
| Ohio: | 1.0% (5,444) |
| Madeira: | 5.3% (26) |
| Ohio: | 0.9% (5,101) |
| Madeira: | 4.3% (21) |
| Ohio: | 6.2% (35,703) |
| Madeira: | 3.1% (15) |
| Ohio: | 1.4% (8,101) |
| Madeira: | 2.7% (13) |
| Ohio: | 2.6% (14,988) |
| Madeira: | 1.9% (9) |
| Ohio: | 0.2% (1,320) |
| Madeira: | 1.6% (8) |
| Ohio: | 0.9% (5,422) |
Place of birth for U.S.-born residents:
- This state: 5,556
- Other state: 3,200
- Northeast: 453
- Midwest: 1,096
- South: 1,199
- West: 407
96.6% of Madeira residents lived in the same house 1 years ago.
Out of people who lived in different houses, 33.8% lived in this county.
Out of people who lived in different counties, 2.9% lived in Ohio.
| Madeira: | 96.6% |
| State average: | 87.8% |
Education attainment for males 25 years and older:
- No schooling: 9
- Nursery to 4th grade: 0
- 5th and 6th grade: 11
- 7th and 8th grade: 2
- 9th grade: 0
- 10th grade: 0
- 11th grade: 14
- 12th grade, no diploma: 0
- High school graduate (or equivalency): 254
- Less than 1 year of college: 109
- Some college more than 1 year, no degree: 286
- Associate degree: 81
- Bachelor's degree: 1,255
- Master's degree: 447
- Professional school degree: 541
- Doctorate degree: 75

Education attainment for females 25 years and older:
- No schooling: 10
- Nursery to 4th grade: 0
- 5th and 6th grade: 25
- 7th and 8th grade: 1
- 9th grade: 0
- 10th grade: 13
- 11th grade: 2
- 12th grade, no diploma: 0
- High school graduate (or equivalency): 502
- Less than 1 year of college: 126
- Some college more than 1 year, no degree: 199
- Associate degree: 76
- Bachelor's degree: 1,257
- Master's degree: 807
- Professional school degree: 83
- Doctorate degree: 139


Housing units in structures:
- One, detached: 3,343
- One, attached: 69
- 3 or 4: 61
- 5 to 9: 10
- 50 or more: 29
- Mobile homes: 68
- Boats, RVs, vans, etc.: 12
Housing units lacking complete kitchen facilities in 2022: 0.3%
House/condo owner moved in on average 10 years ago
Renter moved in on average 5 years ago

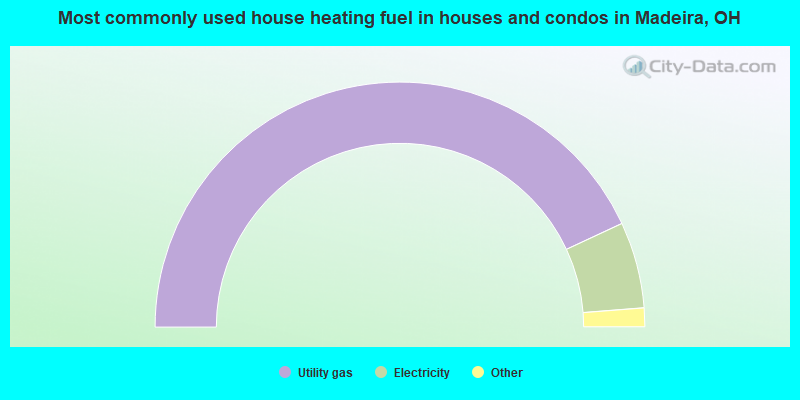
- 86.2%Utility gas
- 11.4%Electricity
- 1.9%Fuel oil, kerosene, etc.
- 0.5%Other fuel
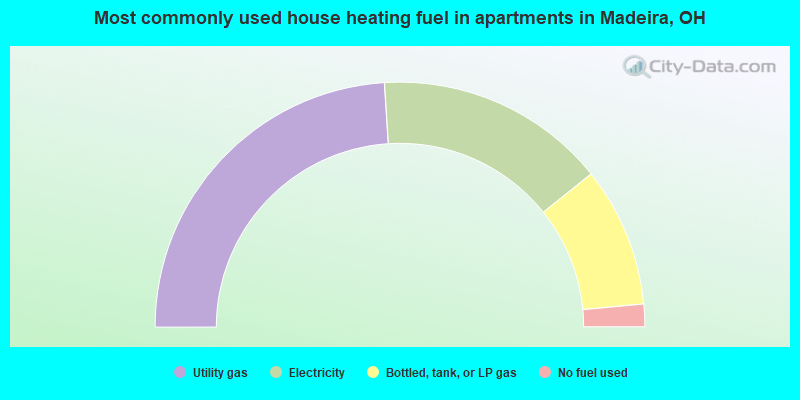
- 48.0%Utility gas
- 30.5%Electricity
- 18.5%Bottled, tank, or LP gas
- 3.0%No fuel used
Private vs. public school enrollment:
| Here: | 14.4% |
| Ohio: | 16.0% |
| Here: | 8.5% |
| Ohio: | 13.1% |
| Here: | 0.0% |
| Ohio: | 22.3% |


