Housing density: 270 houses/condos per square mile
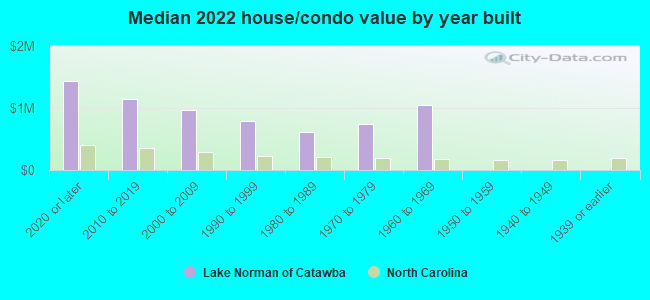
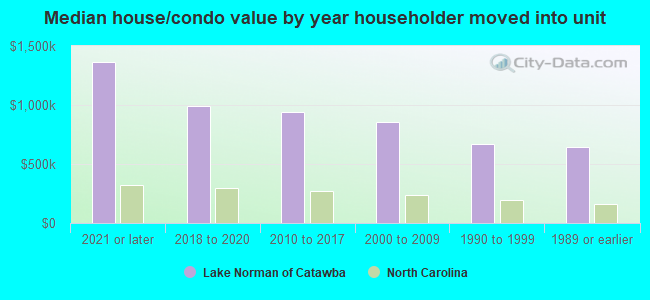
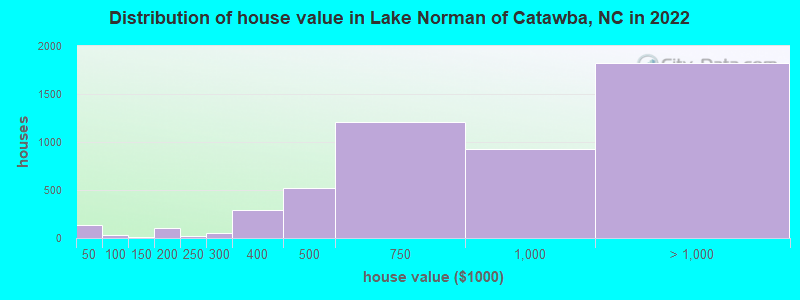
Median price asked for vacant for-sale houses and condos in 2022: $653,847.
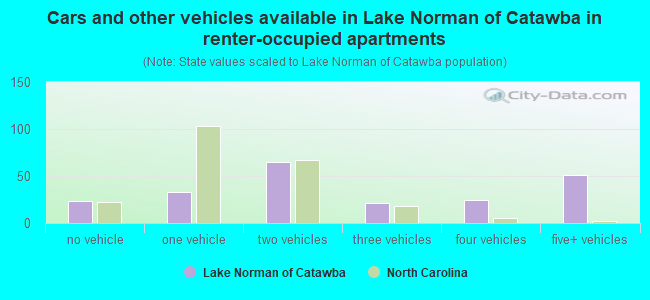
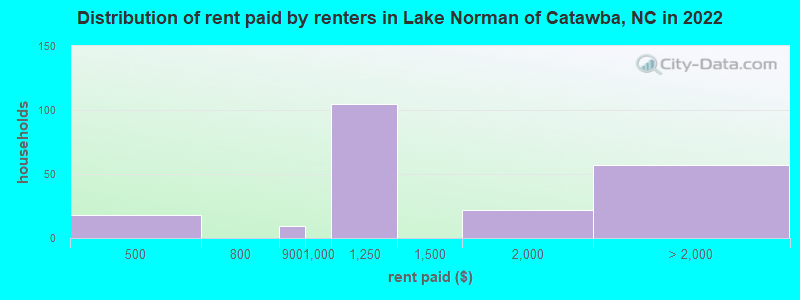
Median contract rent in 2022: $1,226 (lower quartile is $1,067, upper quartile is $1,819)
Median rent asked for vacant for-rent units in 2022: $1,444
Median gross rent in Lake Norman of Catawba, NC in 2022: $1,195
Housing units in Lake Norman of Catawba with a mortgage: 3,427 (542 second mortgage, 24 home equity loan, 582 both second mortgage and home equity loan) Houses without a mortgage: 49
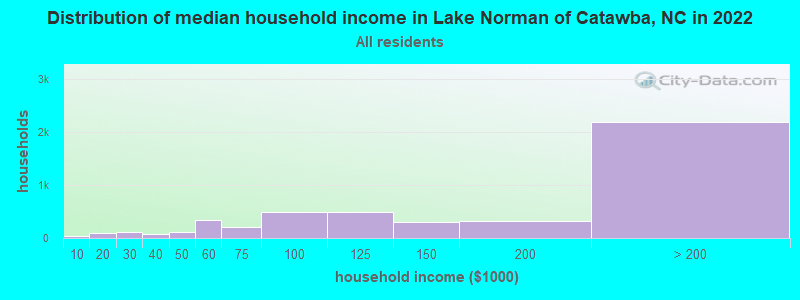
Median household income for houses/condos with a mortgage: $186,365
Median household income for apartments without a mortgage: $106,128
Median monthly housing costs: $2,496
Compare current foreclosures near Lake Norman of Catawba, NC:
Size of family households: 1,720 2-persons, 738 3-persons, 778 4-persons, 569 5-persons, 89 6-persons, 23 7-or-more-persons.
Size of nonfamily households: 533 1-person, 130 2-persons.
3,131 married couples with children.
56 single-parent households (0 men, 56 women).
91.8% of residents of Lake Norman of Catawba speak English at home.
3.8% of residents speak Spanish at home (78% speak English very well, 22% speak English well).
1.9% of residents speak other Indo-European language at home (81% speak English very well, 19% speak English well).
2.0% of residents speak Asian or Pacific Island language at home (59% speak English very well, 26% speak English well, 8% speak English not well, 8% don't speak English at all).
0.4% of residents speak other language at home (100% speak English very well).
Foreign born population: 935 (7.4%)
(85.5% of them are naturalized citizens)
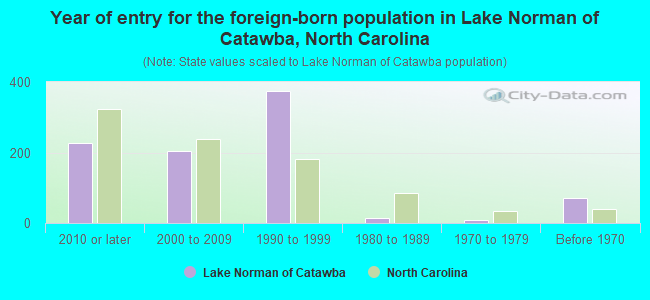
Year of entry for the foreign-born population in Lake Norman of Catawba, North Carolina
2282010 or later
2042000 to 2009
3751990 to 1999
151980 to 1989
81970 to 1979
71Before 1970
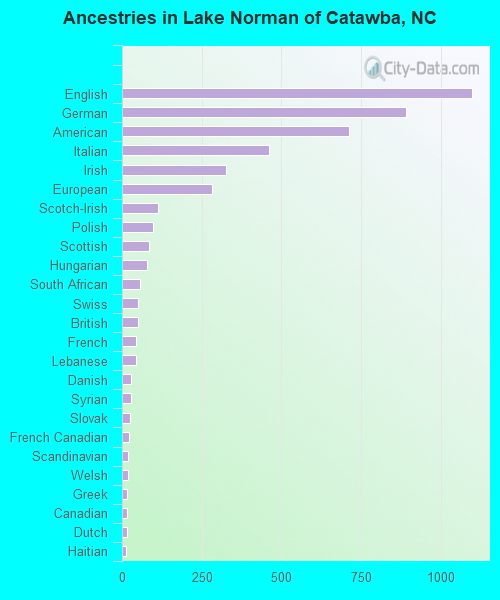
First ancestries reported:
English: 1,096 (19.3%)
German: 891 (15.7%)
American: 712 (12.6%)
Italian: 462 (8.2%)
Irish: 327 (5.8%)
European: 283 (5.0%)
Scotch-Irish: 112 (2.0%)
Polish: 97 (1.7%)
Scottish: 85 (1.5%)
Hungarian: 79 (1.4%)
South African: 57 (1.0%)
Swiss: 51 (0.9%)
British: 49 (0.9%)
French: 44 (0.8%)
Lebanese: 43 (0.8%)
Danish: 29 (0.5%)
Syrian: 28 (0.5%)
Slovak: 25 (0.4%)
French Canadian: 22 (0.4%)
Scandinavian: 20 (0.4%)
Welsh: 18 (0.3%)
Greek: 17 (0.3%)
Canadian: 16 (0.3%)
Dutch: 15 (0.3%)
Haitian: 14 (0.2%)
Swedish: 11 (0.2%)
Brazilian: 10 (0.2%)
Russian: 10 (0.2%)
Austrian: 7 (0.1%)
Portuguese: 6 (0.1%)
Most common places of birth for foreign-born residents (%):
South Africa
Lake Norman of Catawba:
13.0% (122)
North Carolina:
0.5% (4,673)
Honduras
Lake Norman of Catawba:
12.8% (121)
North Carolina:
4.7% (40,707)
Brazil
Lake Norman of Catawba:
9.3% (88)
North Carolina:
1.0% (8,426)
China, excluding Hong Kong and Taiwan
Lake Norman of Catawba:
8.5% (80)
North Carolina:
3.2% (27,477)
Colombia
Lake Norman of Catawba:
6.9% (65)
North Carolina:
2.1% (18,275)
Canada
Lake Norman of Catawba:
5.2% (49)
North Carolina:
2.1% (18,105)
United Kingdom, excluding England and Scotland
Lake Norman of Catawba:
5.0% (47)
North Carolina:
1.1% (9,831)
Mexico
Lake Norman of Catawba:
4.9% (46)
North Carolina:
24.7% (214,776)
Korea
Lake Norman of Catawba:
3.8% (36)
North Carolina:
1.8% (15,988)
Germany
Lake Norman of Catawba:
3.6% (34)
North Carolina:
1.8% (15,534)
Other Australian and New Zealand Subregion
Lake Norman of Catawba:
3.6% (34)
North Carolina:
0.1% (922)
Peru
Lake Norman of Catawba:
3.5% (33)
North Carolina:
0.7% (6,091)
Syria
Lake Norman of Catawba:
2.9% (27)
North Carolina:
0.2% (1,332)
Spain
Lake Norman of Catawba:
1.6% (15)
North Carolina:
0.3% (2,183)
Place of birth for U.S.-born residents:
This state: 3,041
Other state: 8,988
Northeast: 4,096
Midwest: 2,957
South: 1,414
West: 715
86.6% of Lake Norman of Catawba residents lived in the same house 1 years ago. Out of people who lived in different houses, 15.9% lived in this county. Out of people who lived in different counties, 19.4% lived in North Carolina.
Lake Norman of Catawba:
86.6%
State average:
87.3%
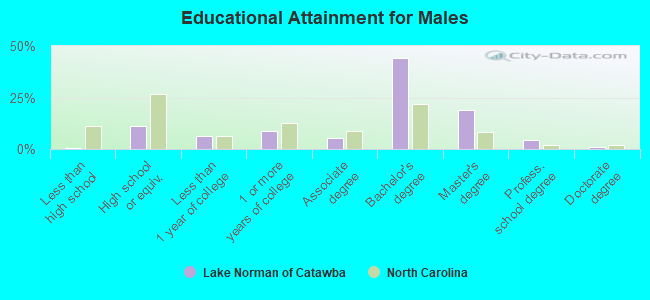
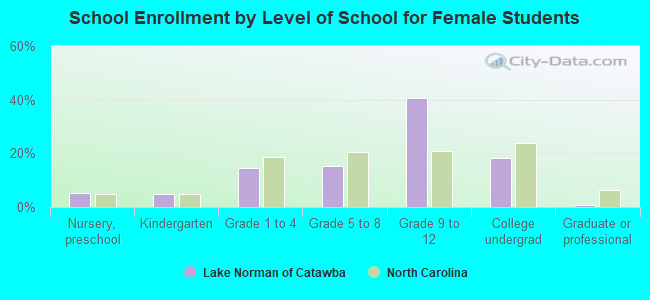
Education attainment for males 25 years and older:
No schooling: 0
Nursery to 4th grade: 0
5th and 6th grade: 0
7th and 8th grade: 0
9th grade: 0
10th grade: 0
11th grade: 8
12th grade, no diploma: 6
High school graduate (or equivalency): 521
Less than 1 year of college: 287
Some college more than 1 year, no degree: 399
Associate degree: 255
Bachelor's degree: 2,068
Master's degree: 875
Professional school degree: 196
Doctorate degree: 55
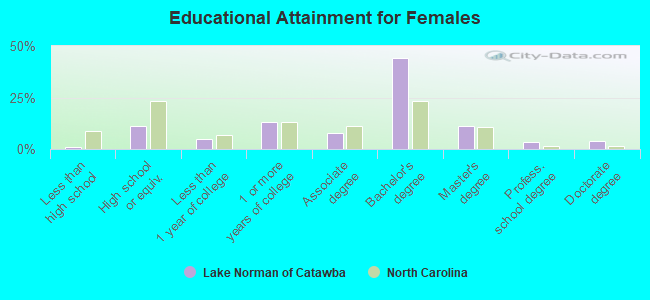
Education attainment for females 25 years and older:
No schooling: 0
Nursery to 4th grade: 0
5th and 6th grade: 9
7th and 8th grade: 0
9th grade: 14
10th grade: 7
11th grade: 0
12th grade, no diploma: 11
High school graduate (or equivalency): 502
Less than 1 year of college: 216
Some college more than 1 year, no degree: 599
Associate degree: 352
Bachelor's degree: 2,028
Master's degree: 517
Professional school degree: 147
Doctorate degree: 178
Housing units in structures:
One, detached: 4,915
One, attached: 50
Two: 26
3 or 4: 21
Mobile homes: 143
Median worth of mobile homes: $204,375
Housing units lacking complete kitchen facilities in 2022: 0.8%