Housing density: 1,954 houses/condos per square mile
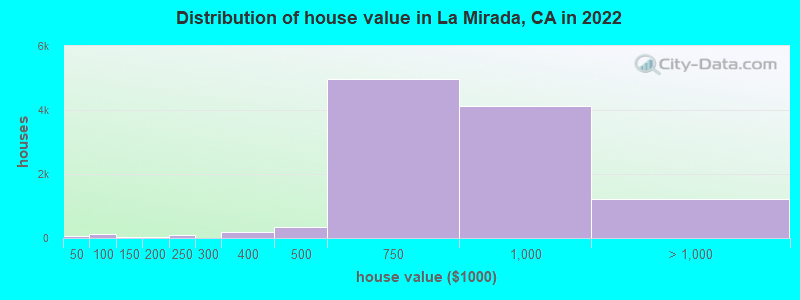
Median price asked for vacant for-sale houses and condos in 2022: $189,581.
Median contract rent in 2022: $1,843 (lower quartile is $1,244, upper quartile is over $2,000)
Median rent asked for vacant for-rent units in 2022: $2,974
Median gross rent in La Mirada, CA in 2022: $1,927
Housing units in La Mirada with a mortgage: 7,535 (710 second mortgage, 27 home equity loan, 577 both second mortgage and home equity loan) Houses without a mortgage: 59
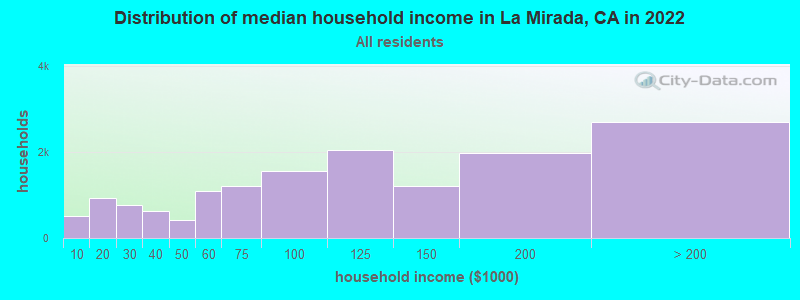
Median household income for houses/condos with a mortgage: $135,739
Median household income for apartments without a mortgage: $79,425
5,454 married couples with children.
1,564 single-parent households (739 men, 825 women).
57.4% of residents of La Mirada speak English at home.
24.4% of residents speak Spanish at home (65% speak English very well, 21% speak English well, 12% speak English not well, 2% don't speak English at all).
2.1% of residents speak other Indo-European language at home (72% speak English very well, 26% speak English well, 2% don't speak English at all).
16.6% of residents speak Asian or Pacific Island language at home (44% speak English very well, 28% speak English well, 26% speak English not well, 3% don't speak English at all).
0.5% of residents speak other language at home (95% speak English very well, 5% speak English well).
Foreign born population: 12,337 (26.5%)
(73.2% of them are naturalized citizens)
Percentage of workers working in this county: 68.5% Number of people working at home: 3,491 (15.1% of all workers)
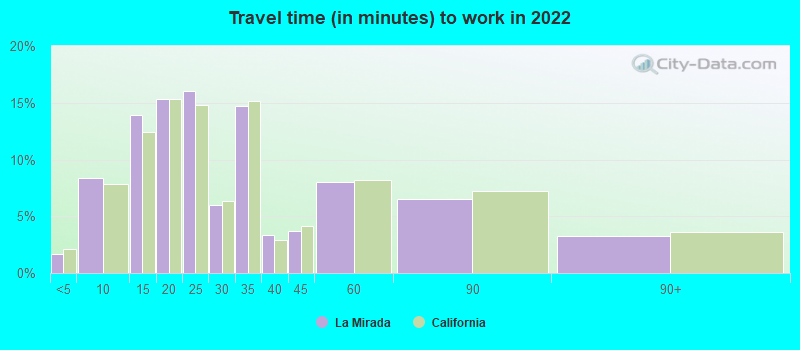
Travel time to work (commute)
Less than 5 minutes: 247
5 to 9 minutes: 1,233
10 to 14 minutes: 1,823
15 to 19 minutes: 2,828
20 to 24 minutes: 2,724
25 to 29 minutes: 1,071
30 to 34 minutes: 2,985
35 to 39 minutes: 634
40 to 44 minutes: 997
45 to 59 minutes: 2,456
60 to 89 minutes: 1,901
90 or more minutes: 523
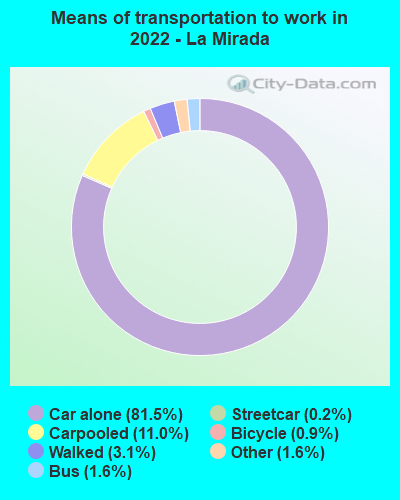
Means of transportation to work:
Drove a car alone: 11,796 (65.7%)
Carpooled: 1,761 (9.8%)
Bus: 216 (1.2%)
Subway or elevated rail: 22 (0.1%)
Taxi: 256 (1.4%)
Bicycle: 132 (0.7%)
Walked: 484 (2.7%)
Worked at home: 3,491 (19.4%)
Unemployment by race in 2022
Unemployment rate for White non-Hispanic residents
5.7%Males
2.7%Females
Unemployment rate for Black residents
5.5%Males
Unemployment rate for Asian residents
3.9%Males
2.2%Females
Unemployment rate for other race residents
2.5%Males
9.3%Females
Unemployment rate for two or more race residents
2.8%Males
1.5%Females
Unemployment rate for Hispanic or Latino residents
3.0%Males
5.8%Females
Year of entry for the foreign-born population in La Mirada, California
1,7542010 or later
1,8372000 to 2009
2,0771990 to 1999
3,4951980 to 1989
2,6971970 to 1979
2,133Before 1970
First ancestries reported:
English: 998 (3.5%)
American: 769 (2.7%)
German: 645 (2.3%)
Irish: 539 (1.9%)
Italian: 468 (1.6%)
European: 359 (1.3%)
Greek: 159 (0.6%)
Scottish: 145 (0.5%)
Dutch: 109 (0.4%)
Swedish: 97 (0.3%)
French Canadian: 90 (0.3%)
Eastern European: 86 (0.3%)
Iranian: 85 (0.3%)
Polish: 80 (0.3%)
African: 70 (0.2%)
French: 57 (0.2%)
Scotch-Irish: 50 (0.2%)
Armenian: 46 (0.2%)
Welsh: 45 (0.2%)
Romanian: 42 (0.1%)
Portuguese: 42 (0.1%)
Norwegian: 40 (0.1%)
West Indian: 36 (0.1%)
Hungarian: 30 (0.1%)
Canadian: 29 (0.1%)
Afghan: 28 (0.10%)
Scandinavian: 27 (0.09%)
Russian: 24 (0.08%)
Lebanese: 23 (0.08%)
Croatian: 20 (0.07%)
Slavic: 14 (0.05%)
British: 12 (0.04%)
Czech: 9 (0.03%)
Pennsylvania German: 8 (0.03%)
Arab: 8 (0.03%)
Egyptian: 8 (0.03%)
Danish: 7 (0.02%)
Haitian: 7 (0.02%)
Northern European: 4 (0.01%)
Czechoslovakian: 3 (0.01%)
Swiss: 3 (0.01%)
Jamaican: 3 (0.01%)
Most common places of birth for foreign-born residents (%):
Korea
La Mirada:
32.2% (3,975)
California:
3.0% (315,248)
Mexico
La Mirada:
23.3% (2,873)
California:
37.2% (3,881,193)
Philippines
La Mirada:
10.5% (1,293)
California:
7.8% (818,297)
El Salvador
La Mirada:
3.8% (472)
California:
4.2% (440,287)
Honduras
La Mirada:
3.4% (418)
California:
0.6% (66,590)
China, excluding Hong Kong and Taiwan
La Mirada:
2.8% (343)
California:
6.6% (684,672)
Guatemala
La Mirada:
2.8% (340)
California:
2.8% (290,436)
India
La Mirada:
2.4% (301)
California:
5.2% (539,184)
Vietnam
La Mirada:
2.3% (284)
California:
4.9% (512,335)
Nicaragua
La Mirada:
1.9% (233)
California:
0.6% (58,161)
Place of birth for U.S.-born residents:
This state: 28,302
Other state: 5,430
Northeast: 1,095
Midwest: 1,643
South: 1,556
West: 1,089
91.1% of La Mirada residents lived in the same house 1 years ago. Out of people who lived in different houses, 33.3% lived in this county. Out of people who lived in different counties, 74.0% lived in California.
La Mirada:
91.1%
State average:
88.9%
Education attainment for males 25 years and older:
No schooling: 489
Nursery to 4th grade: 141
5th and 6th grade: 148
7th and 8th grade: 155
9th grade: 51
10th grade: 37
11th grade: 98
12th grade, no diploma: 310
High school graduate (or equivalency): 3,326
Less than 1 year of college: 875
Some college more than 1 year, no degree: 2,310
Associate degree: 1,271
Bachelor's degree: 4,148
Master's degree: 1,873
Professional school degree: 289
Doctorate degree: 325
Education attainment for females 25 years and older:
No schooling: 324
Nursery to 4th grade: 99
5th and 6th grade: 304
7th and 8th grade: 237
9th grade: 88
10th grade: 144
11th grade: 106
12th grade, no diploma: 352
High school graduate (or equivalency): 3,667
Less than 1 year of college: 1,081
Some college more than 1 year, no degree: 2,374
Associate degree: 1,521
Bachelor's degree: 4,366
Master's degree: 1,496
Professional school degree: 191
Doctorate degree: 235
Housing units in structures:
One, detached: 12,045
One, attached: 655
Two: 100
3 or 4: 166
5 to 9: 372
10 to 19: 286
20 to 49: 398
50 or more: 1,141
Mobile homes: 173
Median worth of mobile homes: $242,275
Housing units lacking complete plumbing facilities in 2022: 0.4%
Housing units lacking complete kitchen facilities in 2022: 2.4%
House/condo owner moved in on average 18 years ago