Kingston, PA (Pennsylvania) Houses and Residents
| Kingston: | $163,257 |
| Pennsylvania: | $245,500 |
Total population: 12,994 (All urban)
Houses: 6,575 (5,912 occupied: 2,799 owner occupied, 3,195 renter occupied)
| % of renters here: | 53% |
| State: | 31% |
Housing density: 3,066 houses/condos per square mile
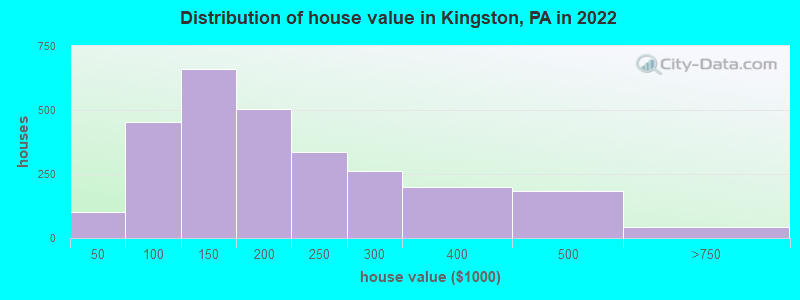
Median price asked for vacant for-sale houses and condos in 2022: $194,534.
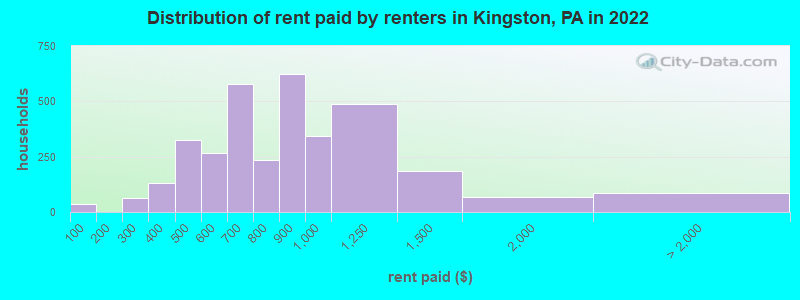
Median contract rent in 2022: $770 (lower quartile is $601, upper quartile is $989)
Median rent asked for vacant for-rent units in 2022: $544
Median gross rent in Kingston, PA in 2022: $978
Housing units in Kingston with a mortgage: 1,557 (233 second mortgage, 0 home equity loan, 174 both second mortgage and home equity loan)
Houses without a mortgage: 82
Median household income for houses/condos with a mortgage: $97,640
Median household income for apartments without a mortgage: $57,737
Median monthly housing costs: $960
Compare current foreclosures in Kingston, PA:
| Photo | Address | Area | Beds / Baths | Price | Details |
|---|---|---|---|---|---|

|
#1
Chestnut Ave
Kingston, PA 18704
|
2,940 sq. feet
|
1 baths 5 beds |
show details | |

|
#2
Slocum St
Kingston, PA 18704
|
- sq. feet
|
2 baths 3 beds |
show details | |

|
#3
Myers St
Kingston, PA 18704
|
- sq. feet
|
1 baths 3 beds |
show details | |

|
#4
Russell St
Kingston, PA 18704
|
- sq. feet
|
- baths - beds |
show details | |

|
#5
Reynolds St Apt 4
Kingston, PA 18704
|
- sq. feet
|
- baths - beds |
show details | |

|
#6
N Atherton Ave
Kingston, PA 18704
|
- sq. feet
|
- baths - beds |
show details | |

|
#7
Bedford St
Kingston, PA 18704
|
- sq. feet
|
- baths - beds |
show details | |

|
#8
Roosevelt St
Kingston, PA 18704
|
1,991 sq. feet
|
- baths - beds |
show details | |

|
#9
2nd Ave Apt 2
Kingston, PA 18704
|
- sq. feet
|
- baths - beds |
show details | |

|
#10
Pringle St
Kingston, PA 18704
|
- sq. feet
|
- baths - beds |
show details |
| Photo | Address | Area | Beds / Baths | Price | Details |
|---|---|---|---|---|---|

|
#11
E Bennett St
Kingston, PA 18704
|
- sq. feet
|
- baths - beds |
show details | |

|
#12
Pringle St
Kingston, PA 18704
|
- sq. feet
|
- baths - beds |
show details | |

|
#13
Penn St
Kingston, PA 18704
|
- sq. feet
|
- baths - beds |
show details | |

|
#14
Holiday Dr Apt 56
Kingston, PA 18704
|
- sq. feet
|
- baths - beds |
show details | |

|
#15
Division St
Kingston, PA 18704
|
- sq. feet
|
- baths - beds |
show details | |

|
#16
Hughes St
Kingston, PA 18704
|
918 sq. feet
|
- baths - beds |
show details | |

|
#17
W Dorrance St
Kingston, PA 18704
|
1,600 sq. feet
|
- baths - beds |
show details | |

|
#18
Roosevelt St
Kingston, PA 18704
|
- sq. feet
|
- baths - beds |
show details | |

|
#19
Pugh St
Kingston, PA 18704
|
- sq. feet
|
- baths - beds |
show details | |

|
#20
Fort St
Kingston, PA 18704
|
- sq. feet
|
- baths - beds |
show details |
| Photo | Address | Area | Beds / Baths | Price | Details |
|---|---|---|---|---|---|

|
#21
Jackson St
Kingston, PA 18704
|
- sq. feet
|
- baths - beds |
show details | |

|
#22
Slocum St
Kingston, PA 18704
|
- sq. feet
|
- baths - beds |
show details | |

|
#23
W Pettebone St
Kingston, PA 18704
|
- sq. feet
|
- baths - beds |
show details | |

|
#24
Hughes St # 4
Kingston, PA 18704
|
- sq. feet
|
- baths - beds |
show details | |

|
#25
Sullivan St
Kingston, PA 18704
|
- sq. feet
|
- baths - beds |
show details | |

|
#26
S Maple Ave
Kingston, PA 18704
|
- sq. feet
|
- baths - beds |
show details | |

|
#27
Meadowland Ave
Kingston, PA 18704
|
- sq. feet
|
- baths - beds |
show details | |

|
#28
Simpson St
Kingston, PA 18704
|
- sq. feet
|
- baths - beds |
show details | |

|
#29
Murray St
Kingston, PA 18704
|
- sq. feet
|
- baths - beds |
show details | |

|
#30
Price St
Kingston, PA 18704
|
- sq. feet
|
- baths - beds |
show details |
| Photo | Address | Area | Beds / Baths | Price | Details |
|---|---|---|---|---|---|

|
#31
W Luzerne Ave
Kingston, PA 18704
|
- sq. feet
|
- baths - beds |
show details | |

|
#32
Pomona St
Kingston, PA 18704
|
- sq. feet
|
- baths - beds |
show details | |

|
#33
Filbert St
Kingston, PA 18704
|
- sq. feet
|
- baths - beds |
show details | |

|
#34
W Vaughn St
Kingston, PA 18704
|
- sq. feet
|
- baths - beds |
show details | |

|
#35
Cooper St
Kingston, PA 18704
|
- sq. feet
|
- baths - beds |
show details | |

|
#36
Lathrop St
Kingston, PA 18704
|
- sq. feet
|
- baths - beds |
show details | |

|
#37
Murray St
Kingston, PA 18704
|
- sq. feet
|
- baths - beds |
show details | |

|
#38
Welles St
Kingston, PA 18704
|
- sq. feet
|
- baths - beds |
show details | |

|
#39
E State St
Kingston, PA 18704
|
- sq. feet
|
- baths - beds |
show details | |

|
#40
2nd Ave
Kingston, PA 18704
|
- sq. feet
|
- baths - beds |
show details |
| Photo | Address | Area | Beds / Baths | Price | Details |
|---|---|---|---|---|---|

|
#41
North Hampton Street
Kingston, PA 18704
|
- sq. feet
|
- baths - beds |
show details | |

|
#42
N Landon Ave
Kingston, PA 18704
|
- sq. feet
|
- baths - beds |
show details | |

|
#43
Grandville Dr
Kingston, PA 18704
|
- sq. feet
|
- baths - beds |
show details | |

|
#44
29 Owen St
Kingston, PA 18704
|
- sq. feet
|
- baths - beds |
show details | |

|
#45
Noyes Ave
Kingston, PA 18704
|
- sq. feet
|
- baths - beds |
show details | |

|
#46
Jackson St
Kingston, PA 18704
|
- sq. feet
|
- baths - beds |
show details | |

|
#47
Dana St
Kingston, PA 18704
|
- sq. feet
|
- baths - beds |
show details | |

|
#48
W Luzerne Ave
Kingston, PA 18704
|
- sq. feet
|
- baths - beds |
show details | |

|
#49
S Thomas Ave
Kingston, PA 18704
|
- sq. feet
|
- baths - beds |
show details | |

|
Check over 1 million property listings on Foreclosure.com!
|
browse all offers | |||

Latest news about housing in Kingston, PA collected exclusively by city-data.com from local newspapers, TV, and radio stations

 | finding rental homes- where? (0 replies) |
| Rentals in Wilkes-Barre/Scranton Area (16 replies) |
| Future NE Penn. residents looking for personal opinions and experiences! (273 replies) |
| Renting a house in NEPA (9 replies) |
| Looking for *nice* single house to rent in WB/Dallas area! (6 replies) |
| Pottery Painting near Kingston? (0 replies) |

Median year apartment built: 1964
Household type by relationship:
Households: 13,356- Male householders: 2,785 (1,153 living alone), Female householders: 3,127 (1,470 living alone)
1,882 spouses (1,882 opposite-sex spouses), 437 unmarried partners, (431 opposite-sex unmarried partners), 3,921 children (3,636 natural, 104 adopted, 180 stepchildren), 187 grandchildren, 99 brothers or sisters, 107 parents, 0 foster children, 80 other relatives, 327 non-relatives
- In group quarters: 400
Size of family households: 1,412 2-persons, 585 3-persons, 605 4-persons, 234 5-persons, 75 6-persons, 50 7-or-more-persons.
Size of nonfamily households: 2,530 1-person, 346 2-persons, 20 3-persons, 51 4-persons, 41 5-persons.
1,420 married couples with children.
1,342 single-parent households (433 men, 909 women).
91.7% of residents of Kingston speak English at home.
3.9% of residents speak Spanish at home (95% speak English very well, 3% speak English well, 1% speak English not well, 1% don't speak English at all).
2.6% of residents speak other Indo-European language at home (74% speak English very well, 25% speak English well, 1% don't speak English at all).
0.6% of residents speak Asian or Pacific Island language at home (91% speak English very well, 9% speak English not well).
0.9% of residents speak other language at home (63% speak English very well, 37% speak English well).
Foreign born population: 512 (3.8%)
(78.9% of them are naturalized citizens)
| Here: | 6.9 |
| State: | 6.8 |
| Here: | 4.1 |
| State: | 4.3 |
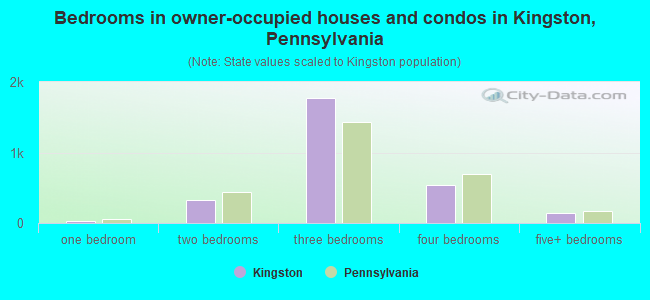
- Bedrooms in owner-occupied houses and condos in Kingston, Pennsylvania
- 0no bedroom
- 271 bedroom
- 3212 bedrooms
- 1,7783 bedrooms
- 5334 bedrooms
- 1405+ bedrooms
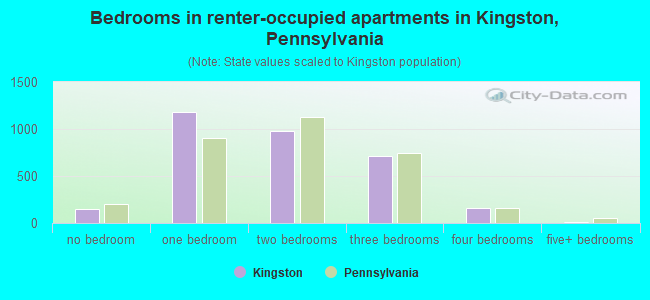
- Bedrooms in renter-occupied apartments in Kingston, Pennsylvania
- 147no bedroom
- 1,1761 bedroom
- 9792 bedrooms
- 7183 bedrooms
- 1624 bedrooms
- 135+ bedrooms
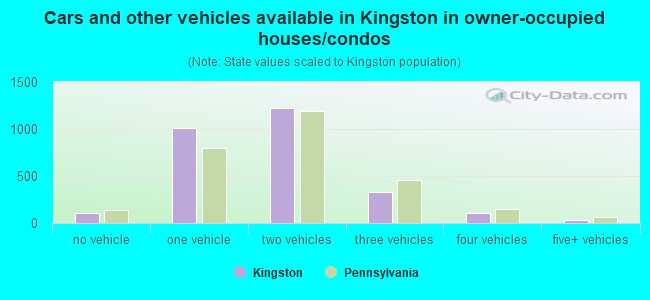
- Cars and other vehicles available in Kingston in owner-occupied houses/condos
- 106no vehicle
- 1,0071 vehicle
- 1,2232 vehicles
- 3263 vehicles
- 1054 vehicles
- 335+ vehicles
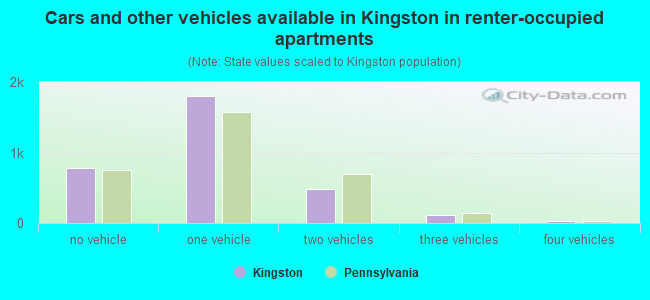
- Cars and other vehicles available in Kingston in renter-occupied apartments
- 775no vehicle
- 1,7991 vehicle
- 4782 vehicles
- 1133 vehicles
- 224 vehicles
- 85+ vehicles
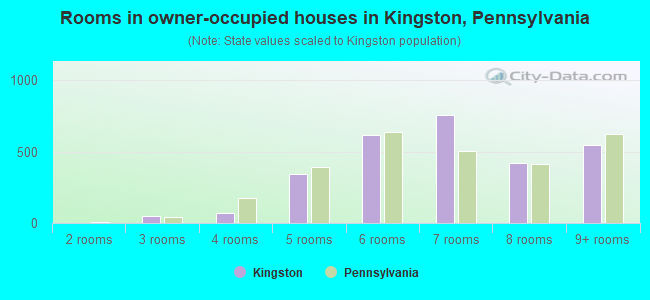
- Rooms in owner-occupied houses in Kingston, Pennsylvania
- 01 room
- 02 rooms
- 463 rooms
- 714 rooms
- 3465 rooms
- 6176 rooms
- 7587 rooms
- 4188 rooms
- 5449+ rooms
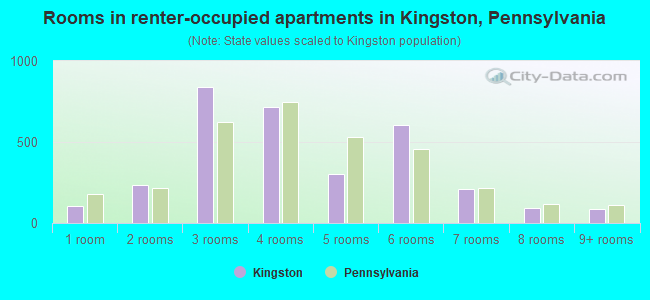
- Rooms in renter-occupied apartments in Kingston, Pennsylvania
- 1061 room
- 2352 rooms
- 8383 rooms
- 7194 rooms
- 3045 rooms
- 6056 rooms
- 2117 rooms
- 938 rooms
- 859+ rooms
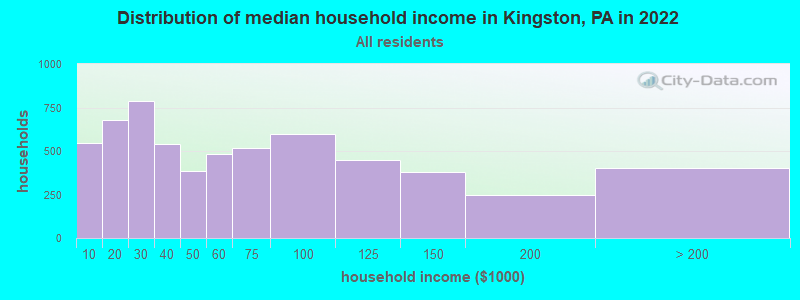
Kingston, PA household income distribution

- 548Less than $10,000
- 677$10,000 to $19,999
- 786$20,000 to $29,999
- 538$30,000 to $39,999
- 386$40,000 to $49,999
- 483$50,000 to $59,999
- 519$60,000 to $74,999
- 597$75,000 to $99,999
- 450$100,000 to $124,999
- 381$125,000 to $149,999
- 248$150,000 to $199,999
- 400$200,000 or more
Home value of owner - occupied houses in 2022 in Kingston, PA
-
- 7Less than $10,000
- 10$15,000 to $19,999
- 8$20,000 to $24,999
- 14$25,000 to $29,999
- 10$30,000 to $34,999
- 48$40,000 to $49,999
- 26$50,000 to $59,999
- 60$60,000 to $69,999
- 137$70,000 to $79,999
- 49$80,000 to $89,999
- 132$90,000 to $99,999
- 215$100,000 to $124,999
- 443$125,000 to $149,999
- 317$150,000 to $174,999
- 187$175,000 to $199,999
- 335$200,000 to $249,999
- 262$250,000 to $299,999
- 201$300,000 to $399,999
- 184$400,000 to $499,999
- 42$500,000 to $749,999
Rent paid by renters in 2022 in Kingston, PA
-
- 35Less than $100
- 43$200 to $249
- 20$250 to $299
- 115$300 to $349
- 15$350 to $399
- 224$400 to $449
- 100$450 to $499
- 108$500 to $549
- 158$550 to $599
- 476$600 to $649
- 102$650 to $699
- 180$700 to $749
- 55$750 to $799
- 623$800 to $899
- 341$900 to $999
- 486$1,000 to $1,249
- 182$1,250 to $1,499
- 69$1,500 to $1,999
- 83No cash rent
Percentage of workers working in this county: 90.4%
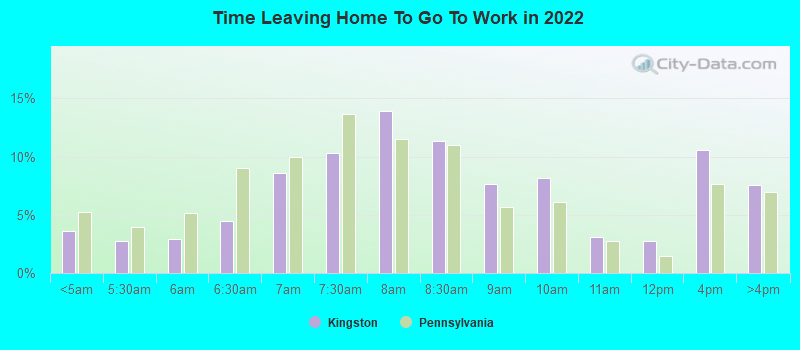
Number of people working at home: 843 (12.6% of all workers)
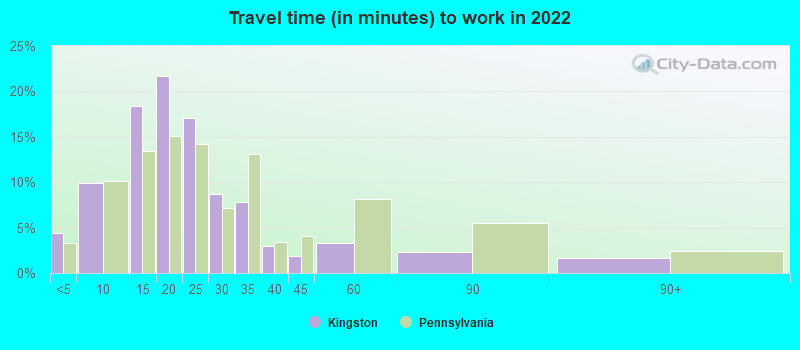
Travel time to work (commute)
- Less than 5 minutes: 265
- 5 to 9 minutes: 1,003
- 10 to 14 minutes: 1,432
- 15 to 19 minutes: 1,118
- 20 to 24 minutes: 695
- 25 to 29 minutes: 231
- 30 to 34 minutes: 460
- 35 to 39 minutes: 88
- 40 to 44 minutes: 104
- 45 to 59 minutes: 172
- 60 to 89 minutes: 97
- 90 or more minutes: 84
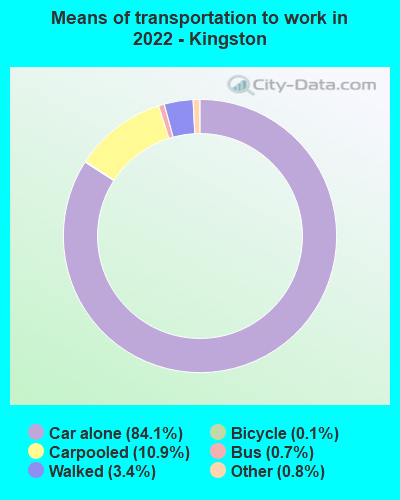
Means of transportation to work:
- Drove a car alone: 5,072 (73.6%)
- Carpooled: 696 (10.1%)
- Bus: 41 (0.6%)
- Taxi: 56 (0.8%)
- Bicycle: 9 (0.1%)
- Walked: 192 (2.8%)
- Worked at home: 843 (12.2%)
- Unemployment by race in 2022
- Unemployment rate for White non-Hispanic residents
- 2.1%Males
- 4.1%Females
- Unemployment rate for Black residents
- 16.6%Males
- 26.1%Females
- Unemployment rate for American Indian and Alaska Native residents
- 100.0%Males
- Unemployment rate for Asian residents
- 17.4%Males
- Unemployment rate for two or more race residents
- 27.2%Females
- Unemployment rate for Hispanic or Latino residents
- 39.1%Females
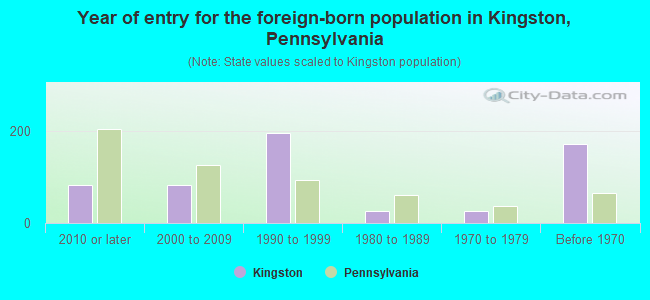
- Year of entry for the foreign-born population in Kingston, Pennsylvania
- 822010 or later
- 832000 to 2009
- 1961990 to 1999
- 271980 to 1989
- 271970 to 1979
- 173Before 1970
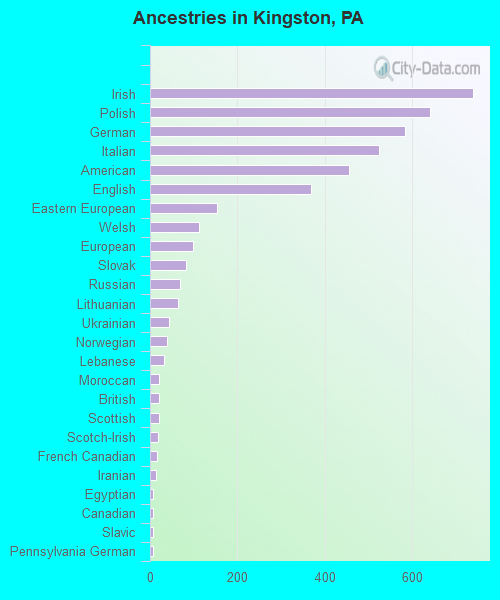
First ancestries reported:
- Irish: 738 (14.8%)
- Polish: 639 (12.8%)
- German: 582 (11.7%)
- Italian: 524 (10.5%)
- American: 456 (9.1%)
- English: 368 (7.4%)
- Eastern European: 154 (3.1%)
- Welsh: 113 (2.3%)
- European: 99 (2.0%)
- Slovak: 83 (1.7%)
- Russian: 69 (1.4%)
- Lithuanian: 64 (1.3%)
- Ukrainian: 44 (0.9%)
- Norwegian: 40 (0.8%)
- Lebanese: 32 (0.6%)
- Moroccan: 21 (0.4%)
- British: 20 (0.4%)
- Scottish: 20 (0.4%)
- Scotch-Irish: 18 (0.4%)
- French Canadian: 16 (0.3%)
- Iranian: 14 (0.3%)
- Egyptian: 8 (0.2%)
- Canadian: 8 (0.2%)
- Slavic: 8 (0.2%)
- Pennsylvania German: 7 (0.1%)
- Hungarian: 5 (0.1%)
- African: 3 (0.06%)
- Swiss: 3 (0.06%)
Most common places of birth for foreign-born residents (%):
| Kingston: | 12.8% (65) |
| Pennsylvania: | 10.7% (100,596) |
| Kingston: | 11.6% (59) |
| Pennsylvania: | 1.8% (17,032) |
| Kingston: | 11.4% (58) |
| Pennsylvania: | 1.3% (12,172) |
| Kingston: | 7.1% (36) |
| Pennsylvania: | 1.6% (15,272) |
| Kingston: | 7.1% (36) |
| Pennsylvania: | 0.5% (4,648) |
| Kingston: | 6.3% (32) |
| Pennsylvania: | 0.1% (777) |
| Kingston: | 5.3% (27) |
| Pennsylvania: | 2.2% (21,039) |
| Kingston: | 5.3% (27) |
| Pennsylvania: | 0.1% (1,376) |
| Kingston: | 3.3% (17) |
| Pennsylvania: | 0.7% (6,643) |
| Kingston: | 3.1% (16) |
| Pennsylvania: | 0.5% (4,483) |
| Kingston: | 2.4% (12) |
| Pennsylvania: | 2.1% (19,841) |
| Kingston: | 2.4% (12) |
| Pennsylvania: | 1.9% (18,065) |
| Kingston: | 2.2% (11) |
| Pennsylvania: | 0.4% (4,068) |
| Kingston: | 1.6% (8) |
| Pennsylvania: | 1.8% (16,884) |
| Kingston: | 1.6% (8) |
| Pennsylvania: | 0.4% (4,204) |
| Kingston: | 1.6% (8) |
| Pennsylvania: | 0.8% (7,272) |
| Kingston: | 1.6% (8) |
| Pennsylvania: | 2.4% (22,612) |
| Kingston: | 1.6% (8) |
| Pennsylvania: | 0.5% (4,519) |
Place of birth for U.S.-born residents:
- This state: 9,713
- Other state: 2,950
- Northeast: 1,756
- Midwest: 149
- South: 474
- West: 612
85.9% of Kingston residents lived in the same house 1 years ago.
Out of people who lived in different houses, 43.2% lived in this county.
Out of people who lived in different counties, 32.7% lived in Pennsylvania.
| Kingston: | 85.9% |
| State average: | 89.3% |
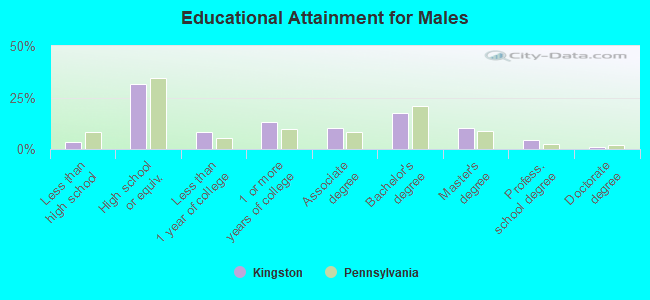
Education attainment for males 25 years and older:
- No schooling: 21
- Nursery to 4th grade: 0
- 5th and 6th grade: 4
- 7th and 8th grade: 52
- 9th grade: 2
- 10th grade: 18
- 11th grade: 34
- 12th grade, no diploma: 26
- High school graduate (or equivalency): 1,381
- Less than 1 year of college: 367
- Some college more than 1 year, no degree: 570
- Associate degree: 444
- Bachelor's degree: 775
- Master's degree: 452
- Professional school degree: 185
- Doctorate degree: 46
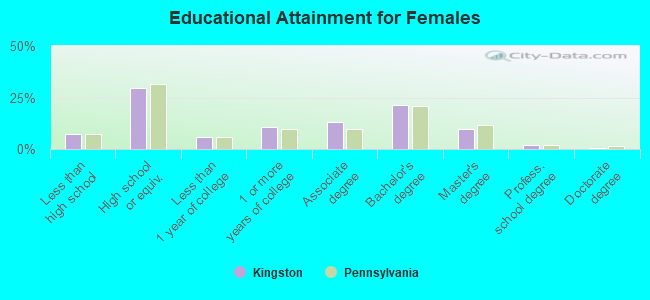
Education attainment for females 25 years and older:
- No schooling: 127
- Nursery to 4th grade: 9
- 5th and 6th grade: 0
- 7th and 8th grade: 16
- 9th grade: 38
- 10th grade: 8
- 11th grade: 48
- 12th grade, no diploma: 126
- High school graduate (or equivalency): 1,486
- Less than 1 year of college: 288
- Some college more than 1 year, no degree: 527
- Associate degree: 654
- Bachelor's degree: 1,058
- Master's degree: 494
- Professional school degree: 95
- Doctorate degree: 23


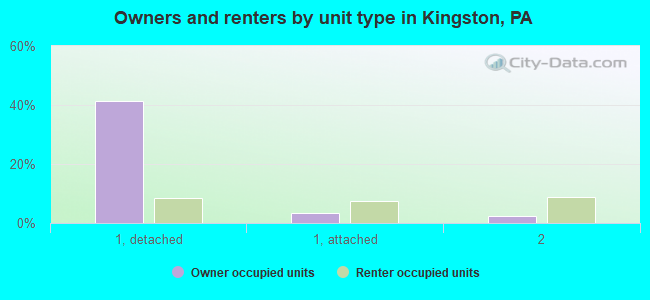
Housing units in structures:
- One, detached: 3,119
- One, attached: 927
- Two: 648
- 3 or 4: 840
- 5 to 9: 311
- 10 to 19: 153
- 20 to 49: 126
- 50 or more: 429
- Mobile homes: 18
Housing units lacking complete kitchen facilities in 2022: 1.1%
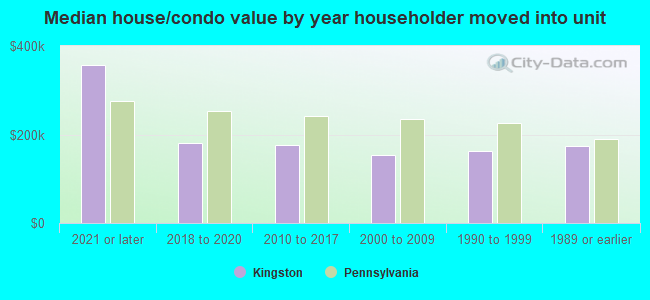
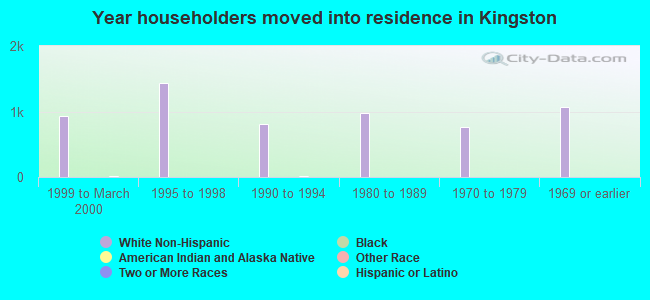
House/condo owner moved in on average 15 years ago
Renter moved in on average 3 years ago
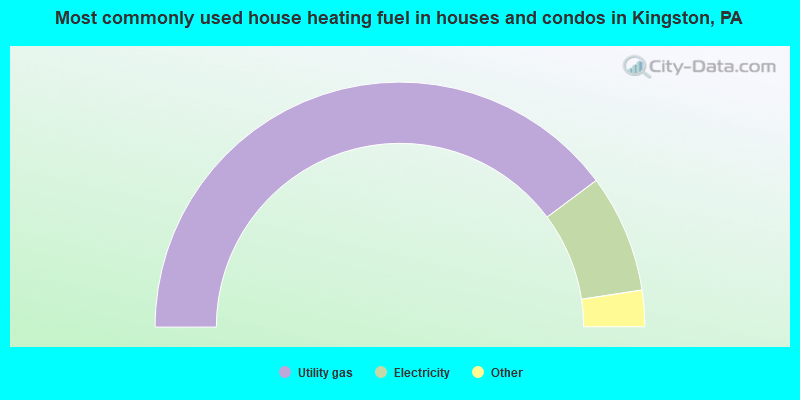
- 79.6%Utility gas
- 15.6%Electricity
- 2.0%Fuel oil, kerosene, etc.
- 2.0%Bottled, tank, or LP gas
- 0.7%Wood
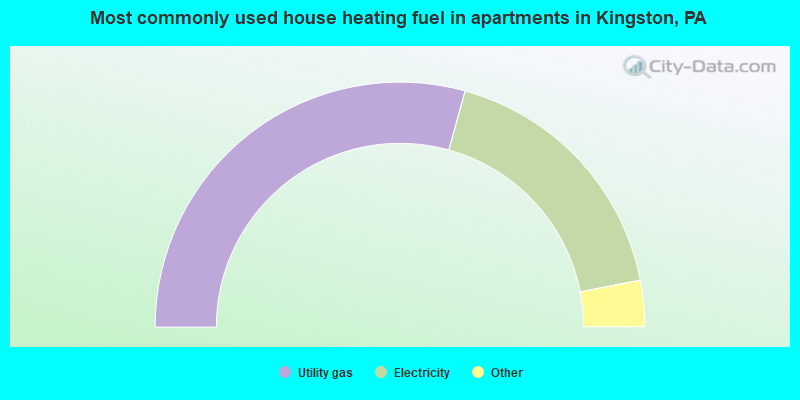
- 58.6%Utility gas
- 35.3%Electricity
- 1.9%No fuel used
- 1.7%Bottled, tank, or LP gas
- 1.5%Fuel oil, kerosene, etc.
- 0.5%Coal or coke
- 0.5%Other fuel
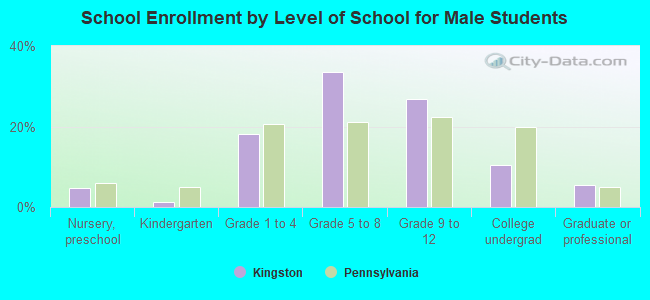
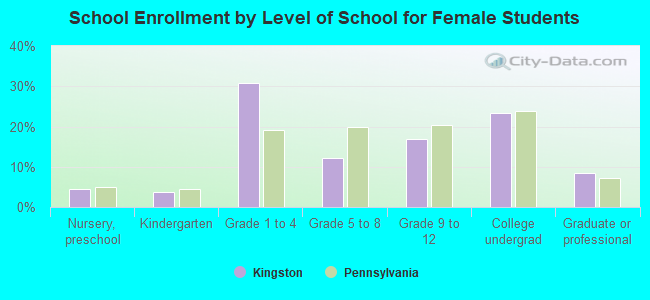
Private vs. public school enrollment:
| Here: | 23.1% |
| Pennsylvania: | 15.7% |
| Here: | 29.8% |
| Pennsylvania: | 13.4% |
| Here: | 46.1% |
| Pennsylvania: | 39.8% |