Heber Springs, AR (Arkansas) Houses and Residents
| Heber Springs: | $161,532 |
| Arkansas: | $179,800 |
Mean price in 2022:
Detached houses: $219,883
Here: $219,883 State: $243,881 Mobile homes: $33,762
Here: $33,762 State: $79,566
Total population: 7,174 (Urban population: 5,420 (all inside urban clusters), Rural population: 802 (all nonfarm))
Houses: 3,600 (3,138 occupied: 2,116 owner occupied, 1,084 renter occupied)
| % of renters here: | 34% |
| State: | 34% |
Housing density: 517 houses/condos per square mile
Median price asked for vacant for-sale houses and condos in 2022 in this county: $146,975.
Median contract rent in 2022: $581 (lower quartile is $512, upper quartile is $659)
Median rent asked for vacant for-rent units in 2022: $722
Median gross rent in Heber Springs, AR in 2022: $841
Housing units in Heber Springs with a mortgage: 819 (28 second mortgage, 0 home equity loan, 14 both second mortgage and home equity loan)
Houses without a mortgage: 33
Median household income for houses/condos with a mortgage: $57,392
Median household income for apartments without a mortgage: $52,758
Median monthly housing costs: $696
Compare current foreclosures near Heber Springs, AR:
| Photo | Address | Area | Beds / Baths | Price | Details |
|---|---|---|---|---|---|

|
#1
Hazel
Heber Springs, AR 72543
|
1,520 sq. feet
|
2 baths 3 beds |
show details | |

|
#2
Caddo Rd
Heber Springs, AR 72543
|
- sq. feet
|
2 baths 3 beds |
show details | |

|
#3
W Maple St
Heber Springs, AR 72543
|
1,012 sq. feet
|
1 baths - beds |
show details | |

|
#4
Star Rd
Heber Springs, AR 72543
|
1,680 sq. feet
|
1 baths - beds |
show details | |

|
#5
Ferguson Rd
Heber Springs, AR 72543
|
1,560 sq. feet
|
1 baths - beds |
show details | |

|
#6
Lee St
Heber Springs, AR 72543
|
1,230 sq. feet
|
2 baths - beds |
show details | |

|
#7
Pangburn Rd
Heber Springs, AR 72543
|
1,200 sq. feet
|
1 baths - beds |
show details | |

|
#8
Sager Rd
Heber Springs, AR 72543
|
2,176 sq. feet
|
1 baths - beds |
show details | |

|
#9
W Sugarloaf St
Heber Springs, AR 72543
|
1,380 sq. feet
|
1 baths - beds |
show details | |

|
#10
Wilson St
Heber Springs, AR 72543
|
2,100 sq. feet
|
2 baths - beds |
show details |
| Photo | Address | Area | Beds / Baths | Price | Details |
|---|---|---|---|---|---|

|
#11
Heber Springs Rd W
Heber Springs, AR 72543
|
1,377 sq. feet
|
1 baths - beds |
show details | |

|
#12
Frauenthal St # 17
Heber Springs, AR 72543
|
- sq. feet
|
- baths - beds |
show details | |

|
#13
Hazel
Heber Springs, AR 72543
|
- sq. feet
|
- baths - beds |
show details | |

|
#14
Larkspur Loop
Heber Springs, AR 72543
|
- sq. feet
|
- baths - beds |
show details | |

|
#15
Harbor Hill Rd
Heber Springs, AR 72543
|
- sq. feet
|
- baths - beds |
show details | |

|
#16
Cedar Cir
Heber Springs, AR 72543
|
- sq. feet
|
- baths - beds |
show details | |

|
#17
Wilson St
Heber Springs, AR 72543
|
- sq. feet
|
- baths - beds |
show details | |

|
#18
Riverland Cir
Heber Springs, AR 72543
|
- sq. feet
|
- baths - beds |
show details | |

|
#19
Sunshine Dr
Heber Springs, AR 72543
|
- sq. feet
|
- baths - beds |
show details | |

|
#20
W Smokey Rdg
Heber Springs, AR 72543
|
- sq. feet
|
- baths - beds |
show details |
| Photo | Address | Area | Beds / Baths | Price | Details |
|---|---|---|---|---|---|

|
#21
Highway 36 W
Rose Bud, AR 72137
|
1,540 sq. feet
|
3 baths 3 beds |
$159,900
|
show details |

|
#22
Greers Ferry Rd
Drasco, AR 72530
|
1,006 sq. feet
|
2 baths 3 beds |
show details | |

|
#23
Sibley Trl
Searcy, AR 72143
|
1,970 sq. feet
|
3 baths 3 beds |
show details | |

|
#24
Heritage Dr
Higden, AR 72067
|
2,112 sq. feet
|
3 baths - beds |
show details | |

|
#25
Heritage Dr
Higden, AR 72067
|
1,620 sq. feet
|
2 baths - beds |
show details | |

|
#26
Heritage Dr
Higden, AR 72067
|
2,016 sq. feet
|
2 baths - beds |
show details | |

|
#27
Brewer Rd
Edgemont, AR 72044
|
2,417 sq. feet
|
1 baths - beds |
show details | |

|
#28
Tracy Ann Ter
Shirley, AR 72153
|
3,396 sq. feet
|
2 baths - beds |
show details | |

|
#29
Heber Springs Rd N
Concord, AR 72523
|
1,020 sq. feet
|
1 baths - beds |
show details | |

|
#30
Highway 107
Quitman, AR 72131
|
2,075 sq. feet
|
2 baths - beds |
show details |
| Photo | Address | Area | Beds / Baths | Price | Details |
|---|---|---|---|---|---|

|
#31
Shadow Ridge Ln
Fairfield Bay, AR 72088
|
1,300 sq. feet
|
3 baths - beds |
show details | |

|
#32
Silver Fox Ct # B
Romance, AR 72136
|
1,568 sq. feet
|
1 baths - beds |
show details | |

|
#33
Creech Rd
Quitman, AR 72131
|
1,200 sq. feet
|
1 baths - beds |
show details | |

|
#34
Teal Trl
Shirley, AR 72153
|
2,011 sq. feet
|
2 baths - beds |
show details | |

|
#35
Dekalb Rd
Tumbling Shoals, AR 72581
|
2,100 sq. feet
|
2 baths - beds |
show details | |

|
#36
Heber Springs Rd N
Tumbling Shoals, AR 72581
|
1,104 sq. feet
|
1 baths - beds |
show details | |

|
#37
Wesley Chapel Rd
Quitman, AR 72131
|
1,904 sq. feet
|
1 baths - beds |
show details | |

|
#38
Brownsville Rd
Higden, AR 72067
|
1,232 sq. feet
|
1 baths - beds |
show details | |

|
#39
Denis
Quitman, AR 72131
|
1,008 sq. feet
|
1 baths - beds |
show details | |

|
#40
Little Rock Rd
Rose Bud, AR 72137
|
1,200 sq. feet
|
2 baths - beds |
show details |
| Photo | Address | Area | Beds / Baths | Price | Details |
|---|---|---|---|---|---|

|
#41
Chapel Lake Cir
Quitman, AR 72131
|
832 sq. feet
|
1 baths - beds |
show details | |

|
#42
Poole Dr
Rose Bud, AR 72137
|
1,056 sq. feet
|
2 baths - beds |
show details | |

|
#43
Pine Grove Rd
Concord, AR 72523
|
- sq. feet
|
- baths - beds |
show details | |

|
#44
Banner Loop
Concord, AR 72523
|
- sq. feet
|
- baths - beds |
show details | |

|
#45
Cedar Branch Loop
Mount Vernon, AR 72111
|
- sq. feet
|
- baths - beds |
show details | |

|
#46
Wadley Rd
Romance, AR 72136
|
- sq. feet
|
- baths - beds |
show details | |

|
#47
E Main St
Letona, AR 72085
|
- sq. feet
|
- baths - beds |
show details | |

|
#48
Daffodil Rd
Romance, AR 72136
|
- sq. feet
|
- baths - beds |
show details | |

|
#49
Hanover Rd
Edgemont, AR 72044
|
- sq. feet
|
- baths - beds |
show details | |

|
Check over 1 million property listings on Foreclosure.com!
|
browse all offers | |||


 | Mountain Home or Heber Springs? (5 replies) |
| couple in 60's wants permanent home out of the cold winters, with decent medical facilities (40 replies) |
| Tell me about Heber Springs (4 replies) |
| cherokee village, arkansas, the good, the bad, and the ugly (113 replies) |
| Mountain Home (29 replies) |
| Non-Resident Arkansas Home Owner (10 replies) |

Median year apartment built: 1978
Household type by relationship:
Households: 7,129- Male householders: 1,579 (415 living alone), Female householders: 1,531 (758 living alone)
1,406 spouses (1,406 opposite-sex spouses), 120 unmarried partners, (120 opposite-sex unmarried partners), 1,848 children (1,700 natural, 0 adopted, 148 stepchildren), 72 grandchildren, 0 brothers or sisters, 37 parents, 0 foster children, 123 other relatives, 98 non-relatives
- In group quarters: 310
Size of family households: 1,014 2-persons, 370 3-persons, 289 4-persons, 176 5-persons, 3 6-persons.
Size of nonfamily households: 1,272 1-person, 76 2-persons, 12 3-persons.
1,094 married couples with children.
175 single-parent households (78 men, 97 women).
98.4% of residents of Heber Springs speak English at home.
1.2% of residents speak Spanish at home (73% speak English very well, 27% speak English well).
0.2% of residents speak other Indo-European language at home (100% speak English very well).
Foreign born population: 58 (0.8%)
(24.1% of them are naturalized citizens)
| Here: | 5.9 |
| State: | 6.1 |
| Here: | 4.7 |
| State: | 4.3 |

- Bedrooms in owner-occupied houses and condos in Heber Springs, Arkansas
- 0no bedroom
- 501 bedroom
- 3922 bedrooms
- 1,3393 bedrooms
- 3324 bedrooms
- 35+ bedrooms

- Bedrooms in renter-occupied apartments in Heber Springs, Arkansas
- 0no bedroom
- 761 bedroom
- 5432 bedrooms
- 4123 bedrooms
- 544 bedrooms
- 05+ bedrooms

- Cars and other vehicles available in Heber Springs in owner-occupied houses/condos
- 15no vehicle
- 5891 vehicle
- 1,1242 vehicles
- 2813 vehicles
- 714 vehicles
- 375+ vehicles

- Cars and other vehicles available in Heber Springs in renter-occupied apartments
- 131no vehicle
- 4991 vehicle
- 3552 vehicles
- 1003 vehicles
- 04 vehicles
- 05+ vehicles

- Rooms in owner-occupied houses in Heber Springs, Arkansas
- 01 room
- 02 rooms
- 183 rooms
- 1894 rooms
- 6715 rooms
- 4216 rooms
- 3247 rooms
- 1658 rooms
- 3299+ rooms

- Rooms in renter-occupied apartments in Heber Springs, Arkansas
- 01 room
- 02 rooms
- 983 rooms
- 3564 rooms
- 3235 rooms
- 1726 rooms
- 1267 rooms
- 108 rooms
- 09+ rooms


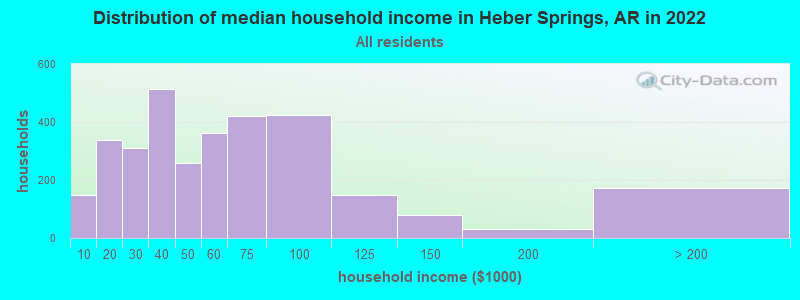
Heber Springs, AR household income distribution

- 147Less than $10,000
- 339$10,000 to $19,999
- 312$20,000 to $29,999
- 514$30,000 to $39,999
- 260$40,000 to $49,999
- 362$50,000 to $59,999
- 419$60,000 to $74,999
- 425$75,000 to $99,999
- 147$100,000 to $124,999
- 81$125,000 to $149,999
- 31$150,000 to $199,999
- 174$200,000 or more
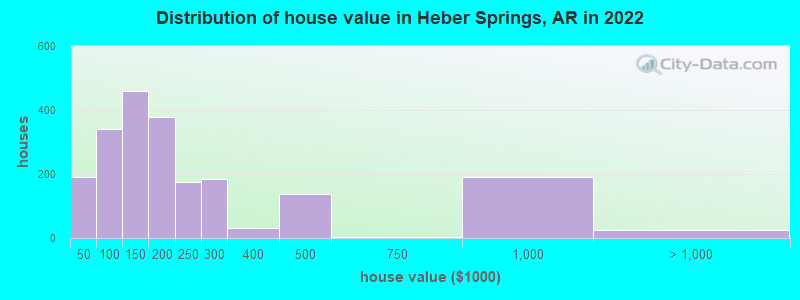
Home value of owner - occupied houses in 2022 in Heber Springs, AR
-
- 8Less than $10,000
- 7$10,000 to $14,999
- 105$15,000 to $19,999
- 19$20,000 to $24,999
- 26$30,000 to $34,999
- 7$35,000 to $39,999
- 17$40,000 to $49,999
- 36$60,000 to $69,999
- 99$70,000 to $79,999
- 131$80,000 to $89,999
- 55$90,000 to $99,999
- 299$100,000 to $124,999
- 159$125,000 to $149,999
- 148$150,000 to $174,999
- 229$175,000 to $199,999
- 175$200,000 to $249,999
- 182$250,000 to $299,999
- 30$300,000 to $399,999
- 139$400,000 to $499,999
- 4$500,000 to $749,999
- 189$750,000 to $999,999
- 23$1,000,000 to $1,499,999
Rent paid by renters in 2022 in Heber Springs, AR
-
- 38$150 to $199
- 20$200 to $249
- 61$250 to $299
- 4$350 to $399
- 38$400 to $449
- 58$450 to $499
- 118$500 to $549
- 226$550 to $599
- 188$600 to $649
- 60$650 to $699
- 45$700 to $749
- 51$750 to $799
- 19$800 to $899
- 29$900 to $999
- 72$1,000 to $1,249
- 21No cash rent


Percentage of workers working in this county: 78.6%
Number of people working at home: 368 (13.0% of all workers)
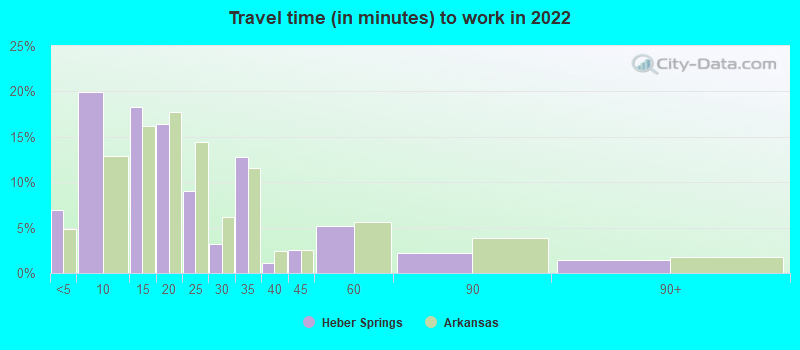
Travel time to work (commute)
- Less than 5 minutes: 247
- 5 to 9 minutes: 533
- 10 to 14 minutes: 673
- 15 to 19 minutes: 252
- 20 to 24 minutes: 59
- 25 to 29 minutes: 33
- 30 to 34 minutes: 145
- 35 to 39 minutes: 7
- 40 to 44 minutes: 55
- 45 to 59 minutes: 213
- 60 to 89 minutes: 136
- 90 or more minutes: 99
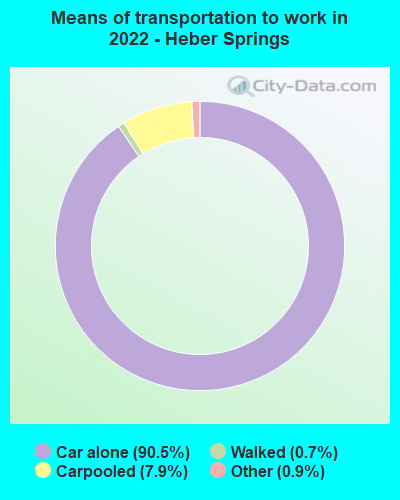
Means of transportation to work:
- Drove a car alone: 2,994 (82.6%)
- Carpooled: 227 (6.3%)
- Taxi: 32 (0.9%)
- Walked: 24 (0.7%)
- Worked at home: 368 (10.2%)

- Unemployment by race in 2022
- Unemployment rate for White non-Hispanic residents
- 6.8%Males
- 2.5%Females

- Year of entry for the foreign-born population in Heber Springs, Arkansas
- 02010 or later
- 442000 to 2009
- 01990 to 1999
- 141980 to 1989
- 01970 to 1979
- 52Before 1970

First ancestries reported:
- English: 1,111 (35.0%)
- Irish: 502 (15.8%)
- American: 397 (12.5%)
- German: 276 (8.7%)
- European: 102 (3.2%)
- Scotch-Irish: 80 (2.5%)
- Scottish: 72 (2.3%)
- Northern European: 25 (0.8%)
- Welsh: 25 (0.8%)
- Polish: 23 (0.7%)
- British: 19 (0.6%)
- Norwegian: 11 (0.3%)
- Dutch: 7 (0.2%)
- French Canadian: 7 (0.2%)
- Italian: 6 (0.2%)
- Scandinavian: 6 (0.2%)
Most common places of birth for foreign-born residents (%):
| Heber Springs: | 72.4% (42) |
| Arkansas: | 40.2% (61,075) |
| Heber Springs: | 22.4% (13) |
| Arkansas: | 1.4% (2,174) |
Place of birth for U.S.-born residents:
- This state: 3,705
- Other state: 3,384
- Northeast: 221
- Midwest: 811
- South: 1,561
- West: 798
78.9% of Heber Springs residents lived in the same house 1 years ago.
Out of people who lived in different houses, 34.1% lived in this county.
Out of people who lived in different counties, 46.8% lived in Arkansas.
| Heber Springs: | 78.9% |
| State average: | 87.0% |
Education attainment for males 25 years and older:
- No schooling: 0
- Nursery to 4th grade: 0
- 5th and 6th grade: 22
- 7th and 8th grade: 30
- 9th grade: 0
- 10th grade: 75
- 11th grade: 116
- 12th grade, no diploma: 31
- High school graduate (or equivalency): 1,276
- Less than 1 year of college: 226
- Some college more than 1 year, no degree: 288
- Associate degree: 220
- Bachelor's degree: 124
- Master's degree: 73
- Professional school degree: 33
- Doctorate degree: 14

Education attainment for females 25 years and older:
- No schooling: 0
- Nursery to 4th grade: 0
- 5th and 6th grade: 18
- 7th and 8th grade: 26
- 9th grade: 21
- 10th grade: 60
- 11th grade: 112
- 12th grade, no diploma: 19
- High school graduate (or equivalency): 947
- Less than 1 year of college: 274
- Some college more than 1 year, no degree: 328
- Associate degree: 371
- Bachelor's degree: 388
- Master's degree: 109
- Professional school degree: 10
- Doctorate degree: 34


Housing units in structures:
- One, detached: 2,956
- One, attached: 144
- Two: 114
- 3 or 4: 173
- 5 to 9: 6
- 20 to 49: 5
- Mobile homes: 199
Housing units lacking complete kitchen facilities in 2022: 1.3%
House/condo owner moved in on average 10 years ago
Renter moved in on average 3 years ago

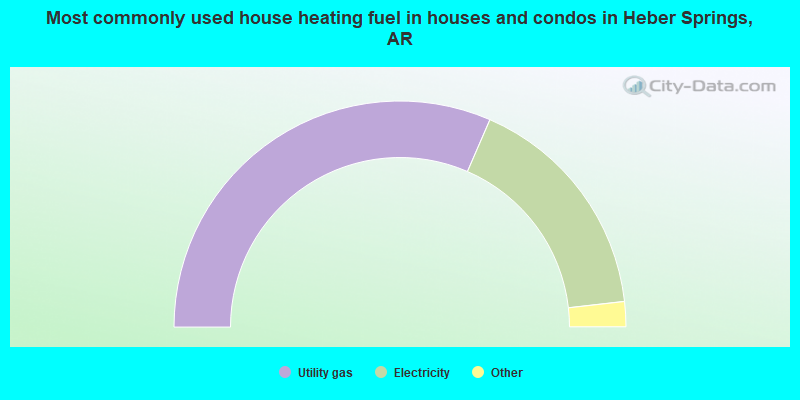
- 63.1%Utility gas
- 33.4%Electricity
- 2.4%Bottled, tank, or LP gas
- 0.4%Wood
- 0.4%Other fuel
- 0.3%Solar energy
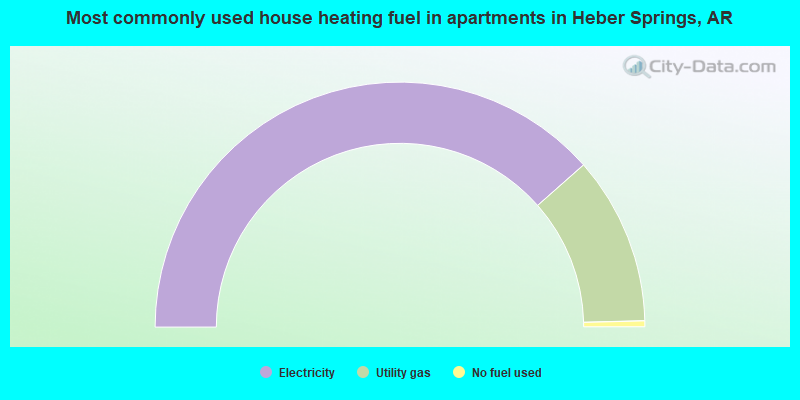
- 77.0%Electricity
- 22.2%Utility gas
- 0.8%No fuel used
Private vs. public school enrollment:
| Here: | 0.0% |
| Arkansas: | 10.5% |
| Here: | 7.7% |
| Arkansas: | 8.7% |
| Here: | 46.8% |
| Arkansas: | 19.4% |


