Franklin Park, PA (Pennsylvania) Houses and Residents
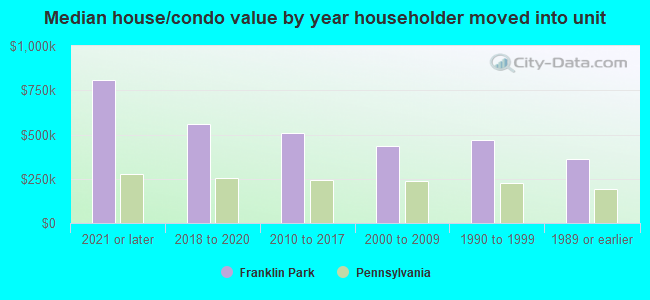
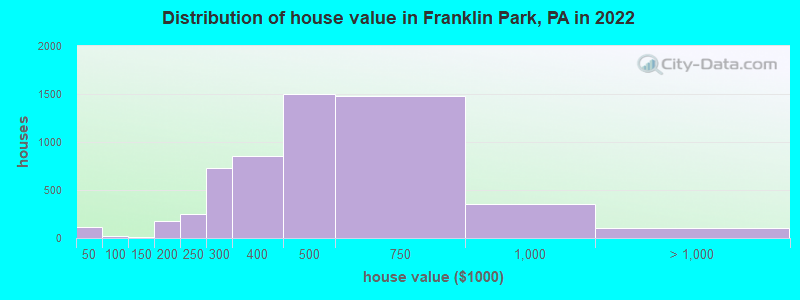
| Franklin Park: | $483,155 |
| Pennsylvania: | $245,500 |
Total population: 14,269 (Urban population: 10,343, Rural population: 1,021 (all nonfarm))
Houses: 5,698 (5,388 occupied: 4,864 owner occupied, 428 renter occupied)
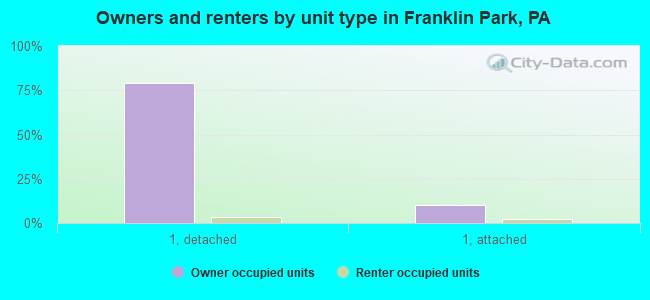
| % of renters here: | 8% |
| State: | 31% |
Housing density: 419 houses/condos per square mile
Median price asked for vacant for-sale houses and condos in 2022: $193,504.
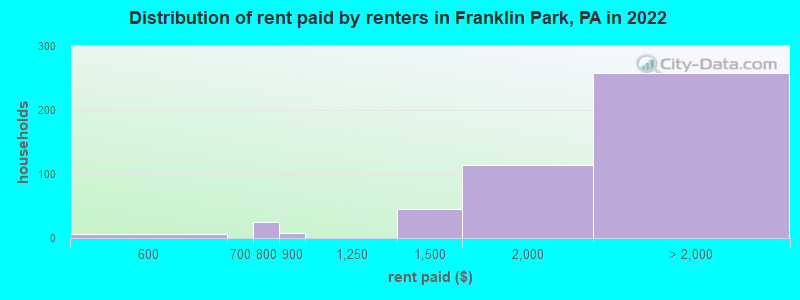
Median contract rent in 2022: $1,902 (lower quartile is $1,500, upper quartile is over $2,000)
Median rent asked for vacant for-rent units in 2022: $1,801
Median gross rent in Franklin Park, PA in 2022: $1,960
Housing units in Franklin Park with a mortgage: 3,229 (496 second mortgage, 18 home equity loan, 454 both second mortgage and home equity loan)
Houses without a mortgage: 188
Median household income for houses/condos with a mortgage: $173,412
Median household income for apartments without a mortgage: $123,063
Median monthly housing costs: $1,935
Compare current foreclosures near Franklin Park, PA:
| Photo | Address | Area | Beds / Baths | Price | Details |
|---|---|---|---|---|---|

|
#1
Muirfield Dr
Presto, PA 15142
|
4,801 sq. feet
|
4 baths 5 beds |
$709,500
|
show details |

|
#2
Perrysville Ave
Pittsburgh, PA 15202
|
2,306 sq. feet
|
1 baths 4 beds |
$457,000
|
show details |

|
#3
Shady Ln
Aliquippa, PA 15001
|
1,440 sq. feet
|
2 baths 3 beds |
$159,900
|
show details |

|
#4
Munson Ave
Mc Kees Rocks, PA 15136
|
1,600 sq. feet
|
1 baths 3 beds |
$159,500
|
show details |

|
#5
Kirk Ave
Pittsburgh, PA 15227
|
1,500 sq. feet
|
2 baths 3 beds |
$197,500
|
show details |

|
#6
Brinwood Ave
Pittsburgh, PA 15227
|
1,000 sq. feet
|
2 baths 3 beds |
$222,900
|
show details |

|
#7
Mount Vernon St
Pittsburgh, PA 15208
|
1,452 sq. feet
|
1 baths 6 beds |
$176,500
|
show details |

|
#8
Grant St
Carnegie, PA 15106
|
1,345 sq. feet
|
2 baths 4 beds |
$225,500
|
show details |

|
#9
Triana St
Pittsburgh, PA 15210
|
1,184 sq. feet
|
1 baths 3 beds |
$151,500
|
show details |

|
#10
Crucible St
Pittsburgh, PA 15220
|
1,980 sq. feet
|
2 baths 4 beds |
show details |
| Photo | Address | Area | Beds / Baths | Price | Details |
|---|---|---|---|---|---|

|
#11
Fairmont Drive
Wexford, PA 15090
|
3,076 sq. feet
|
4 baths 3 beds |
show details | |

|
#12
North Ave Apt 1
Pittsburgh, PA 15221
|
1,759 sq. feet
|
2 baths 2 beds |
show details | |

|
#13
California Ave
Pittsburgh, PA 15202
|
1,976 sq. feet
|
4 baths 4 beds |
show details | |

|
#14
Robinson Blvd
Pittsburgh, PA 15221
|
1,208 sq. feet
|
2 baths 2 beds |
show details | |

|
#15
Grove St
Mc Kees Rocks, PA 15136
|
1,638 sq. feet
|
2 baths 2 beds |
show details | |

|
#16
Hope St
Pittsburgh, PA 15220
|
1,270 sq. feet
|
1 baths 3 beds |
show details | |

|
#17
Evaline St
Pittsburgh, PA 15235
|
1,473 sq. feet
|
3 baths 3 beds |
show details | |

|
#18
Antrim St
Pittsburgh, PA 15212
|
1,580 sq. feet
|
1 baths 2 beds |
show details | |

|
#19
Dickens St
Pittsburgh, PA 15220
|
1,776 sq. feet
|
2 baths 3 beds |
show details | |

|
#20
Betty Jane Ct
Pittsburgh, PA 15235
|
956 sq. feet
|
1 baths 1 beds |
show details |
| Photo | Address | Area | Beds / Baths | Price | Details |
|---|---|---|---|---|---|

|
#21
Woodward Ave
Mc Kees Rocks, PA 15136
|
1,512 sq. feet
|
1 baths 3 beds |
show details | |

|
#22
Robinson Blvd
Pittsburgh, PA 15221
|
1,085 sq. feet
|
1 baths 2 beds |
show details | |

|
#23
Woodbine St
Pittsburgh, PA 15201
|
918 sq. feet
|
1 baths 2 beds |
show details | |

|
#24
Battery Dr S
Mc Donald, PA 15057
|
1,928 sq. feet
|
3 baths 4 beds |
show details | |

|
#25
Copeland St
Mc Kees Rocks, PA 15136
|
2,208 sq. feet
|
2 baths 3 beds |
show details | |

|
#26
Adelphia St
Pittsburgh, PA 15206
|
1,088 sq. feet
|
1 baths 2 beds |
show details | |

|
#27
Potomac Ave
Pittsburgh, PA 15216
|
2,289 sq. feet
|
2 baths 5 beds |
show details | |

|
#28
Dunster St
Pittsburgh, PA 15226
|
1,232 sq. feet
|
1 baths 3 beds |
show details | |

|
#29
Parkway Dr
Harwick, PA 15049
|
1,914 sq. feet
|
2 baths 4 beds |
show details | |

|
#30
Geyer Rd
Pittsburgh, PA 15212
|
1,158 sq. feet
|
2 baths 2 beds |
show details |
| Photo | Address | Area | Beds / Baths | Price | Details |
|---|---|---|---|---|---|

|
#31
Maytide St
Pittsburgh, PA 15227
|
1,132 sq. feet
|
1 baths 4 beds |
show details | |

|
#32
Erwin Pl
Mc Kees Rocks, PA 15136
|
1,026 sq. feet
|
1 baths 3 beds |
show details | |

|
#33
Dinsmore Ave
Pittsburgh, PA 15205
|
2,193 sq. feet
|
2 baths 3 beds |
show details | |

|
#34
Mintwood St
Pittsburgh, PA 15201
|
1,608 sq. feet
|
2 baths 3 beds |
show details | |

|
#35
Plainview Ave
Pittsburgh, PA 15226
|
1,555 sq. feet
|
2 baths 4 beds |
show details | |

|
#36
Kingwood St
Pittsburgh, PA 15234
|
2,102 sq. feet
|
2 baths 4 beds |
show details | |

|
#37
Camarta Dr
Pittsburgh, PA 15227
|
- sq. feet
|
2 baths 4 beds |
show details | |

|
#38
Riverview Ave
Pittsburgh, PA 15214
|
3,754 sq. feet
|
4 baths 7 beds |
show details | |

|
#39
Richmore Dr
Verona, PA 15147
|
1,218 sq. feet
|
3 baths 3 beds |
show details | |

|
#40
Raymond St
Pittsburgh, PA 15218
|
- sq. feet
|
3 baths 4 beds |
show details |
| Photo | Address | Area | Beds / Baths | Price | Details |
|---|---|---|---|---|---|

|
#41
Stokes Way
Pittsburgh, PA 15212
|
966 sq. feet
|
1 baths 2 beds |
show details | |

|
#42
Venture St
Pittsburgh, PA 15214
|
1,923 sq. feet
|
1 baths 3 beds |
show details | |

|
#43
Old Ridge Rd
Coraopolis, PA 15108
|
1,312 sq. feet
|
2 baths 3 beds |
show details | |

|
#44
Camberly Dr
Gibsonia, PA 15044
|
1,200 sq. feet
|
2 baths 2 beds |
show details | |

|
#45
Vernon Dr
Pittsburgh, PA 15228
|
1,620 sq. feet
|
2 baths 3 beds |
show details | |

|
#46
Vineyard Dr
Gibsonia, PA 15044
|
1,356 sq. feet
|
2 baths 3 beds |
show details | |

|
#47
Pearl Rd
Pittsburgh, PA 15235
|
1,393 sq. feet
|
2 baths 4 beds |
show details | |

|
#48
Wayne Ave
Mc Kees Rocks, PA 15136
|
1,440 sq. feet
|
1 baths 3 beds |
show details | |

|
#49
Brownsville Rd
Pittsburgh, PA 15210
|
2,352 sq. feet
|
2 baths 4 beds |
show details | |

|
Check over 1 million property listings on Foreclosure.com!
|
browse all offers | |||


Median year apartment built: 1985
Household type by relationship:
Households: 15,156- Male householders: 3,192 (497 living alone), Female householders: 2,113 (385 living alone)
3,989 spouses (3,968 opposite-sex spouses), 157 unmarried partners, (157 opposite-sex unmarried partners), 5,187 children (5,019 natural, 62 adopted, 104 stepchildren), 156 grandchildren, 0 brothers or sisters, 157 parents, 22 foster children, 56 other relatives, 110 non-relatives
- In group quarters: 12
Size of family households: 1,739 2-persons, 823 3-persons, 1,141 4-persons, 281 5-persons, 101 6-persons, 64 7-or-more-persons.
Size of nonfamily households: 905 1-person, 136 2-persons.
3,728 married couples with children.
147 single-parent households (17 men, 130 women).
85.2% of residents of Franklin Park speak English at home.
1.2% of residents speak Spanish at home (87% speak English very well, 13% speak English not well).
4.3% of residents speak other Indo-European language at home (89% speak English very well, 10% speak English well, 1% speak English not well).
9.5% of residents speak Asian or Pacific Island language at home (78% speak English very well, 15% speak English well, 4% speak English not well, 3% don't speak English at all).
Foreign born population: 1,648 (10.9%)
(48.8% of them are naturalized citizens)
| Here: | 8.1 |
| State: | 6.8 |
| Here: | 5.8 |
| State: | 4.3 |
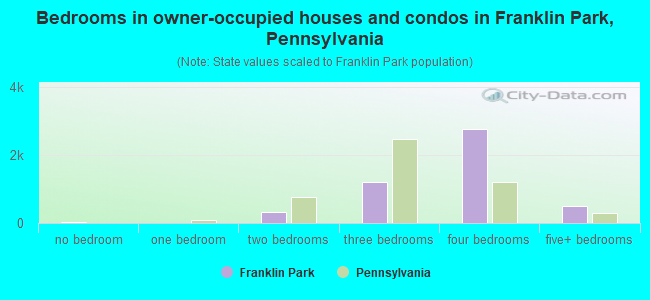
- Bedrooms in owner-occupied houses and condos in Franklin Park, Pennsylvania
- 32no bedroom
- 111 bedroom
- 3362 bedrooms
- 1,2063 bedrooms
- 2,7684 bedrooms
- 5125+ bedrooms
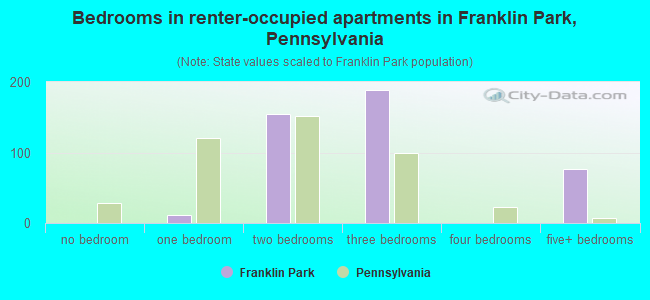
- Bedrooms in renter-occupied apartments in Franklin Park, Pennsylvania
- 0no bedroom
- 111 bedroom
- 1542 bedrooms
- 1883 bedrooms
- 04 bedrooms
- 765+ bedrooms
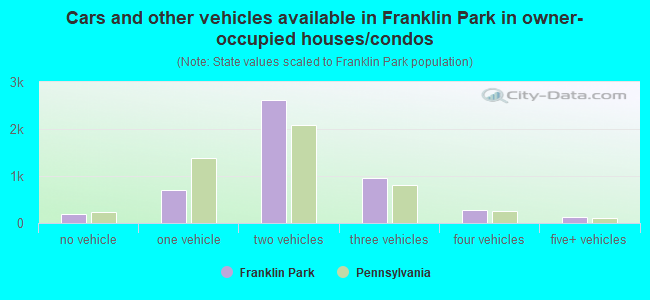
- Cars and other vehicles available in Franklin Park in owner-occupied houses/condos
- 191no vehicle
- 6981 vehicle
- 2,6272 vehicles
- 9533 vehicles
- 2764 vehicles
- 1205+ vehicles
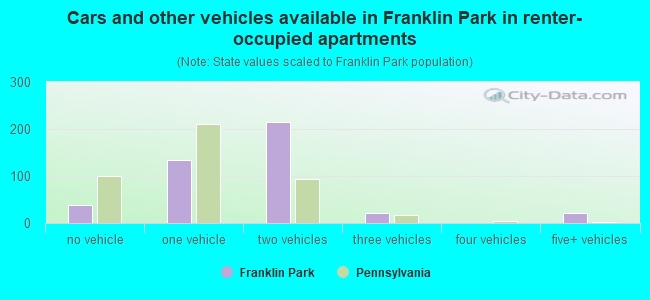
- Cars and other vehicles available in Franklin Park in renter-occupied apartments
- 38no vehicle
- 1331 vehicle
- 2152 vehicles
- 213 vehicles
- 04 vehicles
- 225+ vehicles
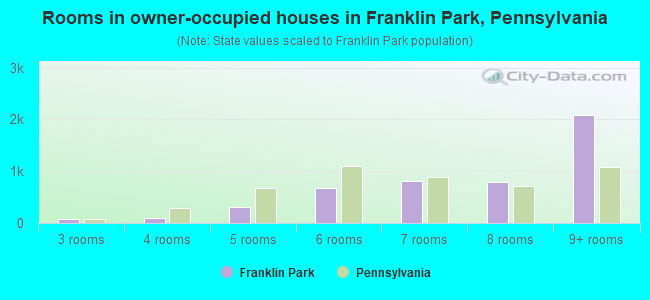
- Rooms in owner-occupied houses in Franklin Park, Pennsylvania
- 51 room
- 102 rooms
- 743 rooms
- 944 rooms
- 3115 rooms
- 6836 rooms
- 8127 rooms
- 7908 rooms
- 2,0859+ rooms
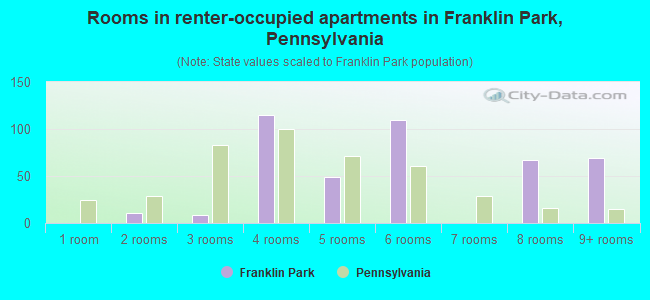
- Rooms in renter-occupied apartments in Franklin Park, Pennsylvania
- 01 room
- 112 rooms
- 83 rooms
- 1154 rooms
- 495 rooms
- 1106 rooms
- 07 rooms
- 678 rooms
- 699+ rooms
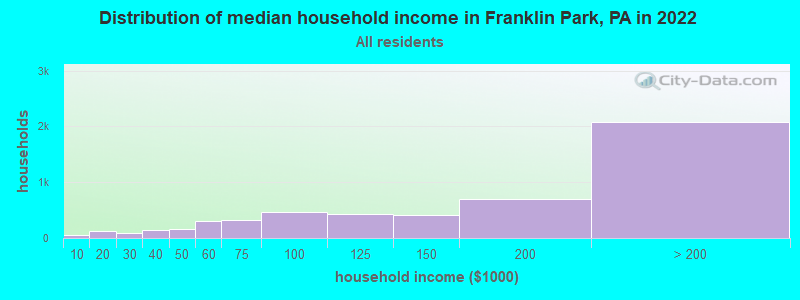
Franklin Park, PA household income distribution

- 62Less than $10,000
- 123$10,000 to $19,999
- 84$20,000 to $29,999
- 136$30,000 to $39,999
- 158$40,000 to $49,999
- 313$50,000 to $59,999
- 326$60,000 to $74,999
- 462$75,000 to $99,999
- 429$100,000 to $124,999
- 418$125,000 to $149,999
- 703$150,000 to $199,999
- 2,078$200,000 or more
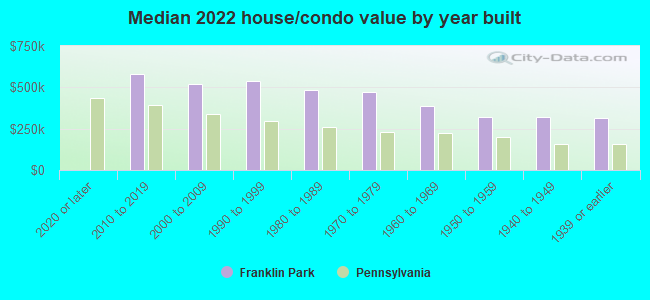
Home value of owner - occupied houses in 2022 in Franklin Park, PA
-
- 74Less than $10,000
- 17$20,000 to $24,999
- 17$30,000 to $34,999
- 8$70,000 to $79,999
- 14$80,000 to $89,999
- 2$90,000 to $99,999
- 10$100,000 to $124,999
- 66$150,000 to $174,999
- 108$175,000 to $199,999
- 250$200,000 to $249,999
- 731$250,000 to $299,999
- 850$300,000 to $399,999
- 1,496$400,000 to $499,999
- 1,482$500,000 to $749,999
- 352$750,000 to $999,999
- 81$1,000,000 to $1,499,999
- 11$1,500,000 to $1,999,999
- 11$2,000,000 or more
Rent paid by renters in 2022 in Franklin Park, PA
-
- 7$550 to $599
- 25$750 to $799
- 8$800 to $899
- 45$1,250 to $1,499
- 113$1,500 to $1,999
- 79$2,000 to $2,499
- 16$2,500 to $2,999
- 84$3,500 or more
- 77No cash rent
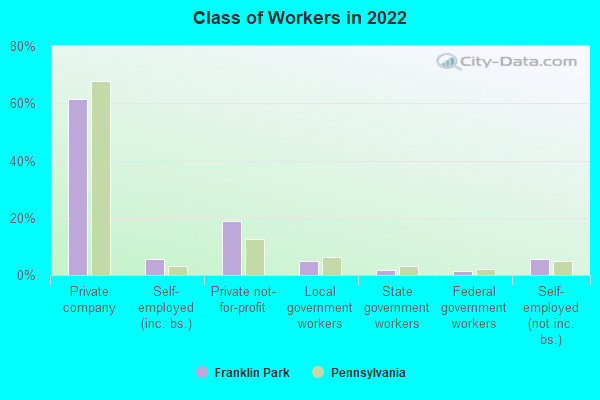
Percentage of workers working in this county: 89.5%
Number of people working at home: 1,996 (25.1% of all workers)
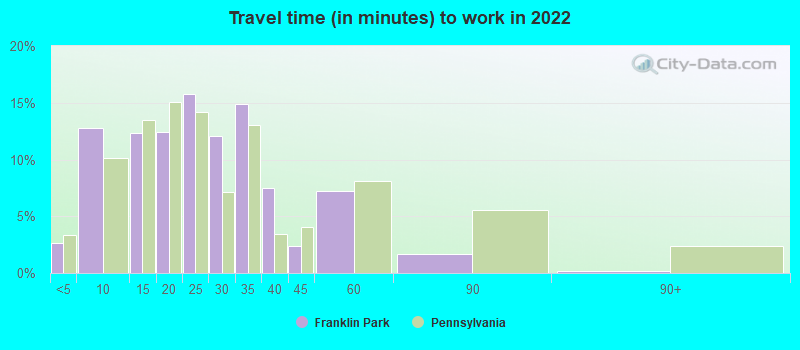
Travel time to work (commute)
- Less than 5 minutes: 213
- 5 to 9 minutes: 218
- 10 to 14 minutes: 406
- 15 to 19 minutes: 973
- 20 to 24 minutes: 921
- 25 to 29 minutes: 771
- 30 to 34 minutes: 1,261
- 35 to 39 minutes: 387
- 40 to 44 minutes: 261
- 45 to 59 minutes: 456
- 60 to 89 minutes: 81
- 90 or more minutes: 96
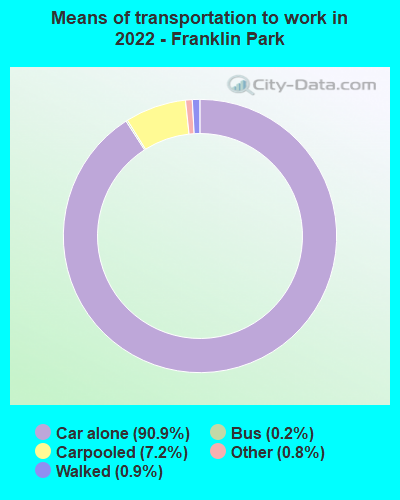
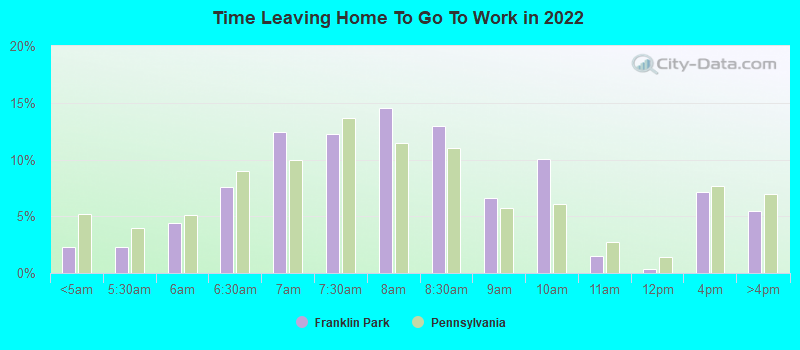
Means of transportation to work:
- Drove a car alone: 2,287 (55.4%)
- Carpooled: 174 (4.2%)
- Bus: 3 (0.1%)
- Taxi: 24 (0.6%)
- Walked: 22 (0.5%)
- Worked at home: 1,996 (48.3%)
- Unemployment by race in 2022
- Unemployment rate for White non-Hispanic residents
- 4.8%Males
- 3.7%Females
- Unemployment rate for Asian residents
- 0.6%Females
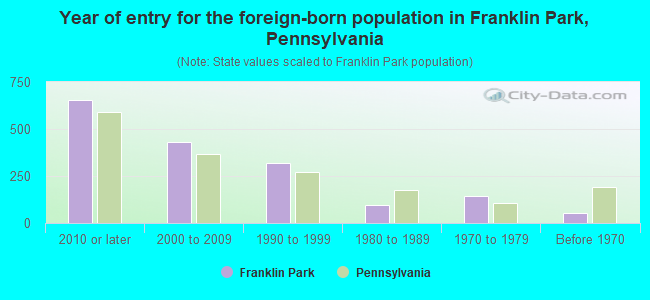
- Year of entry for the foreign-born population in Franklin Park, Pennsylvania
- 6542010 or later
- 4292000 to 2009
- 3211990 to 1999
- 961980 to 1989
- 1451970 to 1979
- 54Before 1970
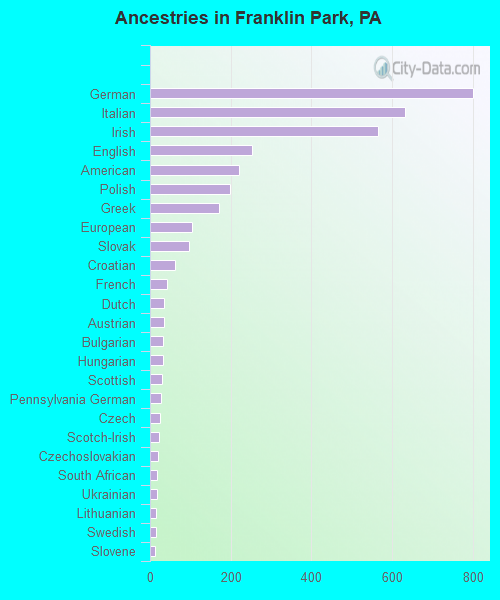
First ancestries reported:
- German: 800 (14.0%)
- Italian: 632 (11.0%)
- Irish: 566 (9.9%)
- English: 252 (4.4%)
- American: 221 (3.9%)
- Polish: 197 (3.4%)
- Greek: 172 (3.0%)
- European: 103 (1.8%)
- Slovak: 96 (1.7%)
- Croatian: 62 (1.1%)
- French: 41 (0.7%)
- Dutch: 35 (0.6%)
- Austrian: 34 (0.6%)
- Bulgarian: 33 (0.6%)
- Hungarian: 31 (0.5%)
- Scottish: 29 (0.5%)
- Pennsylvania German: 27 (0.5%)
- Czech: 24 (0.4%)
- Scotch-Irish: 22 (0.4%)
- Czechoslovakian: 20 (0.3%)
- South African: 17 (0.3%)
- Ukrainian: 17 (0.3%)
- Lithuanian: 16 (0.3%)
- Swedish: 15 (0.3%)
- Slovene: 13 (0.2%)
- Welsh: 13 (0.2%)
- Belgian: 10 (0.2%)
- British: 7 (0.1%)
- Eastern European: 7 (0.1%)
- Russian: 7 (0.1%)
- Portuguese: 1 (0.02%)
Most common places of birth for foreign-born residents (%):
| Franklin Park: | 41.7% (771) |
| Pennsylvania: | 10.7% (100,596) |
| Franklin Park: | 25.1% (464) |
| Pennsylvania: | 7.2% (67,704) |
| Franklin Park: | 6.6% (122) |
| Pennsylvania: | 1.8% (17,032) |
| Franklin Park: | 2.8% (51) |
| Pennsylvania: | 0.5% (4,648) |
| Franklin Park: | 2.2% (41) |
| Pennsylvania: | 0.4% (4,068) |
| Franklin Park: | 2.1% (38) |
| Pennsylvania: | 2.9% (27,433) |
| Franklin Park: | 2.0% (37) |
| Pennsylvania: | 1.2% (11,211) |
Place of birth for U.S.-born residents:
- This state: 9,595
- Other state: 3,754
- Northeast: 816
- Midwest: 1,213
- South: 1,390
- West: 355
92.6% of Franklin Park residents lived in the same house 1 years ago.
Out of people who lived in different houses, 37.5% lived in this county.
Out of people who lived in different counties, 5.1% lived in Pennsylvania.
| Franklin Park: | 92.6% |
| State average: | 89.3% |
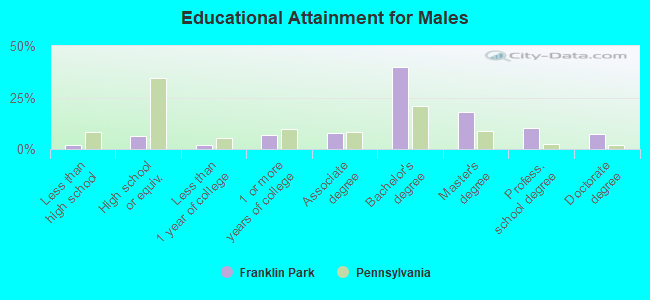
Education attainment for males 25 years and older:
- No schooling: 33
- Nursery to 4th grade: 0
- 5th and 6th grade: 0
- 7th and 8th grade: 18
- 9th grade: 0
- 10th grade: 31
- 11th grade: 10
- 12th grade, no diploma: 8
- High school graduate (or equivalency): 342
- Less than 1 year of college: 106
- Some college more than 1 year, no degree: 344
- Associate degree: 399
- Bachelor's degree: 2,084
- Master's degree: 947
- Professional school degree: 535
- Doctorate degree: 375
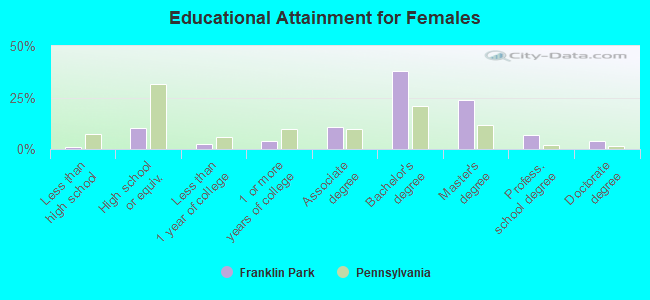
Education attainment for females 25 years and older:
- No schooling: 24
- Nursery to 4th grade: 0
- 5th and 6th grade: 0
- 7th and 8th grade: 0
- 9th grade: 0
- 10th grade: 0
- 11th grade: 0
- 12th grade, no diploma: 27
- High school graduate (or equivalency): 524
- Less than 1 year of college: 117
- Some college more than 1 year, no degree: 206
- Associate degree: 546
- Bachelor's degree: 1,974
- Master's degree: 1,245
- Professional school degree: 362
- Doctorate degree: 201


Housing units in structures:
- One, detached: 4,684
- One, attached: 701
- 3 or 4: 128
- 5 to 9: 44
- 10 to 19: 25
- 20 to 49: 31
- 50 or more: 11
- Mobile homes: 72
Housing units lacking complete kitchen facilities in 2022: 1.8%
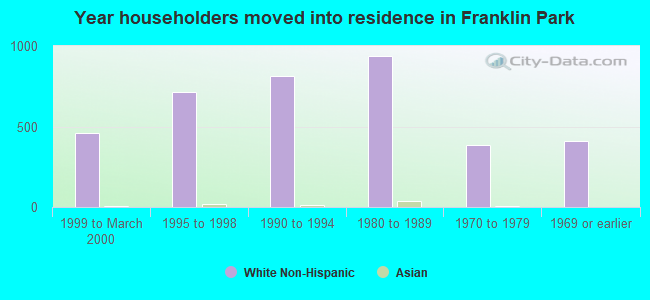
House/condo owner moved in on average 11 years ago
Renter moved in on average 6 years ago
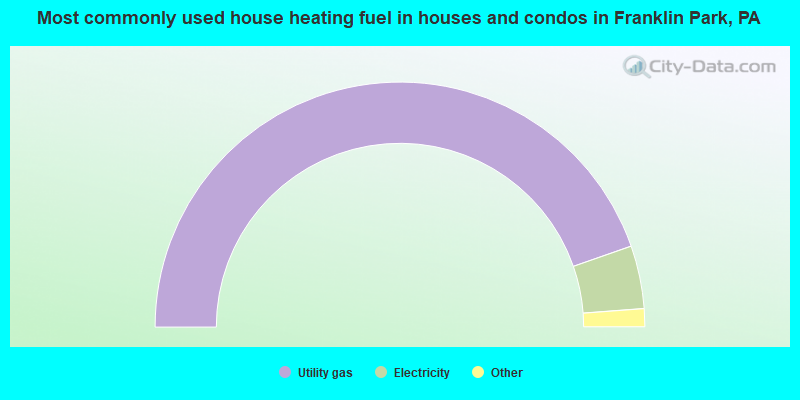
- 89.4%Utility gas
- 8.3%Electricity
- 0.8%No fuel used
- 0.6%Bottled, tank, or LP gas
- 0.4%Wood
- 0.3%Other fuel
- 0.2%Fuel oil, kerosene, etc.
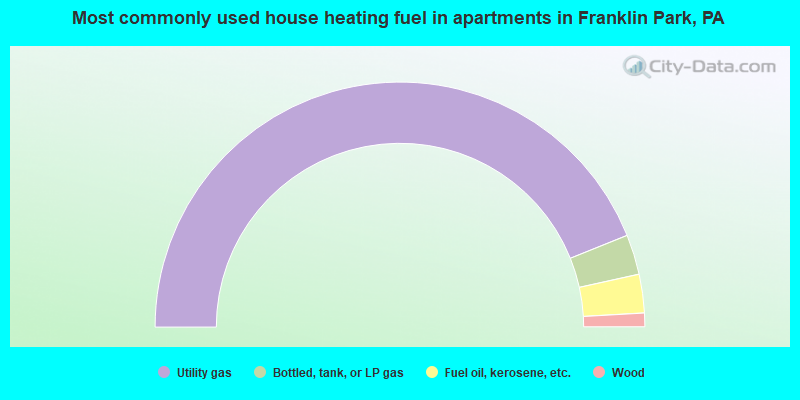
- 87.8%Utility gas
- 5.3%Bottled, tank, or LP gas
- 5.1%Fuel oil, kerosene, etc.
- 1.8%Wood
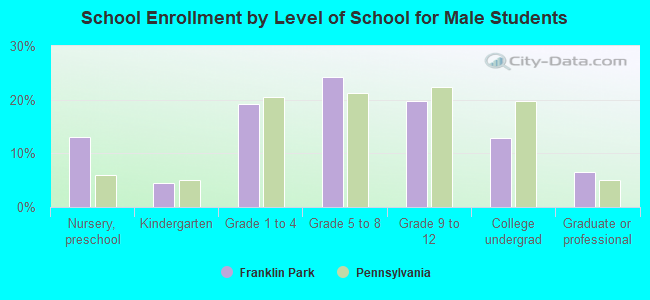
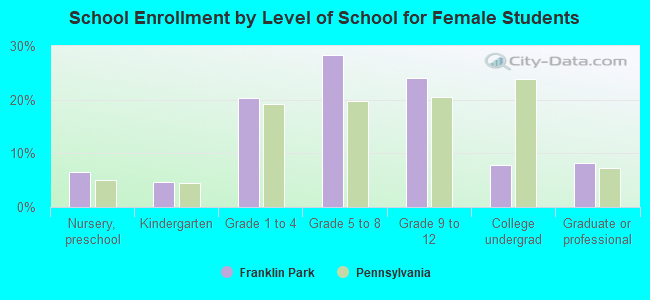
Private vs. public school enrollment:
| Here: | 6.8% |
| Pennsylvania: | 15.7% |
| Here: | 27.4% |
| Pennsylvania: | 13.4% |
| Here: | 35.4% |
| Pennsylvania: | 39.8% |