Fishersville, VA (Virginia) Houses and Residents
| Fishersville: | $330,263 |
| Virginia: | $365,700 |
Mean price in 2022:
Detached houses: $468,375
Here: $468,375 State: $472,865 Townhouses or other attached units: $567,928
Here: $567,928 State: $457,437 Mobile homes: $87,255
Here: $87,255 State: $100,736
Total population: 7,462 (Urban population: 1,383 (all inside urban clusters), Rural population: 3,597 (23 farm, 3,574 nonfarm))
Houses: 4,199 (3,884 occupied: 2,570 owner occupied, 1,435 renter occupied)
| % of renters here: | 36% |
| State: | 33% |
Housing density: 320 houses/condos per square mile
Median price asked for vacant for-sale houses and condos in 2022 in this county: $551,206.
Median contract rent in 2022: $1,182 (lower quartile is $660, upper quartile is $1,819)
Median rent asked for vacant for-rent units in 2022: $851
Median gross rent in Fishersville, VA in 2022: $1,306
Housing units in Fishersville with a mortgage: 1,577 (287 second mortgage, 23 home equity loan, 252 both second mortgage and home equity loan)
Houses without a mortgage: 52
Median household income for houses/condos with a mortgage: $110,197
Median household income for apartments without a mortgage: $89,163
Median monthly housing costs: $1,281
Compare current foreclosures near Fishersville, VA:
| Photo | Address | Area | Beds / Baths | Price | Details |
|---|---|---|---|---|---|

|
#1
Jericho Rd
Fishersville, VA 22939
|
1,388 sq. feet
|
1 baths 4 beds |
show details | |

|
#2
Windsor Dr
Fishersville, VA 22939
|
3,573 sq. feet
|
2 baths 4 beds |
show details | |

|
#3
Mallory Cir
Fishersville, VA 22939
|
1,510 sq. feet
|
2 baths 3 beds |
show details | |

|
#4
Dirby Way
Fishersville, VA 22939
|
2,526 sq. feet
|
2 baths 4 beds |
show details | |

|
#5
Pinnacle Dr # 107
Fishersville, VA 22939
|
- sq. feet
|
- baths - beds |
show details | |

|
#6
Hermitage Rd
Staunton, VA 24401
|
1,680 sq. feet
|
2 baths 3 beds |
show details | |

|
#7
Rutherford Ln
Stuarts Draft, VA 24477
|
2,527 sq. feet
|
3 baths 4 beds |
show details | |

|
#8
Weyers Cave Rd
Weyers Cave, VA 24486
|
1,244 sq. feet
|
2 baths 3 beds |
show details | |

|
#9
Azalea Dr
Afton, VA 22920
|
1,143 sq. feet
|
2 baths 3 beds |
show details | |

|
#10
Dick Woods Rd
Afton, VA 22920
|
1,456 sq. feet
|
2 baths 2 beds |
show details |
| Photo | Address | Area | Beds / Baths | Price | Details |
|---|---|---|---|---|---|

|
#11
My Ln
Stuarts Draft, VA 24477
|
864 sq. feet
|
1 baths 2 beds |
show details | |

|
#12
Kingston Ct
Stuarts Draft, VA 24477
|
1,101 sq. feet
|
2 baths 3 beds |
show details | |

|
#13
Friendship Ln
Stuarts Draft, VA 24477
|
1,330 sq. feet
|
1 baths 3 beds |
show details | |

|
#14
3rd St
Waynesboro, VA 22980
|
2,016 sq. feet
|
2 baths 3 beds |
show details | |

|
#15
Greenway Rd
Stuarts Draft, VA 24477
|
1,346 sq. feet
|
1 baths 3 beds |
show details | |

|
#16
White Hill Rd
Stuarts Draft, VA 24477
|
2,018 sq. feet
|
1 baths 3 beds |
show details | |

|
#17
Cedarcrest Dr
Waynesboro, VA 22980
|
1,342 sq. feet
|
2 baths 3 beds |
show details | |

|
#18
Mountain View Dr
Verona, VA 24482
|
1,701 sq. feet
|
2 baths 3 beds |
show details | |

|
#19
E Side Hwy
Waynesboro, VA 22980
|
1,408 sq. feet
|
2 baths 3 beds |
show details | |

|
#20
5th St
Waynesboro, VA 22980
|
1,596 sq. feet
|
2 baths 3 beds |
show details |
| Photo | Address | Area | Beds / Baths | Price | Details |
|---|---|---|---|---|---|

|
#21
Thorofare Rd
Crimora, VA 24431
|
3,392 sq. feet
|
3 baths 4 beds |
show details | |

|
#22
Thorofare Rd
Crimora, VA 24431
|
2,681 sq. feet
|
2 baths 3 beds |
show details | |

|
#23
Breezewood Dr
Staunton, VA 24401
|
1,248 sq. feet
|
1 baths 2 beds |
show details | |

|
#24
Craig Shop Rd
Mount Sidney, VA 24467
|
1,336 sq. feet
|
1 baths 2 beds |
show details | |

|
#25
Durrette Rd
Afton, VA 22920
|
1,344 sq. feet
|
2 baths 3 beds |
show details | |

|
#26
Church St
Greenville, VA 24440
|
1,552 sq. feet
|
1 baths 3 beds |
show details | |

|
#27
Harriston Rd
Grottoes, VA 24441
|
960 sq. feet
|
1 baths 3 beds |
show details | |

|
#28
Middlebrook Village Rd
Middlebrook, VA 24459
|
1,698 sq. feet
|
2 baths 3 beds |
show details | |

|
#29
Deleeuw Ln
Churchville, VA 24421
|
1,792 sq. feet
|
2 baths 3 beds |
show details | |

|
#30
Port Republic Rd
Port Republic, VA 24471
|
1,291 sq. feet
|
1 baths 3 beds |
show details |
| Photo | Address | Area | Beds / Baths | Price | Details |
|---|---|---|---|---|---|

|
#31
Sugar Ridge Rd
Crozet, VA 22932
|
1,120 sq. feet
|
1 baths 3 beds |
show details | |

|
#32
Hankey Mountain Hwy
Churchville, VA 24421
|
846 sq. feet
|
1 baths 2 beds |
show details | |

|
#33
Heizers Tanyard Rd
Churchville, VA 24421
|
1,050 sq. feet
|
1 baths 3 beds |
show details | |

|
#34
Terrace Run
Grottoes, VA 24441
|
1,392 sq. feet
|
2 baths 3 beds |
show details | |

|
#35
Patterson Mill Ln
Crozet, VA 22932
|
3,168 sq. feet
|
3 baths 4 beds |
show details | |

|
#36
17th St
Grottoes, VA 24441
|
1,000 sq. feet
|
1 baths 3 beds |
show details | |

|
#37
Ridgetop Dr
Weyers Cave, VA 24486
|
2,088 sq. feet
|
2 baths 3 beds |
show details | |

|
#38
Chinquapin Walk
Greenville, VA 24440
|
1,258 sq. feet
|
1 baths 3 beds |
show details | |

|
#39
Cold Springs Rd
Greenville, VA 24440
|
960 sq. feet
|
2 baths 2 beds |
show details | |

|
#40
Vinegar Hill Rd
Churchville, VA 24421
|
1,870 sq. feet
|
2 baths 3 beds |
show details |
| Photo | Address | Area | Beds / Baths | Price | Details |
|---|---|---|---|---|---|

|
#41
Falcon Ln
Weyers Cave, VA 24486
|
1,353 sq. feet
|
2 baths 3 beds |
show details | |

|
#42
Hangers Mill Rd
Churchville, VA 24421
|
1,865 sq. feet
|
2 baths 2 beds |
show details | |

|
#43
Wyer St
Weyers Cave, VA 24486
|
1,964 sq. feet
|
2 baths 3 beds |
show details | |

|
#44
Corville Farm Rd
Crozet, VA 22932
|
960 sq. feet
|
1 baths 3 beds |
show details | |

|
#45
Pughs Store Rd
Afton, VA 22920
|
960 sq. feet
|
2 baths 2 beds |
show details | |

|
#46
White Hill Rd
Stuarts Draft, VA 24477
|
2,005 sq. feet
|
2 baths 3 beds |
show details | |

|
#47
D St
Waynesboro, VA 22980
|
993 sq. feet
|
1 baths 3 beds |
show details | |

|
#48
Highlands Dr
Charlottesville, VA 22901
|
1,118 sq. feet
|
2 baths 3 beds |
show details | |

|
#49
Barterbrook Rd
Staunton, VA 24401
|
2,025 sq. feet
|
1 baths 3 beds |
show details | |

|
Check over 1 million property listings on Foreclosure.com!
|
browse all offers | |||

Latest news about housing in Fishersville, VA collected exclusively by city-data.com from local newspapers, TV, and radio stations

 | A house to rent in Staunton (0 replies) |
| Lynchburg versus Martinsburg WV (7 replies) |
| What kind of people live in or are moving to Staunton? (45 replies) |
| relocating to stuarts draft va need advice for housing (2 replies) |
| Where to live? What about those great school scores? (18 replies) |
| Young Guy, Chicago-Charlottesville, VA (2 replies) |

Median year apartment built: 2013
Household type by relationship:
Households: 9,498- Male householders: 1,756 (337 living alone), Female householders: 2,106 (692 living alone)
2,016 spouses (1,934 opposite-sex spouses), 227 unmarried partners, (227 opposite-sex unmarried partners), 2,334 children (2,043 natural, 158 adopted, 133 stepchildren), 76 grandchildren, 103 brothers or sisters, 70 parents, 0 foster children, 35 other relatives, 293 non-relatives
- In group quarters: 477
Size of family households: 1,483 2-persons, 424 3-persons, 354 4-persons, 130 5-persons, 290 6-persons, 35 7-or-more-persons.
Size of nonfamily households: 1,073 1-person, 270 2-persons.
1,320 married couples with children.
226 single-parent households (36 men, 190 women).
92.9% of residents of Fishersville speak English at home.
4.4% of residents speak Spanish at home (99% speak English very well, 1% speak English well).
2.0% of residents speak other Indo-European language at home (61% speak English very well, 39% speak English not well).
0.9% of residents speak other language at home (80% speak English very well, 20% speak English well).
Foreign born population: 387 (4.1%)
(41.6% of them are naturalized citizens)
| Here: | 7.0 |
| State: | 7.0 |
| Here: | 3.7 |
| State: | 4.3 |

- Bedrooms in owner-occupied houses and condos in Fishersville, Virginia
- 13no bedroom
- 01 bedroom
- 1292 bedrooms
- 1,5993 bedrooms
- 6614 bedrooms
- 1695+ bedrooms

- Bedrooms in renter-occupied apartments in Fishersville, Virginia
- 270no bedroom
- 2581 bedroom
- 4432 bedrooms
- 4053 bedrooms
- 334 bedrooms
- 265+ bedrooms

- Cars and other vehicles available in Fishersville in owner-occupied houses/condos
- 71no vehicle
- 5411 vehicle
- 1,1402 vehicles
- 5103 vehicles
- 2554 vehicles
- 535+ vehicles

- Cars and other vehicles available in Fishersville in renter-occupied apartments
- 496no vehicle
- 4061 vehicle
- 4442 vehicles
- 563 vehicles
- 84 vehicles
- 255+ vehicles

- Rooms in owner-occupied houses in Fishersville, Virginia
- 131 room
- 02 rooms
- 03 rooms
- 944 rooms
- 4545 rooms
- 4766 rooms
- 6357 rooms
- 4358 rooms
- 4649+ rooms

- Rooms in renter-occupied apartments in Fishersville, Virginia
- 2701 room
- 122 rooms
- 2813 rooms
- 4884 rooms
- 2335 rooms
- 656 rooms
- 307 rooms
- 168 rooms
- 419+ rooms


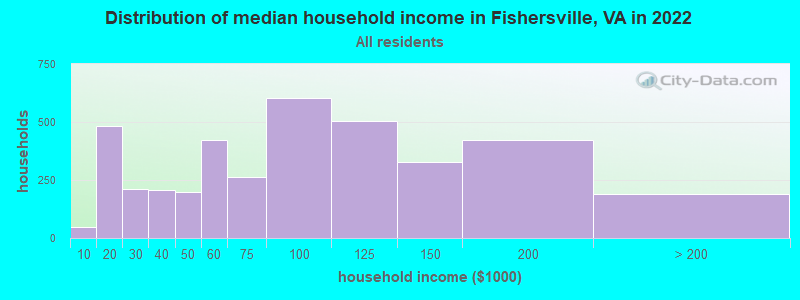
Fishersville, VA household income distribution

- 46Less than $10,000
- 482$10,000 to $19,999
- 212$20,000 to $29,999
- 205$30,000 to $39,999
- 197$40,000 to $49,999
- 422$50,000 to $59,999
- 263$60,000 to $74,999
- 604$75,000 to $99,999
- 506$100,000 to $124,999
- 329$125,000 to $149,999
- 421$150,000 to $199,999
- 188$200,000 or more
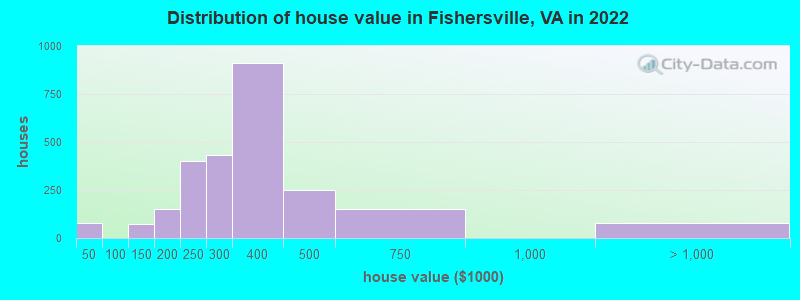
Home value of owner - occupied houses in 2022 in Fishersville, VA
-
- 54$15,000 to $19,999
- 24$35,000 to $39,999
- 40$100,000 to $124,999
- 30$125,000 to $149,999
- 85$150,000 to $174,999
- 67$175,000 to $199,999
- 398$200,000 to $249,999
- 430$250,000 to $299,999
- 909$300,000 to $399,999
- 251$400,000 to $499,999
- 153$500,000 to $749,999
- 77$2,000,000 or more
Rent paid by renters in 2022 in Fishersville, VA
-
- 13Less than $100
- 36$100 to $149
- 109$150 to $199
- 122$200 to $249
- 9$450 to $499
- 7$550 to $599
- 19$650 to $699
- 39$700 to $749
- 161$750 to $799
- 44$800 to $899
- 54$900 to $999
- 108$1,000 to $1,249
- 234$1,250 to $1,499
- 176$1,500 to $1,999
- 112$2,000 to $2,499
- 20$2,500 to $2,999
- 91$3,000 to $3,499
- 11$3,500 or more
- 34No cash rent


Percentage of workers working in this county: 48.7%
Number of people working at home: 344 (8.7% of all workers)
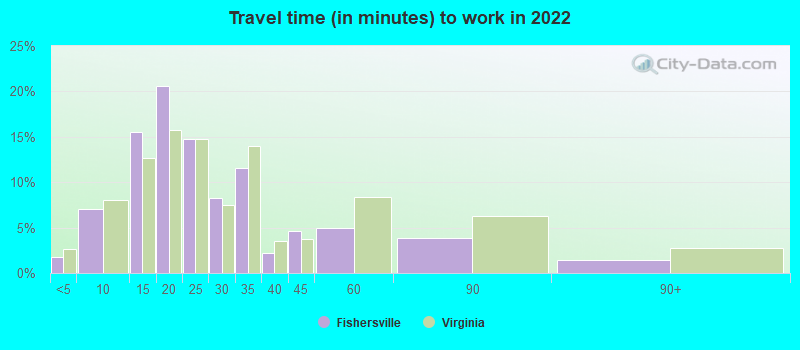
Travel time to work (commute)
- Less than 5 minutes: 127
- 5 to 9 minutes: 362
- 10 to 14 minutes: 972
- 15 to 19 minutes: 479
- 20 to 24 minutes: 413
- 25 to 29 minutes: 271
- 30 to 34 minutes: 218
- 35 to 39 minutes: 191
- 40 to 44 minutes: 175
- 45 to 59 minutes: 117
- 60 to 89 minutes: 92
- 90 or more minutes: 132
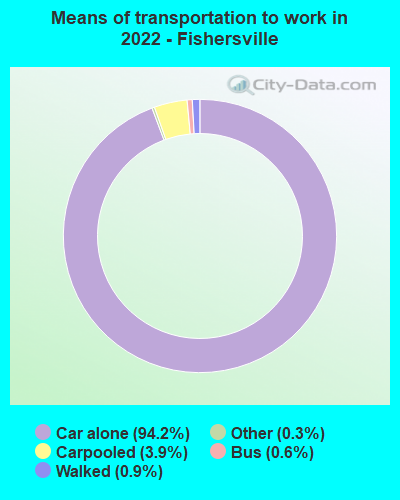
Means of transportation to work:
- Drove a car alone: 6,449 (86.6%)
- Carpooled: 273 (3.7%)
- Bus: 31 (0.4%)
- Taxi: 21 (0.3%)
- Walked: 68 (0.9%)
- Worked at home: 344 (4.6%)

- Unemployment by race in 2022
- Unemployment rate for White non-Hispanic residents
- 1.8%Males
- 4.4%Females
- Unemployment rate for Black residents
- 15.9%Males
- 22.2%Females
- Unemployment rate for other race residents
- 100.0%Males
- Unemployment rate for Hispanic or Latino residents
- 100.0%Males

- Year of entry for the foreign-born population in Fishersville, Virginia
- 2392010 or later
- 822000 to 2009
- 271990 to 1999
- 51980 to 1989
- 01970 to 1979
- 18Before 1970

First ancestries reported:
- English: 859 (20.7%)
- German: 600 (14.5%)
- American: 535 (12.9%)
- Irish: 363 (8.8%)
- Polish: 161 (3.9%)
- Scotch-Irish: 155 (3.7%)
- African: 154 (3.7%)
- European: 129 (3.1%)
- Italian: 62 (1.5%)
- Scottish: 57 (1.4%)
- French Canadian: 48 (1.2%)
- Latvian: 38 (0.9%)
- French: 34 (0.8%)
- Scandinavian: 31 (0.7%)
- Jamaican: 23 (0.6%)
- British: 22 (0.5%)
- Greek: 6 (0.1%)
- Northern European: 5 (0.1%)
Most common places of birth for foreign-born residents (%):
| Fishersville: | 45.3% (159) |
| Virginia: | 0.2% (1,786) |
| Fishersville: | 12.0% (42) |
| Virginia: | 1.0% (10,734) |
| Fishersville: | 10.3% (36) |
| Virginia: | 0.3% (2,829) |
| Fishersville: | 10.0% (35) |
| Virginia: | 2.4% (26,366) |
| Fishersville: | 8.8% (31) |
| Virginia: | 0.0% (475) |
| Fishersville: | 8.3% (29) |
| Virginia: | 9.0% (97,830) |
| Fishersville: | 6.3% (22) |
| Virginia: | 0.8% (8,513) |
| Fishersville: | 3.4% (12) |
| Virginia: | 2.9% (32,082) |
| Fishersville: | 2.6% (9) |
| Virginia: | 0.1% (1,168) |
| Fishersville: | 1.7% (6) |
| Virginia: | 0.5% (5,058) |
Place of birth for U.S.-born residents:
- This state: 5,689
- Other state: 3,368
- Northeast: 981
- Midwest: 624
- South: 1,323
- West: 437
89.4% of Fishersville residents lived in the same house 1 years ago.
Out of people who lived in different houses, 21.0% lived in this county.
Out of people who lived in different counties, 66.2% lived in Virginia.
| Fishersville: | 89.4% |
| State average: | 86.6% |
Education attainment for males 25 years and older:
- No schooling: 21
- Nursery to 4th grade: 0
- 5th and 6th grade: 48
- 7th and 8th grade: 10
- 9th grade: 7
- 10th grade: 27
- 11th grade: 11
- 12th grade, no diploma: 31
- High school graduate (or equivalency): 951
- Less than 1 year of college: 189
- Some college more than 1 year, no degree: 457
- Associate degree: 251
- Bachelor's degree: 565
- Master's degree: 416
- Professional school degree: 65
- Doctorate degree: 22

Education attainment for females 25 years and older:
- No schooling: 59
- Nursery to 4th grade: 0
- 5th and 6th grade: 11
- 7th and 8th grade: 59
- 9th grade: 11
- 10th grade: 65
- 11th grade: 38
- 12th grade, no diploma: 4
- High school graduate (or equivalency): 1,017
- Less than 1 year of college: 198
- Some college more than 1 year, no degree: 596
- Associate degree: 521
- Bachelor's degree: 710
- Master's degree: 448
- Professional school degree: 29
- Doctorate degree: 51


Housing units in structures:
- One, detached: 2,657
- One, attached: 292
- 3 or 4: 203
- 5 to 9: 198
- 10 to 19: 234
- 20 to 49: 288
- 50 or more: 100
- Mobile homes: 224
Housing units lacking complete kitchen facilities in 2022: 6.3%
House/condo owner moved in on average 10 years ago
Renter moved in on average 1 years ago

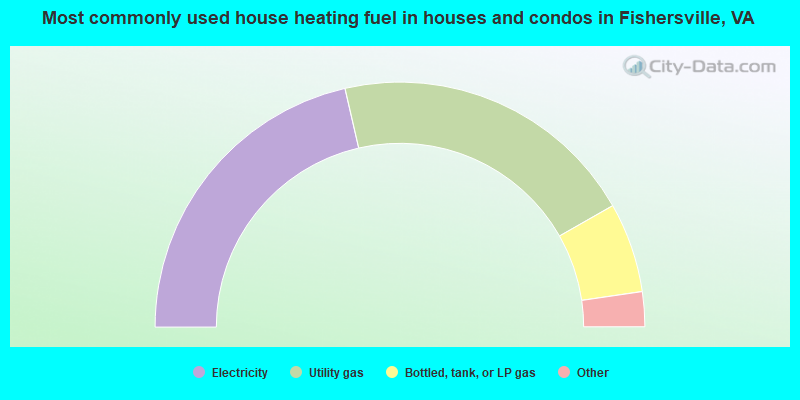
- 42.8%Electricity
- 40.7%Utility gas
- 11.9%Bottled, tank, or LP gas
- 2.6%Wood
- 1.9%Fuel oil, kerosene, etc.
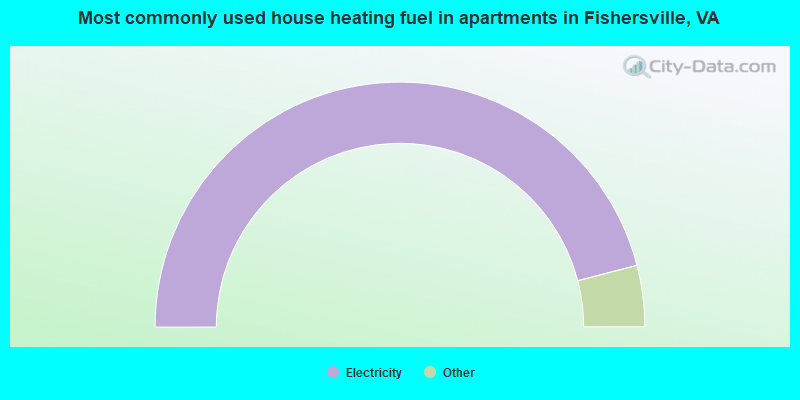
- 92.0%Electricity
- 3.4%Bottled, tank, or LP gas
- 2.9%Utility gas
- 1.7%Wood
Private vs. public school enrollment:
| Here: | 45.0% |
| Virginia: | 13.2% |
| Here: | 5.8% |
| Virginia: | 10.2% |
| Here: | 11.5% |
| Virginia: | 18.7% |


