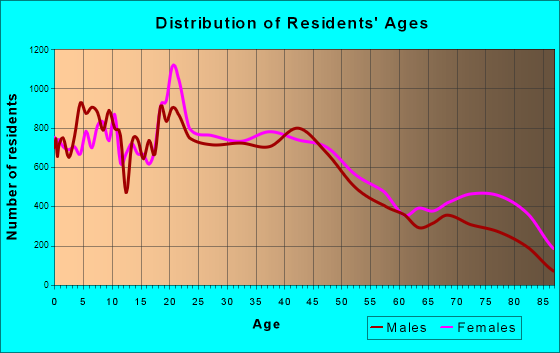
Erie, PA (Pennsylvania) Houses and Residents
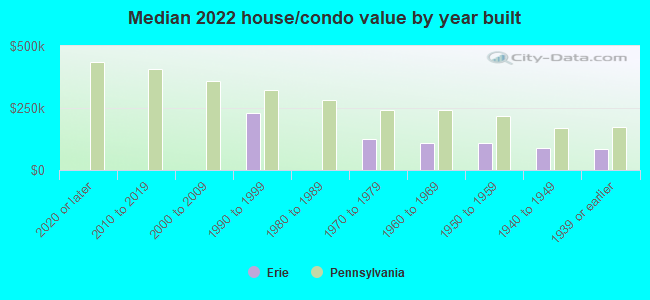
| Erie: | $98,200 |
| Pennsylvania: | $245,500 |
Mean price in 2022:
Detached houses: $159,367
Here: $159,367 State: $317,202 Townhouses or other attached units: $131,003
Here: $131,003 State: $254,369 In 2-unit structures: $98,853
Here: $98,853 State: $249,182 In 3-to-4-unit structures: $135,719
Here: $135,719 State: $297,446 In 5-or-more-unit structures: $56,130
Here: $56,130 State: $320,068 Mobile homes: $55,541
Here: $55,541 State: $92,414
Total population: 99,452 (All urban)
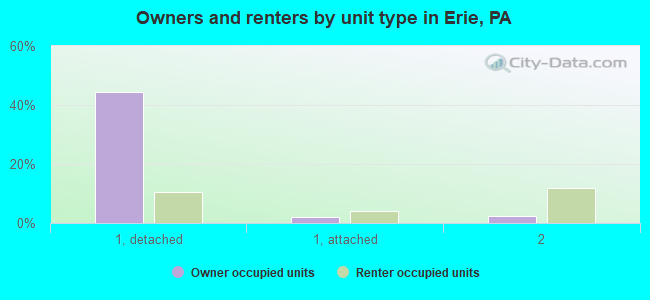
Houses: 44,034 (39,958 occupied: 22,095 owner occupied, 17,863 renter occupied)
| % of renters here: | 45% |
| State: | 31% |
Housing density: 2,005 houses/condos per square mile
Median price asked for vacant for-sale houses and condos in 2022: $66,059.
Median contract rent in 2022: $621 (lower quartile is $486, upper quartile is $839)
Median rent asked for vacant for-rent units in 2022: $732
Median gross rent in Erie, PA in 2022: $781
Housing units in Erie with a mortgage: 11,443 (897 second mortgage, 70 home equity loan, 589 both second mortgage and home equity loan)
Houses without a mortgage: 729
Median household income for houses/condos with a mortgage: $64,743
Median household income for apartments without a mortgage: $48,563
Median monthly housing costs: $775
Compare current foreclosures in Erie, PA:
| Photo | Address | Area | Beds / Baths | Price | Details |
|---|---|---|---|---|---|

|
#1
E 33rd St
Erie, PA 16504
|
912 sq. feet
|
1 baths 2 beds |
$34,900
|
show details |

|
#2
Sierra Dr
Erie, PA 16506
|
1,980 sq. feet
|
1 baths 3 beds |
show details | |

|
#3
Old French Rd
Erie, PA 16509
|
1,788 sq. feet
|
3 baths 5 beds |
show details | |

|
#4
Conrad Rd
Erie, PA 16510
|
1,460 sq. feet
|
1 baths 3 beds |
show details | |

|
#5
E 40th St
Erie, PA 16510
|
1,176 sq. feet
|
1 baths 3 beds |
show details | |

|
#6
W 32nd St
Erie, PA 16508
|
1,280 sq. feet
|
2 baths 3 beds |
show details | |

|
#7
W 37th St
Erie, PA 16508
|
2,304 sq. feet
|
2 baths 3 beds |
show details | |

|
#8
E 19th St
Erie, PA 16503
|
- sq. feet
|
1 baths 4 beds |
show details | |

|
#9
Downing Ave
Erie, PA 16510
|
1,902 sq. feet
|
1 baths 5 beds |
show details | |

|
#10
Polk St
Erie, PA 16503
|
504 sq. feet
|
1 baths 2 beds |
show details |
| Photo | Address | Area | Beds / Baths | Price | Details |
|---|---|---|---|---|---|

|
#11
Brown Ave
Erie, PA 16502
|
792 sq. feet
|
1 baths 2 beds |
show details | |

|
#12
East Ave
Erie, PA 16504
|
1,261 sq. feet
|
1 baths 2 beds |
show details | |

|
#13
E Lake Rd
Erie, PA 16511
|
1,574 sq. feet
|
1 baths 2 beds |
show details | |

|
#14
Glenwood Park Ave
Erie, PA 16508
|
1,162 sq. feet
|
1 baths 3 beds |
show details | |

|
#15
Fair Ave
Erie, PA 16511
|
1,704 sq. feet
|
2 baths 4 beds |
show details | |

|
#16
Cascade St
Erie, PA 16502
|
1,452 sq. feet
|
2 baths 3 beds |
show details | |

|
#17
Longview Ave
Erie, PA 16510
|
960 sq. feet
|
1 baths 3 beds |
show details | |

|
#18
Lake Pleasant Rd
Erie, PA 16504
|
1,370 sq. feet
|
1 baths 3 beds |
show details | |

|
#19
W 23rd St
Erie, PA 16502
|
1,560 sq. feet
|
1 baths 4 beds |
show details | |

|
#20
W 14th St
Erie, PA 16505
|
1,018 sq. feet
|
1 baths 2 beds |
show details |
| Photo | Address | Area | Beds / Baths | Price | Details |
|---|---|---|---|---|---|

|
#21
El Corto Way
Erie, PA 16506
|
1,461 sq. feet
|
2 baths 4 beds |
show details | |

|
#22
Poplar St
Erie, PA 16508
|
1,416 sq. feet
|
1 baths 3 beds |
show details | |

|
#23
Post Ave
Erie, PA 16508
|
1,232 sq. feet
|
1 baths 2 beds |
show details | |

|
#24
Goodrich St
Erie, PA 16508
|
1,664 sq. feet
|
1 baths 5 beds |
show details | |

|
#25
Rankine Ave
Erie, PA 16511
|
896 sq. feet
|
1 baths 2 beds |
show details | |

|
#26
Bement St
Erie, PA 16506
|
1,754 sq. feet
|
2 baths 3 beds |
show details | |

|
#27
Chelsea Ave
Erie, PA 16505
|
1,476 sq. feet
|
1 baths 3 beds |
show details | |

|
#28
W 12th St
Erie, PA 16505
|
1,075 sq. feet
|
1 baths 4 beds |
show details | |

|
#29
E 28th St
Erie, PA 16504
|
1,128 sq. feet
|
1 baths 2 beds |
show details | |

|
#30
German St
Erie, PA 16503
|
3,042 sq. feet
|
4 baths 6 beds |
show details |
| Photo | Address | Area | Beds / Baths | Price | Details |
|---|---|---|---|---|---|

|
#31
Davison Ave
Erie, PA 16504
|
1,280 sq. feet
|
1 baths 3 beds |
show details | |

|
#32
Pine Ave
Erie, PA 16504
|
1,674 sq. feet
|
1 baths 2 beds |
show details | |

|
#33
Amherst Rd
Erie, PA 16506
|
1,391 sq. feet
|
1 baths 3 beds |
show details | |

|
#34
Birch Ct
Erie, PA 16503
|
1,184 sq. feet
|
1 baths 3 beds |
show details | |

|
#35
W 51st St
Erie, PA 16509
|
1,825 sq. feet
|
1 baths 3 beds |
show details | |

|
#36
Candy Ln
Erie, PA 16505
|
1,838 sq. feet
|
1 baths 4 beds |
show details | |

|
#37
Rilling Ave
Erie, PA 16509
|
2,448 sq. feet
|
2 baths 6 beds |
show details | |

|
#38
King Arthur Dr
Erie, PA 16506
|
1,782 sq. feet
|
2 baths 3 beds |
show details | |

|
#39
Tuttle Ave
Erie, PA 16504
|
1,278 sq. feet
|
1 baths 3 beds |
show details | |

|
#40
Avellino Dr
Erie, PA 16510
|
1,472 sq. feet
|
2 baths 3 beds |
show details |
| Photo | Address | Area | Beds / Baths | Price | Details |
|---|---|---|---|---|---|

|
#41
Eliot Rd
Erie, PA 16508
|
1,508 sq. feet
|
1 baths 3 beds |
show details | |

|
#42
German St
Erie, PA 16504
|
2,024 sq. feet
|
2 baths 4 beds |
show details | |

|
#43
Raspberry St
Erie, PA 16508
|
1,440 sq. feet
|
1 baths 5 beds |
show details | |

|
#44
Parade St
Erie, PA 16507
|
1,296 sq. feet
|
1 baths 2 beds |
show details | |

|
#45
Budd Dr
Erie, PA 16506
|
1,115 sq. feet
|
1 baths 3 beds |
show details | |

|
#46
W 18th St
Erie, PA 16502
|
1,232 sq. feet
|
1 baths 3 beds |
show details | |

|
#47
Ash St
Erie, PA 16507
|
1,464 sq. feet
|
2 baths 5 beds |
show details | |

|
#48
W 43rd St
Erie, PA 16509
|
1,184 sq. feet
|
1 baths 3 beds |
show details | |

|
#49
E 32nd St
Erie, PA 16504
|
660 sq. feet
|
1 baths 2 beds |
show details | |

|
Check over 1 million property listings on Foreclosure.com!
|
browse all offers | |||

Latest news about housing in Erie, PA collected exclusively by city-data.com from local newspapers, TV, and radio stations


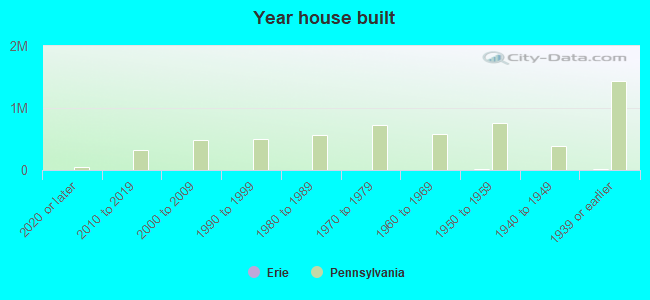
Median year apartment built: 1953
Household type by relationship:
Households: 93,517- Male householders: 18,720 (6,506 living alone), Female householders: 21,238 (8,430 living alone)
11,270 spouses (11,189 opposite-sex spouses), 3,465 unmarried partners, (3,350 opposite-sex unmarried partners), 23,926 children (22,512 natural, 898 adopted, 516 stepchildren), 3,646 grandchildren, 726 brothers or sisters, 494 parents, 0 foster children, 584 other relatives, 3,285 non-relatives
- In group quarters: 6,163
Size of family households: 10,178 2-persons, 4,565 3-persons, 3,244 4-persons, 1,047 5-persons, 776 6-persons, 940 7-or-more-persons.
Size of nonfamily households: 14,936 1-person, 3,835 2-persons, 254 3-persons, 41 4-persons, 58 5-persons, 84 6-persons.
6,603 married couples with children.
8,680 single-parent households (2,255 men, 6,425 women).
88.1% of residents of Erie speak English at home.
5.1% of residents speak Spanish at home (57% speak English very well, 19% speak English well, 20% speak English not well, 5% don't speak English at all).
4.2% of residents speak other Indo-European language at home (51% speak English very well, 23% speak English well, 16% speak English not well, 10% don't speak English at all).
0.6% of residents speak Asian or Pacific Island language at home (53% speak English very well, 16% speak English well, 30% speak English not well, 1% don't speak English at all).
1.9% of residents speak other language at home (58% speak English very well, 24% speak English well, 12% speak English not well, 6% don't speak English at all).
Foreign born population: 6,191 (6.6%)
(43.5% of them are naturalized citizens)
| Here: | 6.4 |
| State: | 6.8 |
| Here: | 4.8 |
| State: | 4.3 |
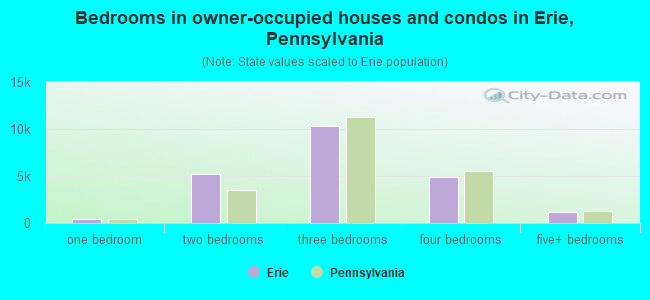
- Bedrooms in owner-occupied houses and condos in Erie, Pennsylvania
- 0no bedroom
- 4671 bedroom
- 5,1892 bedrooms
- 10,3703 bedrooms
- 4,8564 bedrooms
- 1,2135+ bedrooms
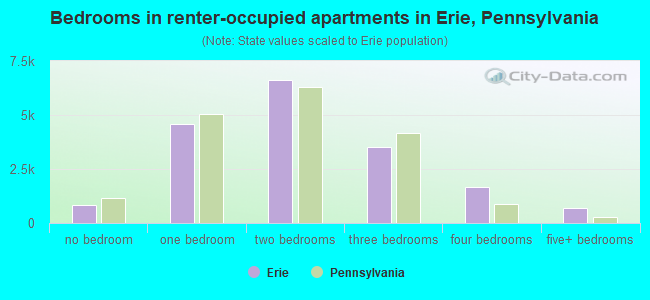
- Bedrooms in renter-occupied apartments in Erie, Pennsylvania
- 814no bedroom
- 4,5711 bedroom
- 6,6062 bedrooms
- 3,5263 bedrooms
- 1,6684 bedrooms
- 6785+ bedrooms
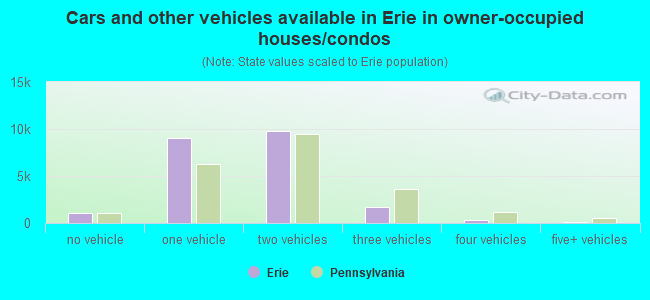
- Cars and other vehicles available in Erie in owner-occupied houses/condos
- 1,114no vehicle
- 9,0321 vehicle
- 9,7912 vehicles
- 1,7003 vehicles
- 3504 vehicles
- 1085+ vehicles
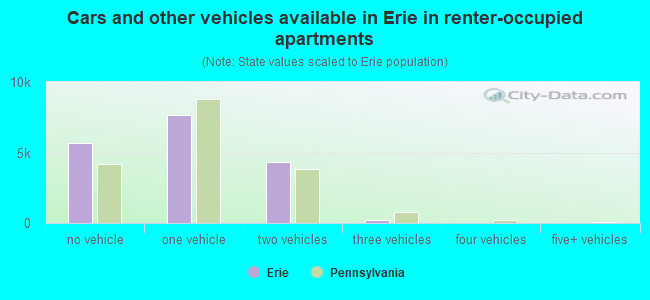
- Cars and other vehicles available in Erie in renter-occupied apartments
- 5,689no vehicle
- 7,6791 vehicle
- 4,3172 vehicles
- 1783 vehicles
- 04 vehicles
- 05+ vehicles
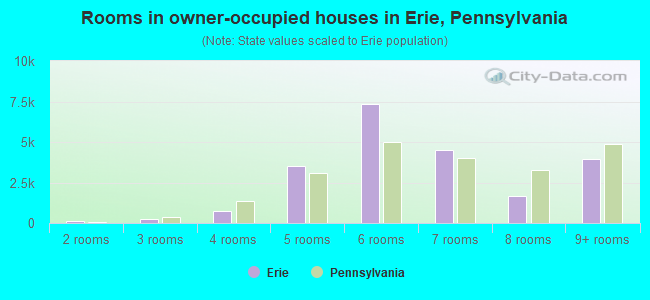
- Rooms in owner-occupied houses in Erie, Pennsylvania
- 01 room
- 1272 rooms
- 2243 rooms
- 7574 rooms
- 3,4915 rooms
- 7,3756 rooms
- 4,5037 rooms
- 1,6498 rooms
- 3,9699+ rooms
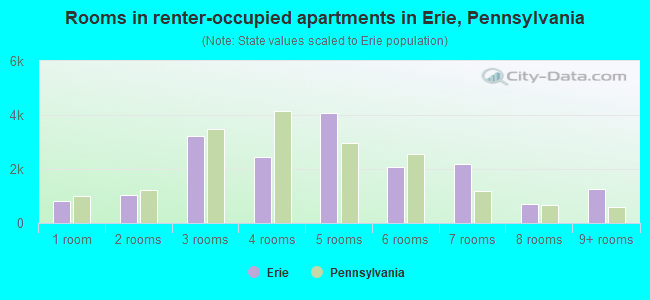
- Rooms in renter-occupied apartments in Erie, Pennsylvania
- 8141 room
- 1,0542 rooms
- 3,2183 rooms
- 2,4584 rooms
- 4,0825 rooms
- 2,0886 rooms
- 2,1957 rooms
- 6918 rooms
- 1,2639+ rooms
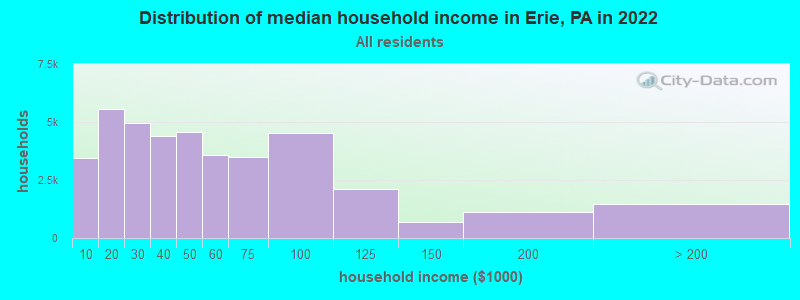
Erie, PA household income distribution

- 3,466Less than $10,000
- 5,573$10,000 to $19,999
- 4,968$20,000 to $29,999
- 4,393$30,000 to $39,999
- 4,589$40,000 to $49,999
- 3,564$50,000 to $59,999
- 3,482$60,000 to $74,999
- 4,520$75,000 to $99,999
- 2,093$100,000 to $124,999
- 706$125,000 to $149,999
- 1,131$150,000 to $199,999
- 1,473$200,000 or more
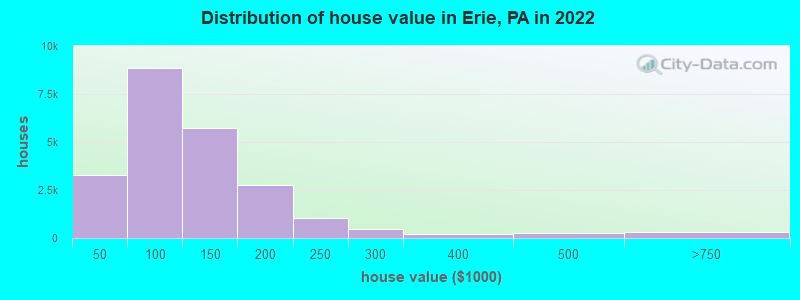
Home value of owner - occupied houses in 2022 in Erie, PA
-
- 289Less than $10,000
- 83$10,000 to $14,999
- 192$15,000 to $19,999
- 578$20,000 to $24,999
- 63$25,000 to $29,999
- 507$30,000 to $34,999
- 787$35,000 to $39,999
- 801$40,000 to $49,999
- 1,071$50,000 to $59,999
- 1,345$60,000 to $69,999
- 1,819$70,000 to $79,999
- 2,068$80,000 to $89,999
- 1,753$90,000 to $99,999
- 3,390$100,000 to $124,999
- 2,340$125,000 to $149,999
- 2,095$150,000 to $174,999
- 647$175,000 to $199,999
- 1,050$200,000 to $249,999
- 447$250,000 to $299,999
- 219$300,000 to $399,999
- 238$400,000 to $499,999
- 218$500,000 to $749,999
- 95$750,000 to $999,999
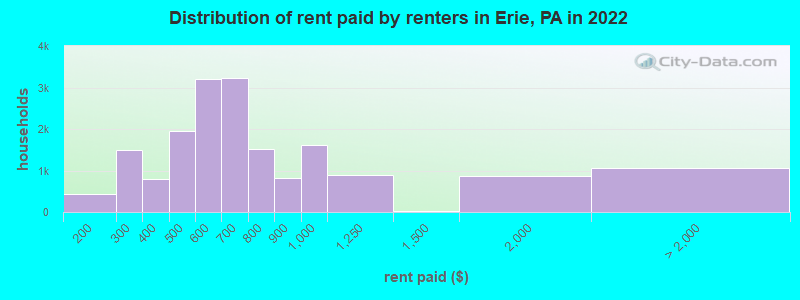
Rent paid by renters in 2022 in Erie, PA
-
- 257$100 to $149
- 173$150 to $199
- 609$200 to $249
- 886$250 to $299
- 341$300 to $349
- 447$350 to $399
- 667$400 to $449
- 1,274$450 to $499
- 1,424$500 to $549
- 1,788$550 to $599
- 1,783$600 to $649
- 1,443$650 to $699
- 683$700 to $749
- 829$750 to $799
- 811$800 to $899
- 1,604$900 to $999
- 884$1,000 to $1,249
- 35$1,250 to $1,499
- 865$1,500 to $1,999
- 100$2,000 to $2,499
- 328$3,500 or more
- 632No cash rent
Percentage of workers working in this county: 97.5%
Number of people working at home: 2,739 (6.7% of all workers)
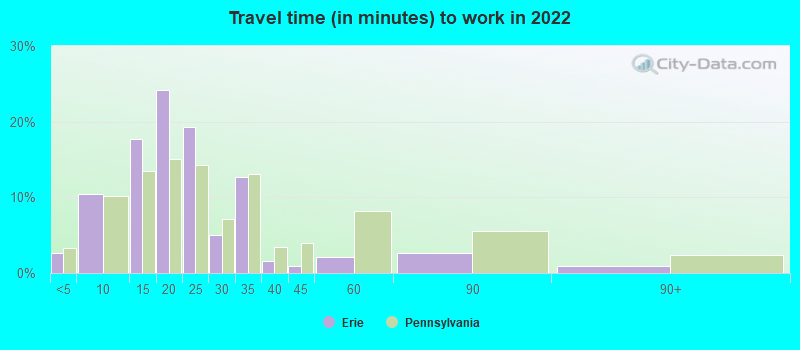
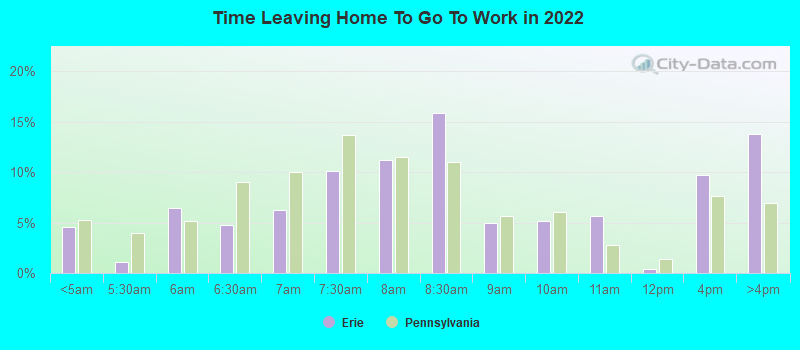
Travel time to work (commute)
- Less than 5 minutes: 1,057
- 5 to 9 minutes: 5,073
- 10 to 14 minutes: 9,092
- 15 to 19 minutes: 8,379
- 20 to 24 minutes: 6,252
- 25 to 29 minutes: 1,978
- 30 to 34 minutes: 3,858
- 35 to 39 minutes: 577
- 40 to 44 minutes: 130
- 45 to 59 minutes: 694
- 60 to 89 minutes: 1,044
- 90 or more minutes: 226
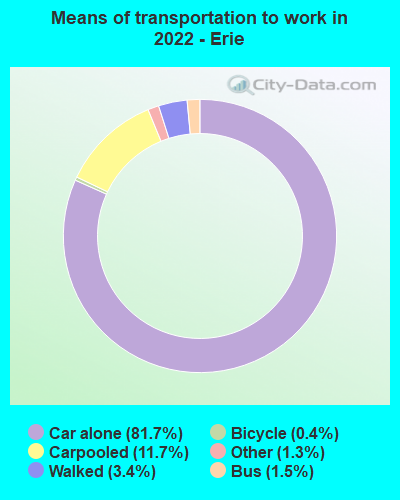
Means of transportation to work:
- Drove a car alone: 40,527 (76.3%)
- Carpooled: 6,124 (11.5%)
- Bus: 401 (0.8%)
- Ferryboat: 15 (0.0%)
- Taxi: 1,074 (2.0%)
- Bicycle: 226 (0.4%)
- Walked: 1,841 (3.5%)
- Worked at home: 2,739 (5.2%)
- Unemployment by race in 2022
- Unemployment rate for White non-Hispanic residents
- 5.3%Males
- 2.1%Females
- Unemployment rate for Asian residents
- 6.5%Males
- 4.7%Females
- Unemployment rate for other race residents
- 8.6%Males
- 1.7%Females
- Unemployment rate for two or more race residents
- 7.0%Males
- 20.3%Females
- Unemployment rate for Hispanic or Latino residents
- 3.1%Males
- 10.4%Females
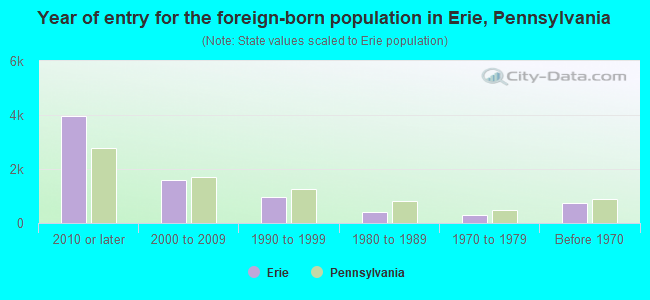
- Year of entry for the foreign-born population in Erie, Pennsylvania
- 3,9712010 or later
- 1,5962000 to 2009
- 9481990 to 1999
- 3951980 to 1989
- 3091970 to 1979
- 745Before 1970
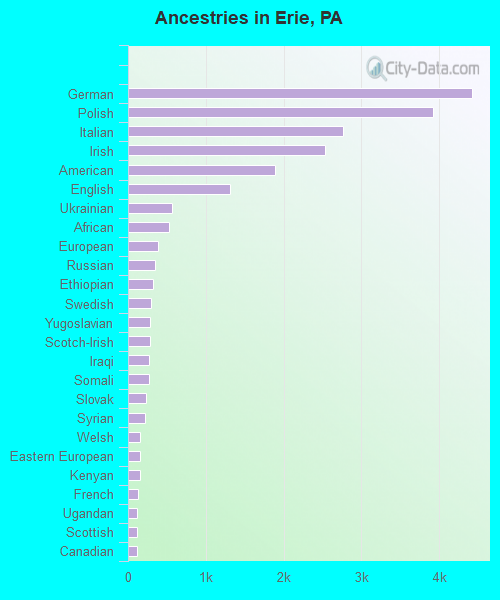
First ancestries reported:
- German: 4,421 (11.1%)
- Polish: 3,924 (9.8%)
- Italian: 2,764 (6.9%)
- Irish: 2,529 (6.3%)
- American: 1,887 (4.7%)
- English: 1,311 (3.3%)
- Ukrainian: 562 (1.4%)
- African: 531 (1.3%)
- European: 390 (1.0%)
- Russian: 345 (0.9%)
- Ethiopian: 321 (0.8%)
- Swedish: 297 (0.7%)
- Yugoslavian: 284 (0.7%)
- Scotch-Irish: 282 (0.7%)
- Iraqi: 276 (0.7%)
- Somali: 272 (0.7%)
- Slovak: 226 (0.6%)
- Syrian: 220 (0.6%)
- Welsh: 159 (0.4%)
- Eastern European: 156 (0.4%)
- Kenyan: 150 (0.4%)
- French: 128 (0.3%)
- Ugandan: 114 (0.3%)
- Scottish: 114 (0.3%)
- Canadian: 113 (0.3%)
- Sudanese: 93 (0.2%)
- Arab: 89 (0.2%)
- Jamaican: 79 (0.2%)
- Lithuanian: 76 (0.2%)
- Albanian: 68 (0.2%)
- Pennsylvania German: 64 (0.2%)
- Czech: 62 (0.2%)
- Moroccan: 61 (0.2%)
- Slavic: 60 (0.2%)
- Croatian: 55 (0.1%)
- Assyrian: 54 (0.1%)
- Armenian: 52 (0.1%)
- Dutch: 49 (0.1%)
- French Canadian: 46 (0.1%)
- Palestinian: 45 (0.1%)
- Haitian: 42 (0.1%)
- Lebanese: 40 (0.1%)
- Hungarian: 40 (0.1%)
- Norwegian: 34 (0.09%)
- British: 31 (0.08%)
- Bulgarian: 29 (0.07%)
- Danish: 28 (0.07%)
- Czechoslovakian: 26 (0.07%)
- Romanian: 26 (0.07%)
- Belgian: 22 (0.06%)
- Iranian: 21 (0.05%)
- Egyptian: 17 (0.04%)
- Scandinavian: 17 (0.04%)
- Portuguese: 14 (0.04%)
- Carpatho Rusyn: 13 (0.03%)
- Senegalese: 10 (0.03%)
- Afghan: 10 (0.03%)
- Northern European: 8 (0.02%)
- Nigerian: 8 (0.02%)
- Guyanese: 7 (0.02%)
- Greek: 7 (0.02%)
- Austrian: 6 (0.02%)
- Basque: 4 (0.01%)
Most common places of birth for foreign-born residents (%):
| Erie: | 11.3% (762) |
| Pennsylvania: | 0.7% (6,855) |
| Erie: | 10.6% (714) |
| Pennsylvania: | 0.8% (7,882) |
| Erie: | 8.0% (537) |
| Pennsylvania: | 0.5% (4,946) |
| Erie: | 7.8% (527) |
| Pennsylvania: | 2.1% (19,841) |
| Erie: | 6.4% (432) |
| Pennsylvania: | 0.3% (3,273) |
| Erie: | 5.7% (387) |
| Pennsylvania: | 5.8% (54,190) |
| Erie: | 5.4% (365) |
| Pennsylvania: | 0.7% (6,690) |
| Erie: | 3.2% (217) |
| Pennsylvania: | 0.5% (5,121) |
| Erie: | 2.8% (189) |
| Pennsylvania: | 1.8% (17,032) |
| Erie: | 2.8% (188) |
| Pennsylvania: | 0.3% (2,395) |
| Erie: | 2.6% (172) |
| Pennsylvania: | 9.2% (86,544) |
| Erie: | 2.4% (163) |
| Pennsylvania: | 0.5% (4,658) |
| Erie: | 2.2% (148) |
| Pennsylvania: | 2.2% (21,039) |
| Erie: | 1.9% (130) |
| Pennsylvania: | 0.3% (2,533) |
| Erie: | 1.6% (108) |
| Pennsylvania: | 3.3% (31,542) |
Place of birth for U.S.-born residents:
- This state: 68,316
- Other state: 16,889
- Northeast: 5,242
- Midwest: 3,388
- South: 6,270
- West: 1,989
83.2% of Erie residents lived in the same house 1 years ago.
Out of people who lived in different houses, 41.5% lived in this county.
Out of people who lived in different counties, 32.9% lived in Pennsylvania.
| Erie: | 83.2% |
| State average: | 89.3% |
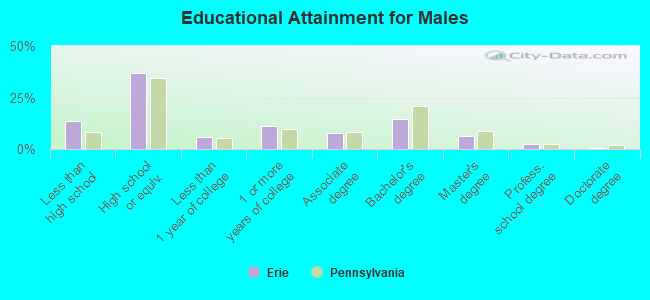
Education attainment for males 25 years and older:
- No schooling: 450
- Nursery to 4th grade: 42
- 5th and 6th grade: 0
- 7th and 8th grade: 293
- 9th grade: 638
- 10th grade: 927
- 11th grade: 747
- 12th grade, no diploma: 807
- High school graduate (or equivalency): 10,702
- Less than 1 year of college: 1,729
- Some college more than 1 year, no degree: 3,197
- Associate degree: 2,263
- Bachelor's degree: 4,239
- Master's degree: 1,886
- Professional school degree: 759
- Doctorate degree: 145
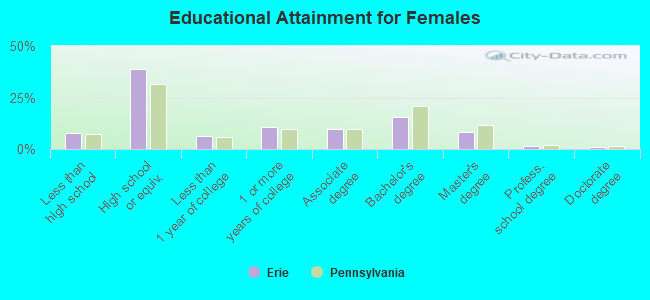
Education attainment for females 25 years and older:
- No schooling: 587
- Nursery to 4th grade: 142
- 5th and 6th grade: 0
- 7th and 8th grade: 176
- 9th grade: 40
- 10th grade: 291
- 11th grade: 476
- 12th grade, no diploma: 852
- High school graduate (or equivalency): 12,539
- Less than 1 year of college: 2,047
- Some college more than 1 year, no degree: 3,468
- Associate degree: 3,206
- Bachelor's degree: 4,940
- Master's degree: 2,613
- Professional school degree: 490
- Doctorate degree: 357
Housing units in structures:
- One, detached: 26,542
- One, attached: 1,907
- Two: 5,954
- 3 or 4: 3,379
- 5 to 9: 1,131
- 10 to 19: 1,332
- 20 to 49: 769
- 50 or more: 2,893
- Mobile homes: 127
Housing units lacking complete kitchen facilities in 2022: 4.0%
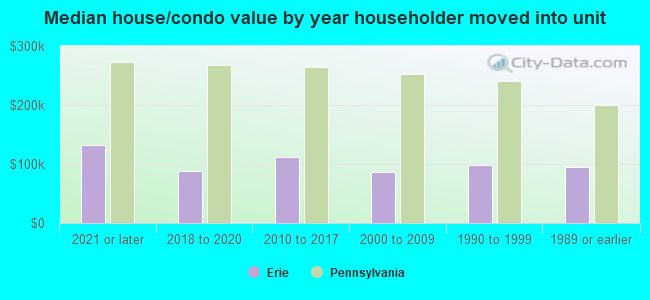
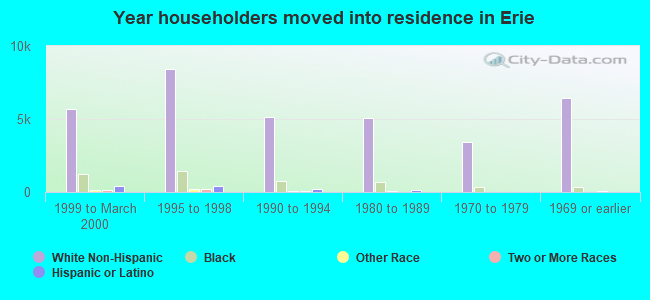
House/condo owner moved in on average 16 years ago
Renter moved in on average 3 years ago
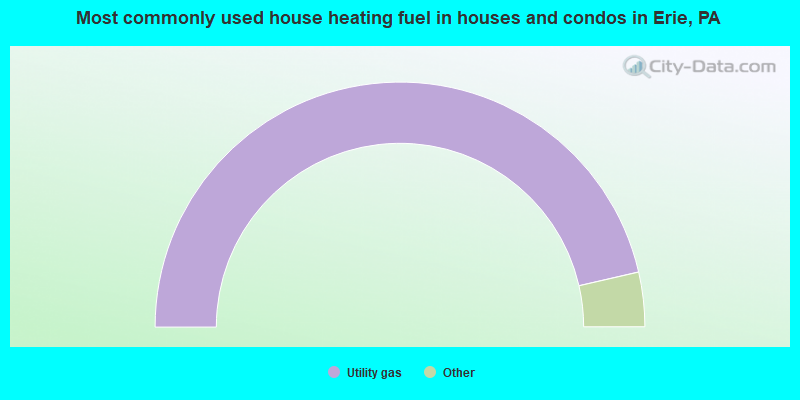
- 92.8%Utility gas
- 2.9%Electricity
- 2.2%Fuel oil, kerosene, etc.
- 1.1%Bottled, tank, or LP gas
- 0.4%Wood
- 0.3%Other fuel
- 0.1%No fuel used
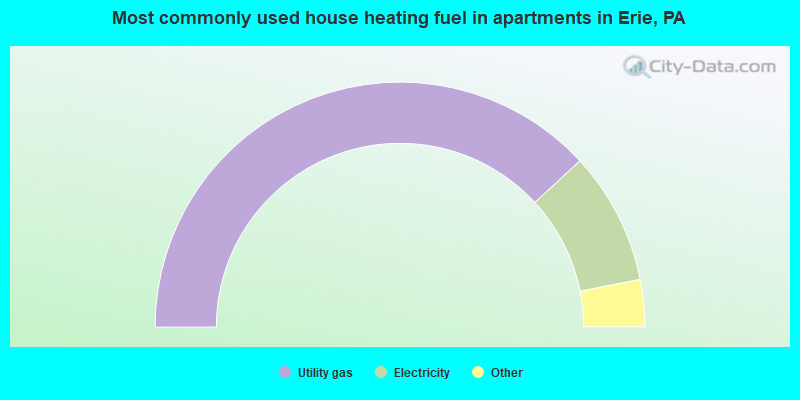
- 76.3%Utility gas
- 17.5%Electricity
- 2.0%Bottled, tank, or LP gas
- 1.7%No fuel used
- 1.4%Fuel oil, kerosene, etc.
- 1.1%Other fuel
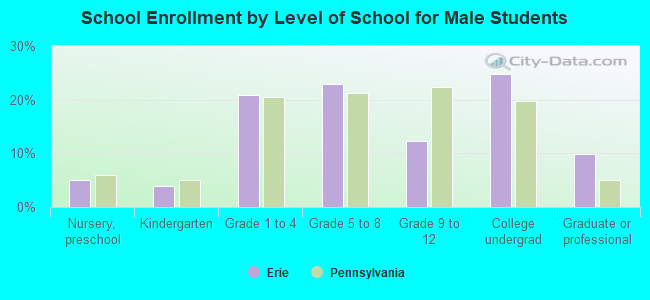
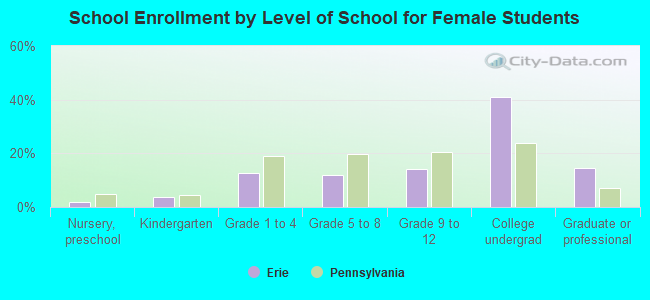
Private vs. public school enrollment:
| Here: | 11.1% |
| Pennsylvania: | 15.7% |
| Here: | 15.3% |
| Pennsylvania: | 13.4% |
| Here: | 55.4% |
| Pennsylvania: | 39.8% |