El Paso de Robles (Paso Robles), CA (California) Houses and Residents
| El Paso de Robles (Paso Robles): | $662,723 |
| California: | $715,900 |
Total population: 31,287 (Urban population: 23,150, Rural population: 1,061 (all nonfarm))
Houses: 13,051 (12,187 occupied: 7,587 owner occupied, 4,818 renter occupied)
| % of renters here: | 39% |
| State: | 44% |
Housing density: 753 houses/condos per square mile
Median price asked for vacant for-sale houses and condos in 2022: $320,212.
Median contract rent in 2022: $1,571 (lower quartile is $1,142, upper quartile is over $2,000)
Median rent asked for vacant for-rent units in 2022: $3,588
Median gross rent in El Paso de Robles (Paso Robles), CA in 2022: $1,704
Housing units in El Paso de Robles (Paso Robles) with a mortgage: 5,118 (393 second mortgage, 0 home equity loan, 328 both second mortgage and home equity loan)
Houses without a mortgage: 25
Median household income for houses/condos with a mortgage: $115,185
Median household income for apartments without a mortgage: $67,478
Median monthly housing costs: $1,766
Compare current foreclosures near El Paso de Robles (Paso Robles), CA:
| Photo | Address | Area | Beds / Baths | Price | Details |
|---|---|---|---|---|---|

|
#1
Galeria Cir
Atascadero, CA 93422
|
1,387 sq. feet
|
2 baths 3 beds |
show details | |

|
#2
Via Arroyo
Paso Robles, CA 93446
|
1,806 sq. feet
|
2 baths 3 beds |
show details | |

|
#3
Curbaril Ave
Atascadero, CA 93422
|
1,386 sq. feet
|
2 baths 3 beds |
show details | |

|
#4
Horstman St
Templeton, CA 93465
|
1,232 sq. feet
|
2 baths 3 beds |
show details | |

|
#5
Miramon Ave
Atascadero, CA 93422
|
940 sq. feet
|
1 baths 2 beds |
show details | |

|
#6
Tielo St
San Miguel, CA 93451
|
1,519 sq. feet
|
2 baths 4 beds |
show details | |

|
#7
Olmeda Ave Unit D
Atascadero, CA 93422
|
1,017 sq. feet
|
1 baths 2 beds |
show details | |

|
#8
Pala Mission Way
San Miguel, CA 93451
|
1,569 sq. feet
|
2 baths 4 beds |
show details | |

|
#9
Curbaril Ave
Atascadero, CA 93422
|
1,040 sq. feet
|
2 baths 3 beds |
show details | |

|
#10
Santa Ynez Ave
Atascadero, CA 93422
|
1,024 sq. feet
|
1 baths 3 beds |
show details |
| Photo | Address | Area | Beds / Baths | Price | Details |
|---|---|---|---|---|---|

|
#11
Sierra Ln
Paso Robles, CA 93446
|
883 sq. feet
|
1 baths 2 beds |
show details | |

|
#12
Southfork Pl
Paso Robles, CA 93446
|
1,927 sq. feet
|
2 baths 3 beds |
show details | |

|
#13
Piona Ln
Atascadero, CA 93422
|
2,382 sq. feet
|
2 baths 3 beds |
show details | |

|
#14
Carmel Rd
Atascadero, CA 93422
|
720 sq. feet
|
1 baths 2 beds |
show details | |

|
#15
Water View Dr
Paso Robles, CA 93446
|
1,344 sq. feet
|
2 baths 3 beds |
show details | |

|
#16
El Camino Real
Atascadero, CA 93422
|
1,560 sq. feet
|
2 baths 3 beds |
show details | |

|
#17
Poplar St
Atascadero, CA 93422
|
1,080 sq. feet
|
1 baths 2 beds |
show details | |

|
#18
Running Deer Rd
Paso Robles, CA 93446
|
840 sq. feet
|
1 baths 2 beds |
show details | |

|
#19
Mesa Grande Dr
Shandon, CA 93461
|
1,344 sq. feet
|
2 baths 3 beds |
show details | |

|
#20
Oak Knoll Dr
Paso Robles, CA 93446
|
1,259 sq. feet
|
2 baths 3 beds |
show details |
| Photo | Address | Area | Beds / Baths | Price | Details |
|---|---|---|---|---|---|

|
#21
Mesa Grande Dr
Shandon, CA 93461
|
1,420 sq. feet
|
2 baths 3 beds |
show details | |

|
#22
Sycamore Canyon Rd
Paso Robles, CA 93446
|
3,113 sq. feet
|
2 baths 4 beds |
show details | |

|
#23
Linda Cir
Paso Robles, CA 93446
|
1,404 sq. feet
|
2 baths 3 beds |
show details | |

|
#24
Pacific Ave
Paso Robles, CA 93446
|
1,054 sq. feet
|
1 baths 4 beds |
show details | |

|
#25
Turtle Creek Rd
Paso Robles, CA 93446
|
1,088 sq. feet
|
2 baths 2 beds |
show details | |

|
#26
W 12th St
Paso Robles, CA 93446
|
1,297 sq. feet
|
2 baths 3 beds |
show details | |

|
#27
Torrey Pines Dr
Paso Robles, CA 93446
|
1,800 sq. feet
|
3 baths 3 beds |
show details | |

|
#28
Montebello Oaks Dr
Paso Robles, CA 93446
|
2,382 sq. feet
|
3 baths 3 beds |
show details | |

|
#29
Flag Way # B
Paso Robles, CA 93446
|
1,120 sq. feet
|
2 baths 2 beds |
show details | |

|
#30
Camino Lobo
Paso Robles, CA 93446
|
1,176 sq. feet
|
2 baths 3 beds |
show details |
| Photo | Address | Area | Beds / Baths | Price | Details |
|---|---|---|---|---|---|

|
#31
Austin Ct
Paso Robles, CA 93446
|
1,411 sq. feet
|
2 baths 2 beds |
show details | |

|
#32
Pacific Ave
Paso Robles, CA 93446
|
1,891 sq. feet
|
3 baths 4 beds |
show details | |

|
#33
Madrone St
Paso Robles, CA 93446
|
1,586 sq. feet
|
2 baths 3 beds |
show details | |

|
#34
Cottage Ln
Paso Robles, CA 93446
|
1,605 sq. feet
|
2 baths 3 beds |
show details | |

|
#35
Escarpa Ave
Atascadero, CA 93422
|
11,942 sq. feet
|
4 baths 4 beds |
show details | |

|
#36
San Diego Rd
Atascadero, CA 93422
|
1,452 sq. feet
|
2 baths 2 beds |
show details | |

|
#37
Lake View Dr
Atascadero, CA 93422
|
1,483 sq. feet
|
2 baths 3 beds |
show details | |

|
#38
Traditions Loop
Paso Robles, CA 93446
|
1,578 sq. feet
|
2 baths 2 beds |
show details | |

|
#39
Junipero Ave
Atascadero, CA 93422
|
1,234 sq. feet
|
1 baths 2 beds |
show details | |

|
#40
Carmelita Ave
Atascadero, CA 93422
|
1,596 sq. feet
|
2 baths 2 beds |
show details |
| Photo | Address | Area | Beds / Baths | Price | Details |
|---|---|---|---|---|---|

|
#41
Curbaril Ave
Atascadero, CA 93422
|
1,412 sq. feet
|
2 baths 3 beds |
show details | |

|
#42
Cortez Ave
Atascadero, CA 93422
|
456 sq. feet
|
1 baths 1 beds |
show details | |

|
#43
Curbaril Ave
Atascadero, CA 93422
|
1,618 sq. feet
|
2 baths 3 beds |
show details | |

|
#44
Curbaril Ave
Atascadero, CA 93422
|
1,618 sq. feet
|
2 baths 3 beds |
show details | |

|
#45
Via Del Sueno
Atascadero, CA 93422
|
2,464 sq. feet
|
2 baths 3 beds |
show details | |

|
#46
Prairie Rd
Paso Robles, CA 93446
|
784 sq. feet
|
1 baths 2 beds |
show details | |

|
#47
Wellsona Rd # 75
Paso Robles, CA 93446
|
1,430 sq. feet
|
2 baths 3 beds |
show details | |

|
#48
Stoney Creek Rd
Paso Robles, CA 93446
|
1,687 sq. feet
|
2 baths 3 beds |
show details | |

|
#49
Dorothy St
Paso Robles, CA 93446
|
1,120 sq. feet
|
2 baths 3 beds |
show details | |

|
Check over 1 million property listings on Foreclosure.com!
|
browse all offers | |||


Median year apartment built: 1982
Household type by relationship:
Households: 31,628- Male householders: 5,431 (885 living alone), Female householders: 6,586 (2,311 living alone)
5,892 spouses (5,866 opposite-sex spouses), 726 unmarried partners, (726 opposite-sex unmarried partners), 9,518 children (8,668 natural, 400 adopted, 449 stepchildren), 1,147 grandchildren, 284 brothers or sisters, 353 parents, 0 foster children, 587 other relatives, 906 non-relatives
- In group quarters: 194
Size of family households: 3,655 2-persons, 1,560 3-persons, 1,422 4-persons, 715 5-persons, 443 6-persons, 238 7-or-more-persons.
Size of nonfamily households: 3,286 1-person, 807 2-persons, 128 3-persons, 52 4-persons, 2 6-persons.
4,766 married couples with children.
1,381 single-parent households (100 men, 1,281 women).
74.9% of residents of El Paso de Robles (Paso Robles) speak English at home.
19.9% of residents speak Spanish at home (59% speak English very well, 10% speak English well, 15% speak English not well, 16% don't speak English at all).
2.0% of residents speak other Indo-European language at home (95% speak English very well, 5% speak English well).
2.2% of residents speak Asian or Pacific Island language at home (49% speak English very well, 30% speak English well, 14% speak English not well, 7% don't speak English at all).
0.9% of residents speak other language at home (26% speak English very well, 45% speak English well, 3% speak English not well, 25% don't speak English at all).
Foreign born population: 5,202 (16.4%)
(50.1% of them are naturalized citizens)
| Here: | 5.9 |
| State: | 6.0 |
| Here: | 4.0 |
| State: | 3.9 |

- Bedrooms in owner-occupied houses and condos in El Paso de Robles (Paso Robles), California
- 23no bedroom
- 851 bedroom
- 1,0112 bedrooms
- 4,4883 bedrooms
- 1,8404 bedrooms
- 1425+ bedrooms

- Bedrooms in renter-occupied apartments in El Paso de Robles (Paso Robles), California
- 251no bedroom
- 7891 bedroom
- 2,2162 bedrooms
- 1,2613 bedrooms
- 2734 bedrooms
- 305+ bedrooms

- Cars and other vehicles available in El Paso de Robles (Paso Robles) in owner-occupied houses/condos
- 121no vehicle
- 2,1041 vehicle
- 3,1732 vehicles
- 1,2193 vehicles
- 5714 vehicles
- 3995+ vehicles

- Cars and other vehicles available in El Paso de Robles (Paso Robles) in renter-occupied apartments
- 254no vehicle
- 2,1901 vehicle
- 1,5832 vehicles
- 4553 vehicles
- 1494 vehicles
- 1885+ vehicles

- Rooms in owner-occupied houses in El Paso de Robles (Paso Robles), California
- 131 room
- 92 rooms
- 573 rooms
- 1,1894 rooms
- 1,6305 rooms
- 1,9436 rooms
- 1,0757 rooms
- 8788 rooms
- 7939+ rooms

- Rooms in renter-occupied apartments in El Paso de Robles (Paso Robles), California
- 1901 room
- 2062 rooms
- 8553 rooms
- 1,7054 rooms
- 7425 rooms
- 6986 rooms
- 2207 rooms
- 928 rooms
- 1129+ rooms


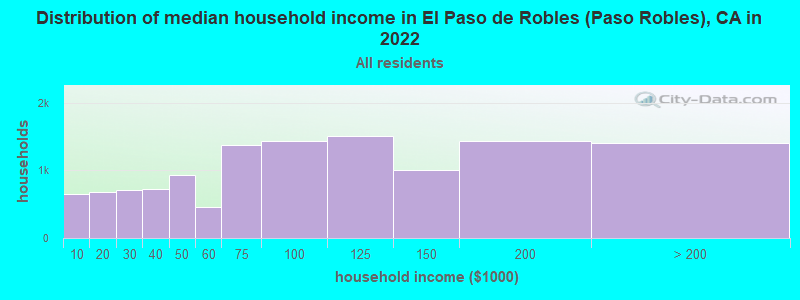
El Paso de Robles (Paso Robles), CA household income distribution

- 645Less than $10,000
- 678$10,000 to $19,999
- 707$20,000 to $29,999
- 723$30,000 to $39,999
- 933$40,000 to $49,999
- 458$50,000 to $59,999
- 1,378$60,000 to $74,999
- 1,435$75,000 to $99,999
- 1,510$100,000 to $124,999
- 1,007$125,000 to $149,999
- 1,430$150,000 to $199,999
- 1,404$200,000 or more
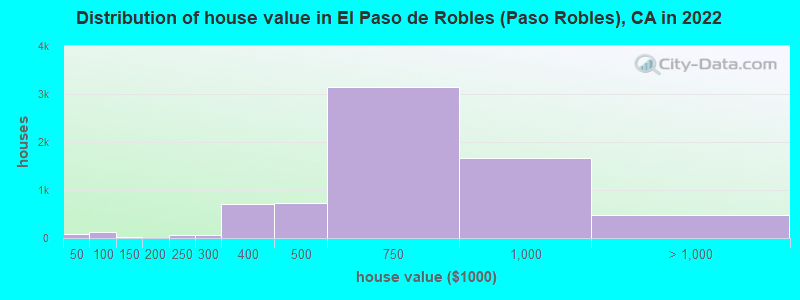
Home value of owner - occupied houses in 2022 in El Paso de Robles (Paso Robles), CA
-
- 14Less than $10,000
- 8$20,000 to $24,999
- 20$30,000 to $34,999
- 47$40,000 to $49,999
- 24$50,000 to $59,999
- 16$60,000 to $69,999
- 9$70,000 to $79,999
- 20$80,000 to $89,999
- 12$125,000 to $149,999
- 57$200,000 to $249,999
- 55$250,000 to $299,999
- 715$300,000 to $399,999
- 720$400,000 to $499,999
- 3,149$500,000 to $749,999
- 1,667$750,000 to $999,999
- 346$1,000,000 to $1,499,999
- 18$1,500,000 to $1,999,999
- 111$2,000,000 or more
Rent paid by renters in 2022 in El Paso de Robles (Paso Robles), CA
-
- 52Less than $100
- 19$200 to $249
- 289$250 to $299
- 64$400 to $449
- 37$550 to $599
- 93$600 to $649
- 73$650 to $699
- 230$800 to $899
- 155$900 to $999
- 646$1,000 to $1,249
- 708$1,250 to $1,499
- 1,346$1,500 to $1,999
- 698$2,000 to $2,499
- 323$2,500 to $2,999
- 136$3,000 to $3,499
- 30$3,500 or more
- 185No cash rent


Percentage of workers working in this county: 93.3%
Number of people working at home: 1,587 (10.8% of all workers)
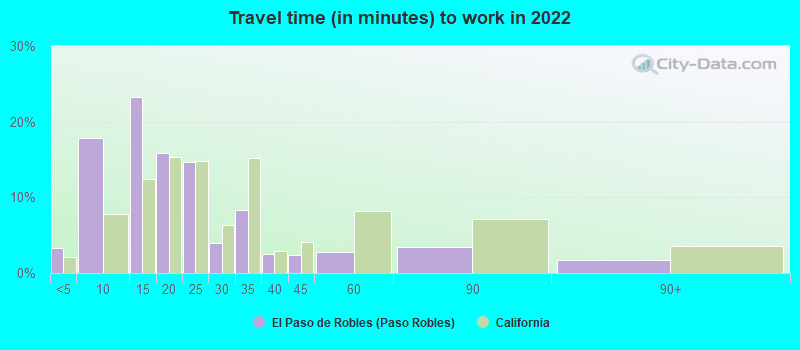
Travel time to work (commute)
- Less than 5 minutes: 428
- 5 to 9 minutes: 2,042
- 10 to 14 minutes: 3,060
- 15 to 19 minutes: 1,358
- 20 to 24 minutes: 1,211
- 25 to 29 minutes: 255
- 30 to 34 minutes: 1,935
- 35 to 39 minutes: 549
- 40 to 44 minutes: 669
- 45 to 59 minutes: 1,028
- 60 to 89 minutes: 406
- 90 or more minutes: 416
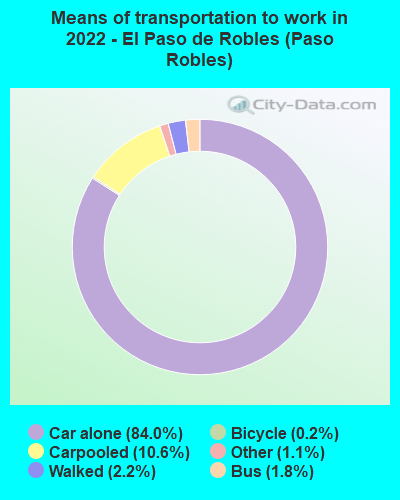
Means of transportation to work:
- Drove a car alone: 11,598 (75.6%)
- Carpooled: 1,375 (9.0%)
- Bus: 199 (1.3%)
- Ferryboat: 8 (0.1%)
- Taxi: 142 (0.9%)
- Bicycle: 31 (0.2%)
- Walked: 270 (1.8%)
- Worked at home: 1,587 (10.3%)

- Unemployment by race in 2022
- Unemployment rate for White non-Hispanic residents
- 6.2%Males
- 3.8%Females
- Unemployment rate for Asian residents
- 2.7%Males
- Unemployment rate for other race residents
- 10.8%Males
- 20.1%Females
- Unemployment rate for two or more race residents
- 6.5%Females
- Unemployment rate for Hispanic or Latino residents
- 3.0%Males
- 9.9%Females

- Year of entry for the foreign-born population in El Paso de Robles (Paso Robles), California
- 1,1192010 or later
- 1,7032000 to 2009
- 8891990 to 1999
- 1,2441980 to 1989
- 5071970 to 1979
- 397Before 1970

First ancestries reported:
- English: 1,348 (8.5%)
- Irish: 1,100 (6.9%)
- Italian: 817 (5.1%)
- American: 781 (4.9%)
- German: 770 (4.8%)
- European: 234 (1.5%)
- Polish: 187 (1.2%)
- Portuguese: 162 (1.0%)
- Scottish: 156 (1.0%)
- Egyptian: 117 (0.7%)
- French Canadian: 117 (0.7%)
- Danish: 100 (0.6%)
- Scotch-Irish: 87 (0.5%)
- Norwegian: 74 (0.5%)
- Russian: 69 (0.4%)
- French: 67 (0.4%)
- Welsh: 61 (0.4%)
- Croatian: 46 (0.3%)
- Finnish: 46 (0.3%)
- Kenyan: 45 (0.3%)
- Yugoslavian: 45 (0.3%)
- Dutch: 44 (0.3%)
- Northern European: 40 (0.3%)
- Syrian: 39 (0.2%)
- South African: 38 (0.2%)
- Ukrainian: 37 (0.2%)
- Swedish: 34 (0.2%)
- Scandinavian: 30 (0.2%)
- Lithuanian: 24 (0.2%)
- Greek: 24 (0.2%)
- Hungarian: 24 (0.2%)
- British: 18 (0.1%)
- Assyrian: 16 (0.1%)
- Slovak: 16 (0.1%)
- Austrian: 11 (0.07%)
- Australian: 11 (0.07%)
- Arab: 11 (0.07%)
- Czechoslovakian: 9 (0.06%)
- Eastern European: 8 (0.05%)
- Pennsylvania German: 3 (0.02%)
Most common places of birth for foreign-born residents (%):
| El Paso de Robles (Paso Robles): | 59.2% (2,945) |
| California: | 37.2% (3,881,193) |
| El Paso de Robles (Paso Robles): | 4.7% (235) |
| California: | 2.8% (290,436) |
| El Paso de Robles (Paso Robles): | 4.7% (233) |
| California: | 6.6% (684,672) |
| El Paso de Robles (Paso Robles): | 2.4% (117) |
| California: | 4.9% (512,335) |
| El Paso de Robles (Paso Robles): | 2.1% (104) |
| California: | 0.6% (58,161) |
| El Paso de Robles (Paso Robles): | 1.8% (91) |
| California: | 7.8% (818,297) |
| El Paso de Robles (Paso Robles): | 1.7% (83) |
| California: | 1.7% (176,274) |
| El Paso de Robles (Paso Robles): | 1.6% (82) |
| California: | 0.4% (42,718) |
| El Paso de Robles (Paso Robles): | 1.6% (78) |
| California: | 1.2% (127,477) |
Place of birth for U.S.-born residents:
- This state: 20,551
- Other state: 5,429
- Northeast: 891
- Midwest: 1,765
- South: 1,347
- West: 1,389
91.0% of El Paso de Robles (Paso Robles) residents lived in the same house 1 years ago.
Out of people who lived in different houses, 38.6% lived in this county.
Out of people who lived in different counties, 91.8% lived in California.
| El Paso de Robles (Paso Robles): | 91.0% |
| State average: | 88.9% |
Education attainment for males 25 years and older:
- No schooling: 192
- Nursery to 4th grade: 77
- 5th and 6th grade: 228
- 7th and 8th grade: 107
- 9th grade: 345
- 10th grade: 37
- 11th grade: 108
- 12th grade, no diploma: 146
- High school graduate (or equivalency): 2,415
- Less than 1 year of college: 705
- Some college more than 1 year, no degree: 1,386
- Associate degree: 994
- Bachelor's degree: 2,524
- Master's degree: 575
- Professional school degree: 253
- Doctorate degree: 159

Education attainment for females 25 years and older:
- No schooling: 351
- Nursery to 4th grade: 64
- 5th and 6th grade: 80
- 7th and 8th grade: 209
- 9th grade: 38
- 10th grade: 94
- 11th grade: 34
- 12th grade, no diploma: 235
- High school graduate (or equivalency): 1,864
- Less than 1 year of college: 1,062
- Some college more than 1 year, no degree: 2,179
- Associate degree: 1,751
- Bachelor's degree: 2,160
- Master's degree: 820
- Professional school degree: 292
- Doctorate degree: 73


Housing units in structures:
- One, detached: 9,341
- One, attached: 852
- Two: 366
- 3 or 4: 671
- 5 to 9: 984
- 10 to 19: 401
- 20 to 49: 153
- 50 or more: 132
- Mobile homes: 148
Median worth of mobile homes: $357,678
Housing units lacking complete kitchen facilities in 2022: 1.7%
House/condo owner moved in on average 11 years ago
Renter moved in on average 4 years ago

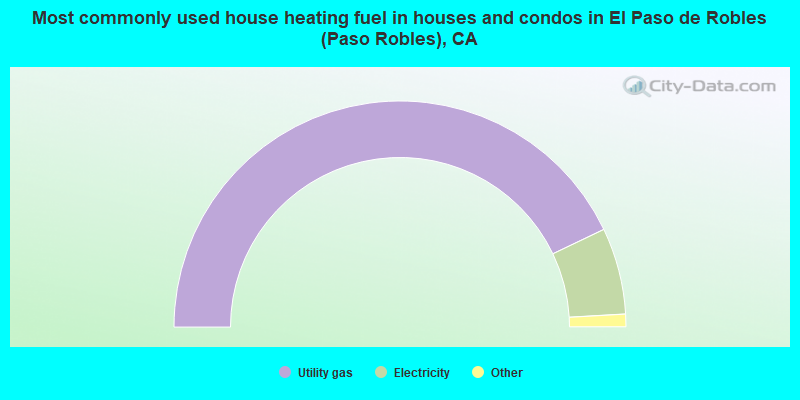
- 85.8%Utility gas
- 12.4%Electricity
- 1.1%Solar energy
- 0.5%Bottled, tank, or LP gas
- 0.2%Wood
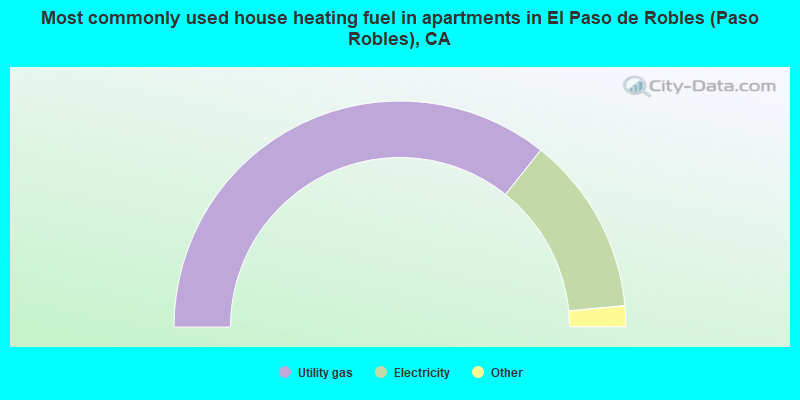
- 71.4%Utility gas
- 25.6%Electricity
- 1.5%Bottled, tank, or LP gas
- 1.5%No fuel used
Private vs. public school enrollment:
| Here: | 6.4% |
| California: | 10.5% |
| Here: | 2.3% |
| California: | 8.5% |
| Here: | 7.0% |
| California: | 15.9% |


