Eaton, OH (Ohio) Houses and Residents
| Eaton: | $149,317 |
| Ohio: | $204,100 |
Total population: 8,261 (Urban population: 7,459 (all inside urban clusters), Rural population: 560 (all nonfarm))
Houses: 3,963 (3,702 occupied: 2,563 owner occupied, 1,177 renter occupied)
| % of renters here: | 31% |
| State: | 33% |
Housing density: 699 houses/condos per square mile
Median price asked for vacant for-sale houses and condos in 2022: $289,859.
Median contract rent in 2022: $600 (lower quartile is $544, upper quartile is $708)
Median rent asked for vacant for-rent units in 2022: $575
Median gross rent in Eaton, OH in 2022: $773
Housing units in Eaton with a mortgage: 1,400 (94 second mortgage, 0 home equity loan, 72 both second mortgage and home equity loan)
Houses without a mortgage: 26
Median household income for houses/condos with a mortgage: $72,663
Median household income for apartments without a mortgage: $52,152
Median monthly housing costs: $730
Compare current foreclosures in Eaton, OH:
| Photo | Address | Area | Beds / Baths | Price | Details |
|---|---|---|---|---|---|

|
#1
E Main St
Eaton, OH 45320
|
2,152 sq. feet
|
3 baths 4 beds |
show details | |

|
#2
Ashtree Dr
Eaton, OH 45320
|
1,050 sq. feet
|
2 baths 3 beds |
show details | |

|
#3
Alexander Rd
Eaton, OH 45320
|
1,075 sq. feet
|
2 baths 3 beds |
show details | |

|
#4
Division St
Eaton, OH 45320
|
1,728 sq. feet
|
1 baths 4 beds |
show details | |

|
#5
Little League Dr
Eaton, OH 45320
|
1,050 sq. feet
|
1 baths 3 beds |
show details | |

|
#6
Skodborg Dr
Eaton, OH 45320
|
1,428 sq. feet
|
2 baths 3 beds |
show details | |

|
#7
S Maple St
Eaton, OH 45320
|
2,106 sq. feet
|
1 baths 2 beds |
show details | |

|
#8
520 Cherry St
Eaton, OH 45320
|
903 sq. feet
|
1 baths 1 beds |
show details | |

|
#9
E Somers St
Eaton, OH 45320
|
1,096 sq. feet
|
1 baths 3 beds |
show details | |

|
#10
Long Dr
Eaton, OH 45320
|
1,496 sq. feet
|
1 baths 2 beds |
show details |
| Photo | Address | Area | Beds / Baths | Price | Details |
|---|---|---|---|---|---|

|
#11
Hubble St
Eaton, OH 45320
|
954 sq. feet
|
1 baths 2 beds |
show details | |

|
#12
Wayne Ave
Eaton, OH 45320
|
1,215 sq. feet
|
1 baths 2 beds |
show details | |

|
#13
N Maple St
Eaton, OH 45320
|
1,380 sq. feet
|
1 baths 3 beds |
show details | |

|
#14
Park Ave
Eaton, OH 45320
|
1,600 sq. feet
|
2 baths 3 beds |
show details | |

|
#15
Murray Rd
Eaton, OH 45320
|
1,754 sq. feet
|
2 baths 3 beds |
show details | |

|
#16
Swain Rd
Eaton, OH 45320
|
3,124 sq. feet
|
2 baths 6 beds |
show details | |

|
#17
Wynona Dr
Eaton, OH 45320
|
1,152 sq. feet
|
1 baths 2 beds |
show details | |

|
#18
Thunder Dr
Eaton, OH 45320
|
1,405 sq. feet
|
2 baths 3 beds |
show details | |

|
#19
E High St
Eaton, OH 45320
|
1,212 sq. feet
|
2 baths 3 beds |
show details | |

|
#20
Brookston Pl
Eaton, OH 45320
|
2,751 sq. feet
|
2 baths 3 beds |
show details |
| Photo | Address | Area | Beds / Baths | Price | Details |
|---|---|---|---|---|---|

|
#21
S Maple St
Eaton, OH 45320
|
1,050 sq. feet
|
1 baths 3 beds |
show details | |

|
#22
Little League Dr
Eaton, OH 45320
|
1,323 sq. feet
|
1 baths 3 beds |
show details | |

|
#23
W Somers St
Eaton, OH 45320
|
2,375 sq. feet
|
2 baths 4 beds |
show details | |

|
#24
South St
Eaton, OH 45320
|
1,375 sq. feet
|
1 baths 3 beds |
show details | |

|
#25
Norseman Dr
Eaton, OH 45320
|
1,680 sq. feet
|
1 baths 3 beds |
show details | |

|
#26
Cypress Ln
Eaton, OH 45320
|
1,247 sq. feet
|
2 baths 4 beds |
show details | |

|
#27
Longman Rd
Eaton, OH 45320
|
1,325 sq. feet
|
1 baths 3 beds |
show details | |

|
#28
Camden Rd
Eaton, OH 45320
|
1,520 sq. feet
|
1 baths 3 beds |
show details | |

|
#29
Crawfordsville Campbellst Rd
Eaton, OH 45320
|
1,647 sq. feet
|
1 baths 3 beds |
show details | |

|
#30
Helen Cir
Eaton, OH 45320
|
1,857 sq. feet
|
2 baths 4 beds |
show details |
| Photo | Address | Area | Beds / Baths | Price | Details |
|---|---|---|---|---|---|

|
#31
E Somers St
Eaton, OH 45320
|
1,560 sq. feet
|
2 baths 3 beds |
show details | |

|
#32
W Florence Campbellstown Rd
Eaton, OH 45320
|
- sq. feet
|
- baths - beds |
show details | |

|
#33
Holiday Ave
Eaton, OH 45320
|
- sq. feet
|
- baths - beds |
show details | |

|
#34
Hammer Dr
Eaton, OH 45320
|
- sq. feet
|
- baths - beds |
show details | |

|
#35
Eaton Lewisburg Rd Apt B
Eaton, OH 45320
|
- sq. feet
|
- baths - beds |
show details | |

|
#36
Skodborg Dr
Eaton, OH 45320
|
- sq. feet
|
- baths - beds |
show details | |

|
Check over 1 million property listings on Foreclosure.com!
|
browse all offers | |||

Latest news about housing in Eaton, OH collected exclusively by city-data.com from local newspapers, TV, and radio stations

 | PBS Frontline: Dayton examined on "Left Behind America" (60 replies) |
| New Job at the Dayton VA Area housing? (1 reply) |
| Moving to the Dayton Area (13 replies) |
| Another where should I live thread, Please help. (18 replies) |
| Aria Spradling Case (6 replies) |
| Eaton, Oh. Places to live? (5 replies) |

Median year apartment built: 1967
Household type by relationship:
Households: 8,346- Male householders: 1,539 (514 living alone), Female householders: 2,127 (807 living alone)
1,459 spouses (1,459 opposite-sex spouses), 382 unmarried partners, (371 opposite-sex unmarried partners), 2,118 children (1,874 natural, 59 adopted, 184 stepchildren), 223 grandchildren, 51 brothers or sisters, 36 parents, 0 foster children, 33 other relatives, 88 non-relatives
- In group quarters: 283
Size of family households: 1,043 2-persons, 348 3-persons, 451 4-persons, 122 5-persons, 93 6-persons, 23 7-or-more-persons.
Size of nonfamily households: 1,364 1-person, 295 2-persons.
1,073 married couples with children.
598 single-parent households (34 men, 564 women).
98.7% of residents of Eaton speak English at home.
0.1% of residents speak Spanish at home (100% speak English very well).
0.3% of residents speak other Indo-European language at home (100% speak English very well).
0.6% of residents speak Asian or Pacific Island language at home (73% speak English very well, 14% speak English not well, 12% don't speak English at all).
0.1% of residents speak other language at home (100% speak English very well).
Foreign born population: 102 (1.2%)
(73.5% of them are naturalized citizens)
| Here: | 6.1 |
| State: | 6.7 |
| Here: | 4.7 |
| State: | 4.4 |

- Bedrooms in owner-occupied houses and condos in Eaton, Ohio
- 0no bedroom
- 751 bedroom
- 5212 bedrooms
- 1,5873 bedrooms
- 3064 bedrooms
- 745+ bedrooms

- Bedrooms in renter-occupied apartments in Eaton, Ohio
- 19no bedroom
- 2351 bedroom
- 5682 bedrooms
- 3143 bedrooms
- 414 bedrooms
- 05+ bedrooms

- Cars and other vehicles available in Eaton in owner-occupied houses/condos
- 80no vehicle
- 7661 vehicle
- 1,1522 vehicles
- 4473 vehicles
- 914 vehicles
- 285+ vehicles

- Cars and other vehicles available in Eaton in renter-occupied apartments
- 182no vehicle
- 5491 vehicle
- 3842 vehicles
- 213 vehicles
- 414 vehicles
- 05+ vehicles

- Rooms in owner-occupied houses in Eaton, Ohio
- 01 room
- 02 rooms
- 553 rooms
- 3344 rooms
- 6255 rooms
- 4746 rooms
- 3737 rooms
- 3348 rooms
- 3699+ rooms

- Rooms in renter-occupied apartments in Eaton, Ohio
- 191 room
- 512 rooms
- 1413 rooms
- 2874 rooms
- 3885 rooms
- 896 rooms
- 1847 rooms
- 48 rooms
- 149+ rooms


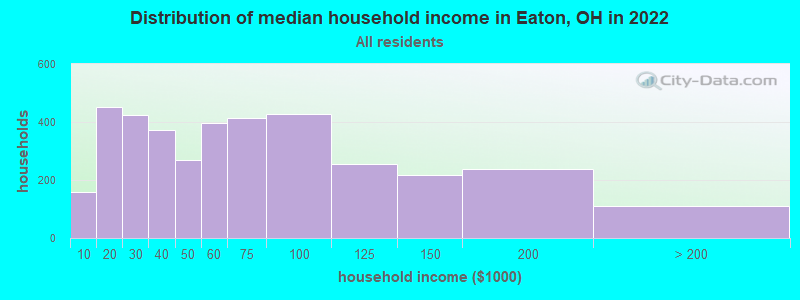
Eaton, OH household income distribution

- 157Less than $10,000
- 453$10,000 to $19,999
- 423$20,000 to $29,999
- 374$30,000 to $39,999
- 269$40,000 to $49,999
- 397$50,000 to $59,999
- 414$60,000 to $74,999
- 426$75,000 to $99,999
- 254$100,000 to $124,999
- 217$125,000 to $149,999
- 238$150,000 to $199,999
- 111$200,000 or more
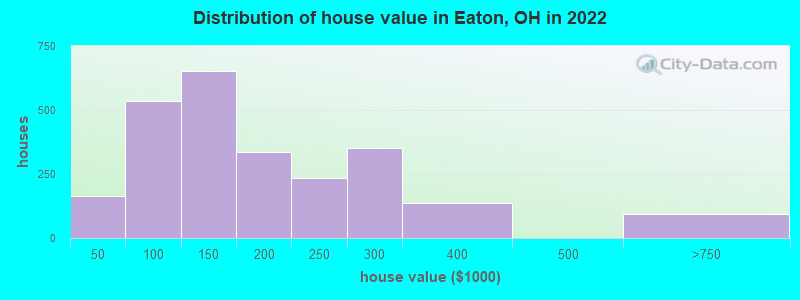
Home value of owner - occupied houses in 2022 in Eaton, OH
-
- 36Less than $10,000
- 7$10,000 to $14,999
- 24$15,000 to $19,999
- 32$20,000 to $24,999
- 22$30,000 to $34,999
- 40$40,000 to $49,999
- 52$50,000 to $59,999
- 123$60,000 to $69,999
- 77$70,000 to $79,999
- 209$80,000 to $89,999
- 32$90,000 to $99,999
- 421$100,000 to $124,999
- 231$125,000 to $149,999
- 193$150,000 to $174,999
- 142$175,000 to $199,999
- 232$200,000 to $249,999
- 353$250,000 to $299,999
- 137$300,000 to $399,999
- 93$500,000 to $749,999
Rent paid by renters in 2022 in Eaton, OH
-
- 4$200 to $249
- 25$250 to $299
- 19$300 to $349
- 58$350 to $399
- 11$400 to $449
- 70$450 to $499
- 75$500 to $549
- 213$550 to $599
- 142$600 to $649
- 240$650 to $699
- 43$700 to $749
- 6$750 to $799
- 76$800 to $899
- 48$900 to $999
- 8$1,000 to $1,249
- 46No cash rent


Percentage of workers working in this county: 68.0%
Number of people working at home: 207 (5.2% of all workers)
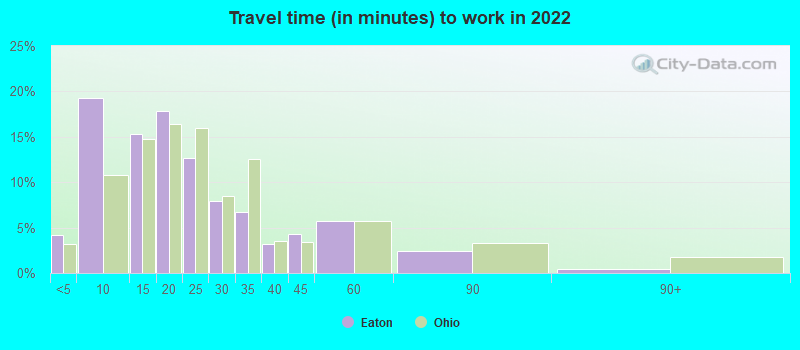
Travel time to work (commute)
- Less than 5 minutes: 267
- 5 to 9 minutes: 1,124
- 10 to 14 minutes: 440
- 15 to 19 minutes: 240
- 20 to 24 minutes: 421
- 25 to 29 minutes: 89
- 30 to 34 minutes: 160
- 35 to 39 minutes: 24
- 40 to 44 minutes: 266
- 45 to 59 minutes: 449
- 60 to 89 minutes: 108
- 90 or more minutes: 31
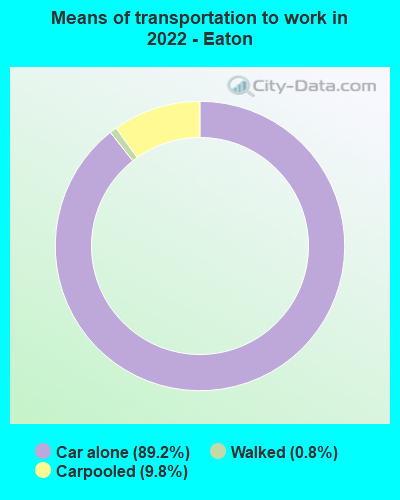
Means of transportation to work:
- Drove a car alone: 5,883 (83.5%)
- Carpooled: 695 (9.9%)
- Bus: 3 (0.0%)
- Taxi: 7 (0.1%)
- Walked: 54 (0.8%)
- Worked at home: 207 (2.9%)

- Unemployment by race in 2022
- Unemployment rate for White non-Hispanic residents
- 0.8%Males
- 0.8%Females
- Unemployment rate for two or more race residents
- 17.4%Females

- Year of entry for the foreign-born population in Eaton, Ohio
- 272010 or later
- 102000 to 2009
- 361990 to 1999
- 91980 to 1989
- 151970 to 1979
- 15Before 1970

First ancestries reported:
- American: 782 (24.4%)
- English: 625 (19.5%)
- German: 525 (16.4%)
- Irish: 265 (8.3%)
- European: 162 (5.1%)
- Scottish: 115 (3.6%)
- Jamaican: 49 (1.5%)
- Hungarian: 30 (0.9%)
- Northern European: 28 (0.9%)
- African: 20 (0.6%)
- Scotch-Irish: 19 (0.6%)
- Polish: 15 (0.5%)
- British: 12 (0.4%)
- Italian: 11 (0.3%)
- Scandinavian: 11 (0.3%)
- Lebanese: 9 (0.3%)
- Dutch: 8 (0.2%)
- Eastern European: 7 (0.2%)
Most common places of birth for foreign-born residents (%):
| Eaton: | 56.9% (58) |
| Ohio: | 2.0% (11,398) |
| Eaton: | 38.2% (39) |
| Ohio: | 2.6% (14,988) |
| Eaton: | 3.9% (4) |
| Ohio: | 1.4% (8,101) |
Place of birth for U.S.-born residents:
- This state: 5,865
- Other state: 2,356
- Northeast: 146
- Midwest: 1,263
- South: 778
- West: 160
91.8% of Eaton residents lived in the same house 1 years ago.
Out of people who lived in different houses, 37.4% lived in this county.
Out of people who lived in different counties, 84.3% lived in Ohio.
| Eaton: | 91.8% |
| State average: | 87.8% |
Education attainment for males 25 years and older:
- No schooling: 20
- Nursery to 4th grade: 0
- 5th and 6th grade: 0
- 7th and 8th grade: 16
- 9th grade: 78
- 10th grade: 7
- 11th grade: 19
- 12th grade, no diploma: 110
- High school graduate (or equivalency): 1,112
- Less than 1 year of college: 194
- Some college more than 1 year, no degree: 369
- Associate degree: 142
- Bachelor's degree: 304
- Master's degree: 180
- Professional school degree: 67
- Doctorate degree: 39

Education attainment for females 25 years and older:
- No schooling: 39
- Nursery to 4th grade: 0
- 5th and 6th grade: 0
- 7th and 8th grade: 0
- 9th grade: 36
- 10th grade: 29
- 11th grade: 48
- 12th grade, no diploma: 23
- High school graduate (or equivalency): 1,232
- Less than 1 year of college: 293
- Some college more than 1 year, no degree: 414
- Associate degree: 287
- Bachelor's degree: 535
- Master's degree: 262
- Professional school degree: 29
- Doctorate degree: 0


Housing units in structures:
- One, detached: 3,041
- One, attached: 176
- Two: 181
- 3 or 4: 278
- 5 to 9: 161
- 10 to 19: 31
- 20 to 49: 58
- 50 or more: 14
- Mobile homes: 21
House/condo owner moved in on average 8 years ago
Renter moved in on average 3 years ago

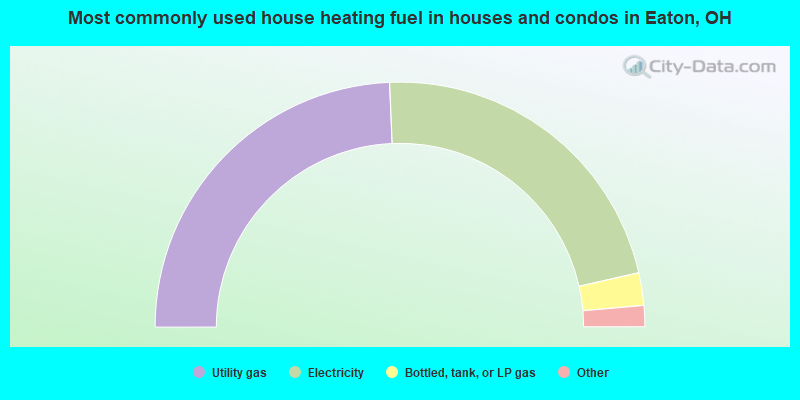
- 48.7%Utility gas
- 44.3%Electricity
- 4.3%Bottled, tank, or LP gas
- 1.4%Fuel oil, kerosene, etc.
- 0.8%Wood
- 0.3%Other fuel
- 0.2%No fuel used
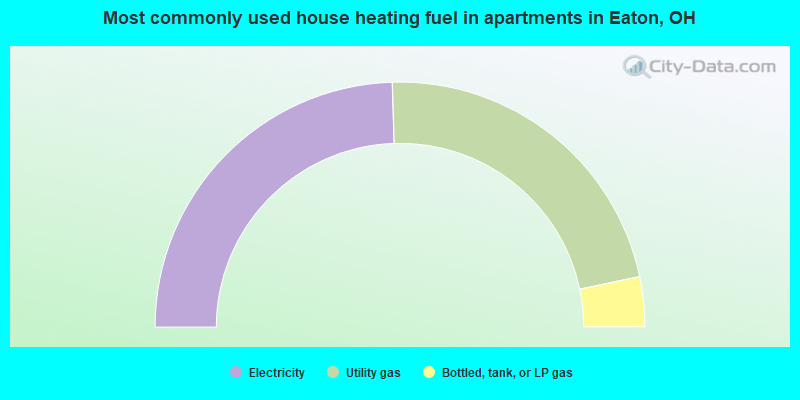
- 49.0%Electricity
- 44.4%Utility gas
- 6.6%Bottled, tank, or LP gas
Private vs. public school enrollment:
| Here: | 0.9% |
| Ohio: | 16.0% |
| Here: | 7.6% |
| Ohio: | 13.1% |
| Here: | 2.8% |
| Ohio: | 22.3% |


