Dubuque, IA (Iowa) Houses and Residents
Estimated median house or condo value in 2022: $190,273 (it was $86,400 in 2000 )
Dubuque:
$190,273Iowa:
$194,600
Lower value quartile - upper value quartile: $133,620 - $282,775Mean price in 2022: Detached houses: $251,221 Here:
$251,221State:
$245,224
Townhouses or other attached units: $226,489 Here:
$226,489State:
$238,767
In 2-unit structures: $276,334 Here:
$276,334State:
$243,070
In 3-to-4-unit structures: $195,796 Here:
$195,796State:
$162,139
In 5-or-more-unit structures: $204,973 Here:
$204,973State:
$190,519
Mobile homes: $22,797 Here:
$22,797State:
$51,271
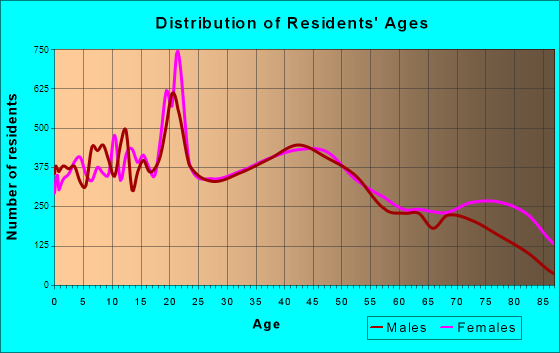
Total population: 58,436 (Urban population: 57,156, Rural population: 312 (all nonfarm) )
Houses: 27,758 (25,648 occupied: 16,589 owner occupied, 9,023 renter occupied )
% of renters here:
35%State:
28%
Housing density: 1,048 houses/condos per square mile
Median price asked for vacant for-sale houses and condos in 2022: $594,872.
Median contract rent in 2022: $765 (lower quartile is $638, upper quartile is $925)
Median rent asked for vacant for-rent units in 2022: $792
Median gross rent in Dubuque, IA in 2022: $917
Housing units in Dubuque with a mortgage: 9,321 (1,325 second mortgage, 9 home equity loan, 1,122 both second mortgage and home equity loan )Houses without a mortgage: 251
Median household income for houses/condos with a mortgage: $92,793
Median household income for apartments without a mortgage: $71,725
Median monthly housing costs: $935
Data:
Median house or condo value ($)
Median house or condo value ($ change since 2000)
Median house or condo value ($) - White
Median house or condo value ($) - Black or African American
Median house or condo value ($) - Asian
Median house or condo value ($) - Hispanic or Latino
Median house or condo value ($) - American Indian and Alaska Native
Median house or condo value ($) - Multirace
Median house or condo value ($) - Other Race
Median price asked for mobile homes ($)
Household density (households per square mile)
Mean house or condo value by units in structure - 1, detached ($)
Mean house or condo value by units in structure - 1, attached ($)
Mean house or condo value by units in structure - 2 ($)
Mean house or condo value by units in structure by units in structure - 3 or 4 ($)
Mean house or condo value by units in structure - 5 or more ($)
Mean house or condo value by units in structure - Boat, RV, van, etc. ($)
Mean house or condo value by units in structure - Mobile home ($)
Median contract rent ($)
Median contract rent - Lower quartile ($)
Median contract rent - Upper quartile ($)
Median gross rent ($)
Urban houses (%)
Rural houses (%)
Houses occupied (%)
Houses occupied (% change since 2000)
Houses owner occupied (%)
Houses owner occupied (% change since 2000)
Houses renter occupied (%)
Houses renter occupied (% change since 2000)
Vacant housing units - For rent (%)
Vacant housing units - For rent (% change since 2000)
Vacant housing units - For sale only (%)
Vacant housing units - For sale only (% change since 2000)
Vacant housing units - Rented or sold, not occupied (%)
Vacant housing units - Rented or sold, not occupied (% change since 2000)
Vacant housing units - For seasonal, recreational, or occasional use (%)
Vacant housing units - For seasonal, recreational, or occasional use (% change since 2000)
Vacant housing units - For migrant workers (%)
Vacant housing units - For migrant workers (% change since 2000)
Vacant housing units - Other vacant (%)
Vacant housing units - Other vacant (% change since 2000)
Median monthly housing costs ($)
Median household income for houses/condos with a mortgage ($)
Median household income for houses/condos without a mortgage ($)
Median household income ($)
Median household income ($) - White
Median household income ($) - Black or African American
Median household income ($) - Asian
Median household income ($) - Hispanic or Latino
Median household income ($) - American Indian and Alaska Native
Median household income ($) - Multirace
Median household income ($) - Other Race
Mortgage status - with mortgage (%)
Mortgage status - with second mortgage (%)
Mortgage status - with home equity loan (%)
Mortgage status - with both second mortgage and home equity loan (%)
Mortgage status - without a mortgage (%)
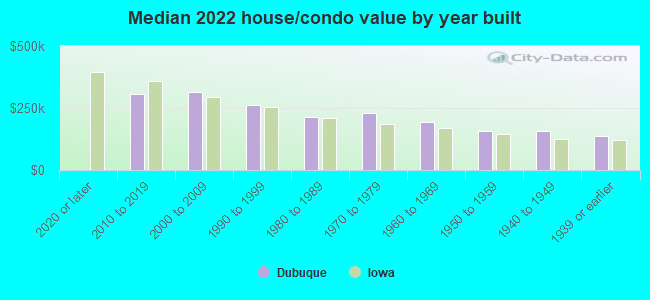
Median year house/condo built
Median year apartment built
Household type by relationship - Male householder living alone (%)
Household type by relationship - Male householder not living alone (%)
Household type by relationship - Female householder living alone (%)
Household type by relationship - Female householder not living alone (%)
Household type by relationship - Opposite-Sex spouse (%)
Household type by relationship - Same-Sex spouse (%)
Household type by relationship - Opposite-Sex unmarried partner (%)
Household type by relationship - Same-Sex unmarried partner (%)
Household type by relationship - In group quarters (%)
Size of family households - 2-person household (%)
Size of family households - 3-person household (%)
Size of family households - 4-person household (%)
Size of family households - 5-person household (%)
Size of family households - 6-person household (%)
Size of family households - 7-or-more-person household (%)
Size of nonfamily households - 1-person household (%)
Size of nonfamily households - 2-person household (%)
Size of nonfamily households - 3-person household (%)
Size of nonfamily households - 4-person household (%)
Size of nonfamily households - 5-person household (%)
Size of nonfamily households - 6-person household (%)
Size of nonfamily households - 7-or-moreperson household (%)
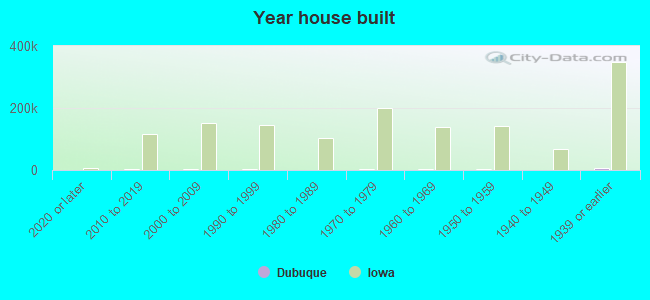
Year house built - Built 2010 or later (%)
Year house built - Built 2000 to 2009 (%)
Year house built - Built 1990 to 1999 (%)
Year house built - Built 1980 to 1989 (%)
Year house built - Built 1970 to 1979 (%)
Year house built - Built 1960 to 1969 (%)
Year house built - Built 1950 to 1959 (%)
Year house built - Built 1940 to 1949 (%)
Year house built - Built 1939 or earlier (%)
Median number of rooms in houses and condos
Median number of rooms in apartments
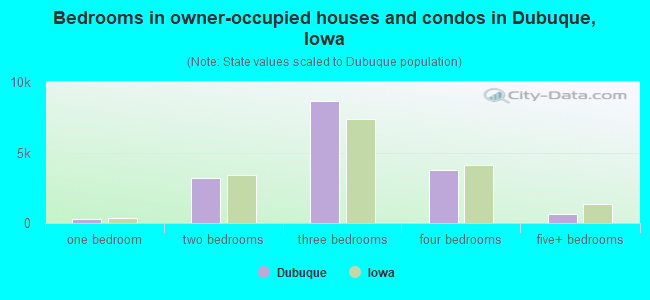
Median number of bedrooms in owner occupied houses
Mean number of bedrooms in owner occupied houses
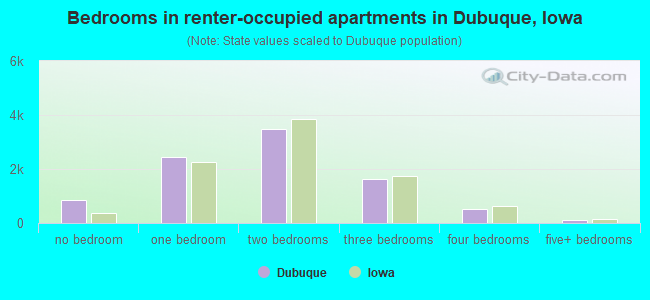
Median number of bedrooms in renter occupied houses
Mean number of bedrooms in renter occupied houses
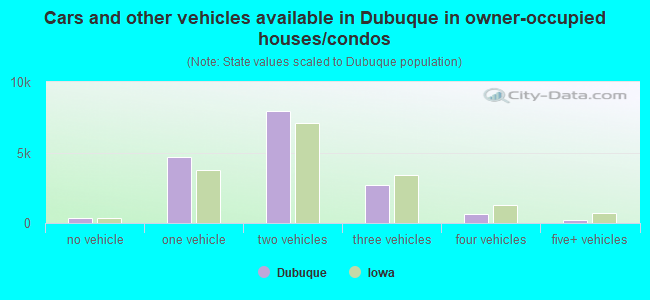
Median number of vehichles in owner occupied houses
Mean number of vehichles in owner occupied houses
Median number of vehichles in renter occupied houses
Mean number of vehichles in renter occupied houses
Rooms in owner-occupied houses - 1 room (%)
Rooms in owner-occupied houses - 2 rooms (%)
Rooms in owner-occupied houses - 3 rooms (%)
Rooms in owner-occupied houses - 4 rooms (%)
Rooms in owner-occupied houses - 5 rooms (%)
Rooms in owner-occupied houses - 6 rooms (%)
Rooms in owner-occupied houses - 7 rooms (%)
Rooms in owner-occupied houses - 8 rooms (%)
Rooms in owner-occupied houses - 9+ rooms (%)
Rooms in renter-occupied houses - 1 room (%)
Rooms in renter-occupied houses - 2 rooms (%)
Rooms in renter-occupied houses - 3 rooms (%)
Rooms in renter-occupied houses - 4 rooms (%)
Rooms in renter-occupied houses - 5 rooms (%)
Rooms in renter-occupied houses - 6 rooms (%)
Rooms in renter-occupied houses - 7 rooms (%)
Rooms in renter-occupied houses - 8 rooms (%)
Rooms in renter-occupied houses - 9+ rooms (%)
Bedrooms in owner-occupied houses - no bedrooms (%)
Bedrooms in owner-occupied houses - 1 bedroom (%)
Bedrooms in owner-occupied houses - 2 bedrooms (%)
Bedrooms in owner-occupied houses - 3 bedrooms (%)
Bedrooms in owner-occupied houses - 4 bedrooms (%)
Bedrooms in owner-occupied houses - 5+ bedrooms (%)
Bedrooms in renter-occupied houses - no bedrooms (%)
Bedrooms in renter-occupied houses - 1 bedroom (%)
Bedrooms in renter-occupied houses - 2 bedrooms (%)
Bedrooms in renter-occupied houses - 3 bedrooms (%)
Bedrooms in renter-occupied houses - 4 bedrooms (%)
Bedrooms in renter-occupied houses - 5+ bedrooms (%)
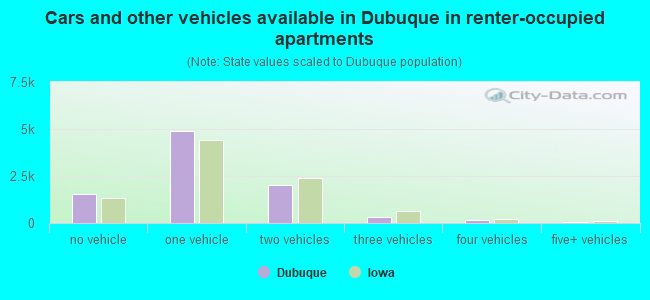
Vehicles available in owner-occupied houses - no vehicle available (%)
Vehicles available in owner-occupied houses - 1 vehicle available(%)
Vehicles available in owner-occupied houses - 2 Vehicles available (%)
Vehicles available in owner-occupied houses - 3 Vehicles available (%)
Vehicles available in owner-occupied houses - 4 Vehicles available (%)
Vehicles available in owner-occupied houses - 5+ Vehicles available (%)
Vehicles available in renter-occupied houses - no vehicle available (%)
Vehicles available in renter-occupied houses - 1 vehicle available (%)
Vehicles available in renter-occupied houses - 2 Vehicles available (%)
Vehicles available in renter-occupied houses - 3 Vehicles available (%)
Vehicles available in renter-occupied houses - 4 Vehicles available (%)
Vehicles available in renter-occupied houses - 5+ Vehicles available (%)
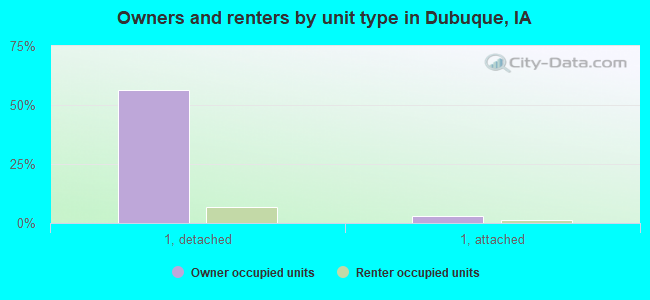
Housing units in structures - 1, detached (%)
Housing units in structures - 1, attached (%)
Housing units in structures - 2 (%)
Housing units in structures - 3 or 4 (%)
Housing units in structures - 5 to 9 (%)
Housing units in structures - 10 to 19 (%)
Housing units in structures - 20 to 49 (%)
Housing units in structures - 50 or more (%)
Housing units in structures - Mobile home (%)
Housing units in structures - Boat, RV, van, etc. (%)
Housing units in structures - Owners - 1, detached (%)
Housing units in structures - Owners - 1, attached (%)
Housing units in structures - Owners - 2 (%)
Housing units in structures - Owners - 3 or 4 (%)
Housing units in structures - Owners - 5 to 9 (%)
Housing units in structures - Owners - 10 to 19 (%)
Housing units in structures - Owners - 20 to 49 (%)
Housing units in structures - Owners - 50 or more (%)
Housing units in structures - Owners - Mobile home (%)
Housing units in structures - Owners - Boat, RV, van, etc. (%)
Housing units in structures - Renters - 1, detached (%)
Housing units in structures - Renters - 1, attached (%)
Housing units in structures - Renters - 2 (%)
Housing units in structures - Renters - 3 or 4 (%)
Housing units in structures - Renters - 5 to 9 (%)
Housing units in structures - Renters - 10 to 19 (%)
Housing units in structures - Renters - 20 to 49 (%)
Housing units in structures - Renters - 50 or more (%)
Housing units in structures - Renters - Mobile home (%)
Housing units in structures - Renters - Boat, RV, van, etc. (%)
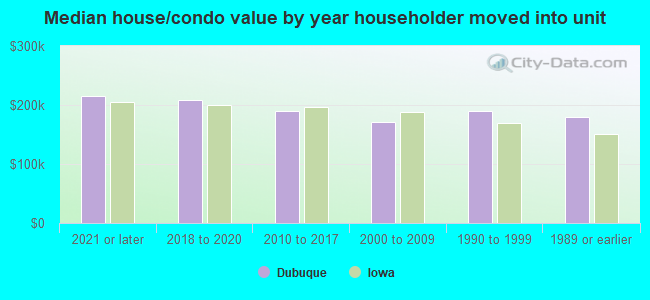
House/condo owner moved in on average (years ago)
Renter moved in on average (years ago)
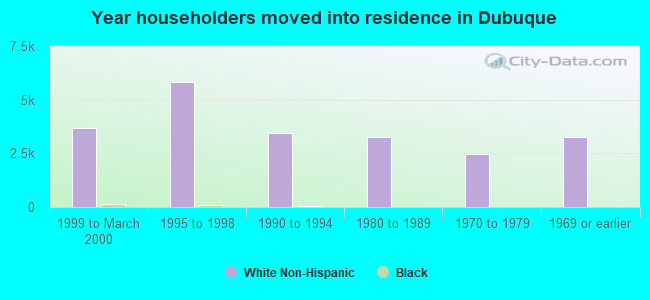
Year householder moved into unit - Moved in 1999 to March 2000 (%)
Year householder moved into unit - Moved in 1999 to March 2000 (%) - White
Year householder moved into unit - Moved in 1999 to March 2000 (%) - Black or African American
Year householder moved into unit - Moved in 1999 to March 2000 (%) - Asian
Year householder moved into unit - Moved in 1999 to March 2000 (%) - Hispanic or Latino
Year householder moved into unit - Moved in 1999 to March 2000 (%) - American Indian and Alaska Native
Year householder moved into unit - Moved in 1999 to March 2000 (%) - Multirace
Year householder moved into unit - Moved in 1999 to March 2000 (%) - Other Race
Year householder moved into unit - Moved in 1995 to 1998 (%)
Year householder moved into unit - Moved in 1995 to 1998 (%) - White
Year householder moved into unit - Moved in 1995 to 1998 (%) - Black or African American
Year householder moved into unit - Moved in 1995 to 1998 (%) - Asian
Year householder moved into unit - Moved in 1995 to 1998 (%) - Hispanic or Latino
Year householder moved into unit - Moved in 1995 to 1998 (%) - American Indian and Alaska Native
Year householder moved into unit - Moved in 1995 to 1998 (%) - Multirace
Year householder moved into unit - Moved in 1995 to 1998 (%) - Other Race
Year householder moved into unit - Moved in 1990 to 1994 (%)
Year householder moved into unit - Moved in 1990 to 1994 (%) - White
Year householder moved into unit - Moved in 1990 to 1994 (%) - Black or African American
Year householder moved into unit - Moved in 1990 to 1994 (%) - Asian
Year householder moved into unit - Moved in 1990 to 1994 (%) - Hispanic or Latino
Year householder moved into unit - Moved in 1990 to 1994 (%) - American Indian and Alaska Native
Year householder moved into unit - Moved in 1990 to 1994 (%) - Multirace
Year householder moved into unit - Moved in 1990 to 1994 (%) - Other Race
Year householder moved into unit - Moved in 1980 to 1989 (%)
Year householder moved into unit - Moved in 1980 to 1989 (%) - White
Year householder moved into unit - Moved in 1980 to 1989 (%) - Black or African American
Year householder moved into unit - Moved in 1980 to 1989 (%) - Asian
Year householder moved into unit - Moved in 1980 to 1989 (%) - Hispanic or Latino
Year householder moved into unit - Moved in 1980 to 1989 (%) - American Indian and Alaska Native
Year householder moved into unit - Moved in 1980 to 1989 (%) - Multirace
Year householder moved into unit - Moved in 1980 to 1989 (%) - Other Race
Year householder moved into unit - Moved in 1970 to 1979 (%)
Year householder moved into unit - Moved in 1970 to 1979 (%) - White
Year householder moved into unit - Moved in 1970 to 1979 (%) - Black or African American
Year householder moved into unit - Moved in 1970 to 1979 (%) - Asian
Year householder moved into unit - Moved in 1970 to 1979 (%) - Hispanic or Latino
Year householder moved into unit - Moved in 1970 to 1979 (%) - American Indian and Alaska Native
Year householder moved into unit - Moved in 1970 to 1979 (%) - Multirace
Year householder moved into unit - Moved in 1970 to 1979 (%) - Other Race
Year householder moved into unit - Moved in 1969 or earlier (%)
Year householder moved into unit - Moved in 1969 or earlier (%) - White
Year householder moved into unit - Moved in 1969 or earlier (%) - Black or African American
Year householder moved into unit - Moved in 1969 or earlier (%) - Asian
Year householder moved into unit - Moved in 1969 or earlier (%) - Hispanic or Latino
Year householder moved into unit - Moved in 1969 or earlier (%) - American Indian and Alaska Native
Year householder moved into unit - Moved in 1969 or earlier (%) - Multirace
Year householder moved into unit - Moved in 1969 or earlier (%) - Other Race
Housing units lacking complete plumbing facilities (%)
Housing units lacking complete kitchen facilities (%)
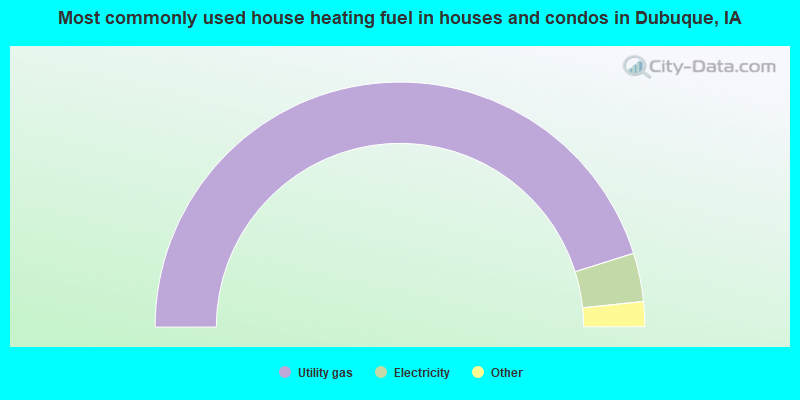
House heating fuel used in houses and condos - Utility gas (%)
House heating fuel used in houses and condos - Bottled, tank, or LP gas (%)
House heating fuel used in houses and condos - Electricity (%)
House heating fuel used in houses and condos - Fuel oil, kerosene, etc. (%)
House heating fuel used in houses and condos - Coal or coke (%)
House heating fuel used in houses and condos - Wood (%)
House heating fuel used in houses and condos - Solar energy (%)
House heating fuel used in houses and condos - Other fuel (%)
House heating fuel used in houses and condos - No fuel used (%)
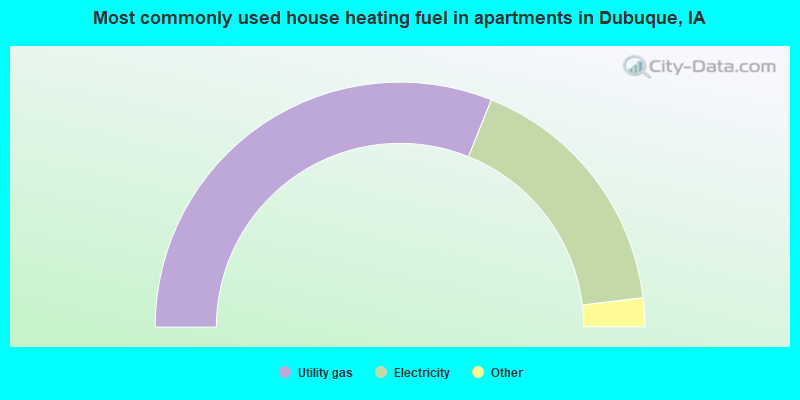
House heating fuel used in apartments - Utility gas (%)
House heating fuel used in apartments - Bottled, tank, or LP gas (%)
House heating fuel used in apartments - Electricity (%)
House heating fuel used in apartments - Fuel oil, kerosene, etc. (%)
House heating fuel used in apartments - Coal or coke (%)
House heating fuel used in apartments - Wood (%)
House heating fuel used in apartments - Solar energy (%)
House heating fuel used in apartments - Other fuel (%)
House heating fuel used in apartments - No fuel used (%)
Latest news about housing in Dubuque, IA collected exclusively by city-data.com from local newspapers, TV, and radio stations
Median year house/condo built: 1963Median year apartment built: 1965Household type by relationship:
Households: 59,233
Male householders: 12,417 (3,987 living alone ), Female householders: 12,746 (4,790 living alone )10,538 spouses (10,417 opposite-sex spouses ), 1,852 unmarried partners , (1,709 opposite-sex unmarried partners ), 13,671 children (12,962 natural , 348 adopted , 360 stepchildren ), 687 grandchildren , 517 brothers or sisters , 455 parents , 8 foster children , 572 other relatives , 1,929 non-relatives In group quarters: 3,837
Size of family households: 7,781 2-persons , 3,100 3-persons , 1,720 4-persons , 1,011 5-persons , 306 6-persons , 248 7-or-more-persons .
Size of nonfamily households: 8,834 1-person , 2,427 2-persons , 210 3-persons , 156 4-persons , 43 5-persons , 19 6-persons .
7,301 married couples with children. single-parent households (1,074 men , 1,453 women ).
94.5% of residents of Dubuque speak English at home. of residents speak Spanish at home (73% speak English very well , 14% speak English well , 5% speak English not well , 9% don't speak English at all ).of residents speak other Indo-European language at home (54% speak English very well , 17% speak English well , 29% speak English not well ).of residents speak Asian or Pacific Island language at home (47% speak English very well , 27% speak English well , 22% speak English not well , 5% don't speak English at all ).of residents speak other language at home (64% speak English very well , 13% speak English well , 20% speak English not well , 3% don't speak English at all ).
Foreign born population: 3,266 (5.5%)of them are naturalized citizens )
Median number of rooms in houses and condos:
Median number of rooms in apartments
Owner-occupied Renter-occupied
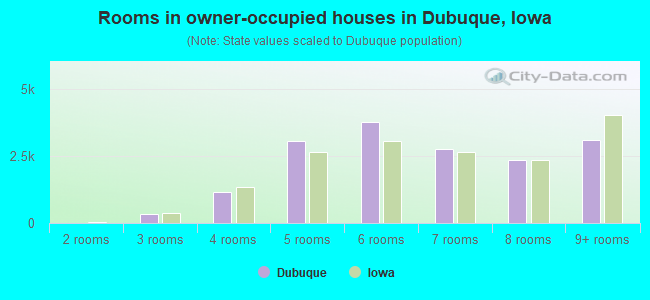
Rooms in owner-occupied houses in Dubuque, Iowa
24 1 room 6 2 rooms 323 3 rooms 1,171 4 rooms 3,071 5 rooms 3,792 6 rooms 2,752 7 rooms 2,362 8 rooms 3,088 9+ rooms
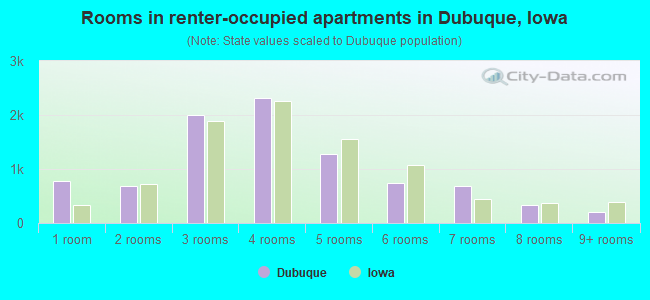
Rooms in renter-occupied apartments in Dubuque, Iowa
781 1 room 677 2 rooms 1,996 3 rooms 2,324 4 rooms 1,284 5 rooms 747 6 rooms 678 7 rooms 338 8 rooms 198 9+ rooms
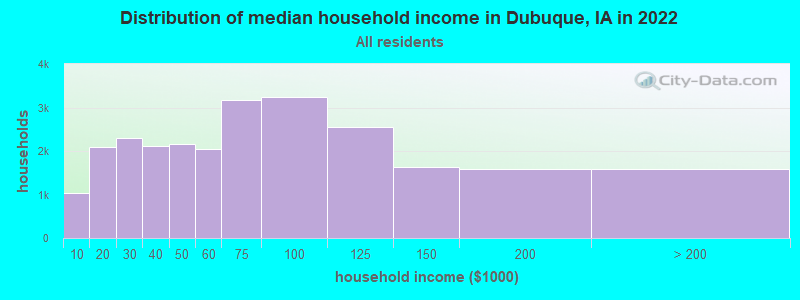
Dubuque, IA household income distribution 1,040 Less than $10,0002,088 $10,000 to $19,9992,301 $20,000 to $29,9992,124 $30,000 to $39,9992,152 $40,000 to $49,9992,039 $50,000 to $59,9993,177 $60,000 to $74,9993,232 $75,000 to $99,9992,548 $100,000 to $124,9991,625 $125,000 to $149,9991,590 $150,000 to $199,9991,580 $200,000 or more
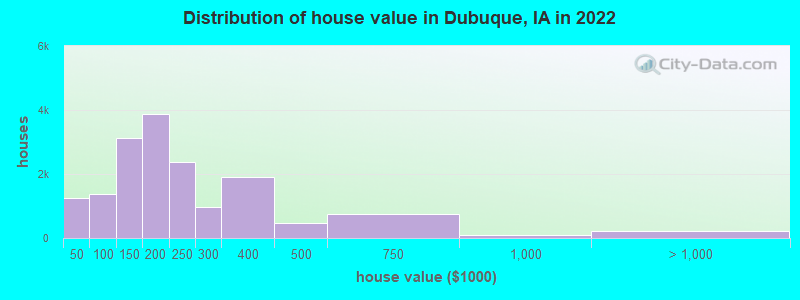
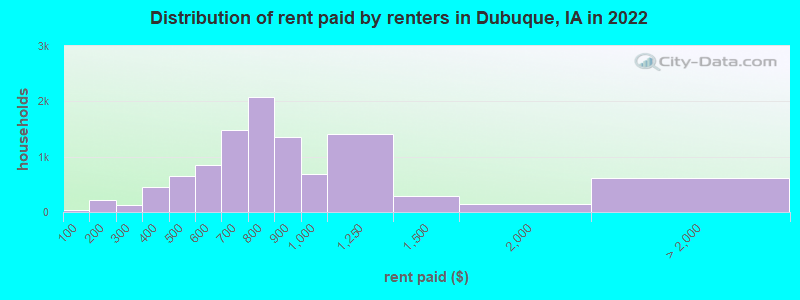
Home value of owner - occupied houses in 2022 in Dubuque, IA 224 Less than $10,00090 $10,000 to $14,99985 $15,000 to $19,999137 $20,000 to $24,99993 $25,000 to $29,999196 $30,000 to $34,999209 $35,000 to $39,999206 $40,000 to $49,999216 $50,000 to $59,999171 $60,000 to $69,99985 $70,000 to $79,999292 $80,000 to $89,999407 $90,000 to $99,9991,806 $100,000 to $124,9991,321 $125,000 to $149,9992,218 $150,000 to $174,9991,650 $175,000 to $199,9992,383 $200,000 to $249,999974 $250,000 to $299,9991,911 $300,000 to $399,999474 $400,000 to $499,999758 $500,000 to $749,999108 $750,000 to $999,999119 $1,000,000 to $1,499,99961 $1,500,000 to $1,999,99940 $2,000,000 or moreRent paid by renters in 2022 in Dubuque, IA 37 Less than $100120 $100 to $14987 $150 to $19950 $200 to $24979 $250 to $299409 $300 to $34941 $350 to $399340 $400 to $449308 $450 to $499532 $500 to $549321 $550 to $599963 $600 to $649519 $650 to $6991,055 $700 to $7491,017 $750 to $7991,357 $800 to $899692 $900 to $9991,414 $1,000 to $1,249282 $1,250 to $1,499150 $1,500 to $1,999190 $2,000 to $2,49919 $2,500 to $2,999129 $3,000 to $3,4998 $3,500 or more266 No cash rent
Percentage of workers working in this county: 93.3%Number of people working at home: 3,387 (11.1% of all workers )
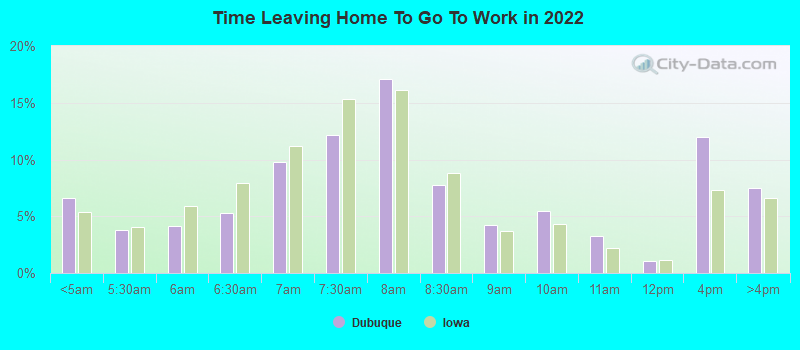
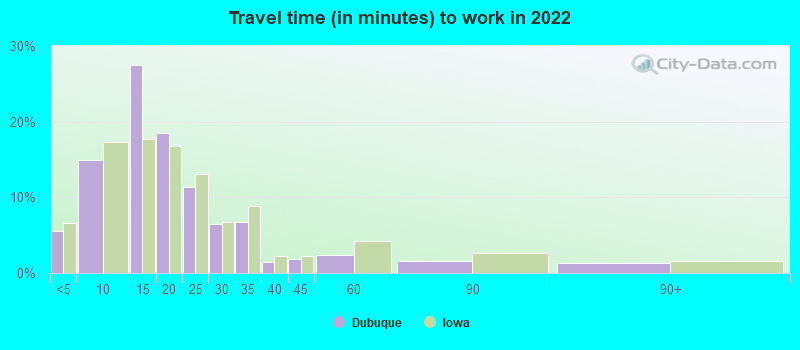
Travel time to work (commute)
Less than 5 minutes: 1,7485 to 9 minutes: 5,24410 to 14 minutes: 8,44015 to 19 minutes: 5,30020 to 24 minutes: 2,22025 to 29 minutes: 96530 to 34 minutes: 1,02435 to 39 minutes: 8640 to 44 minutes: 15245 to 59 minutes: 15160 to 89 minutes: 31990 or more minutes: 256
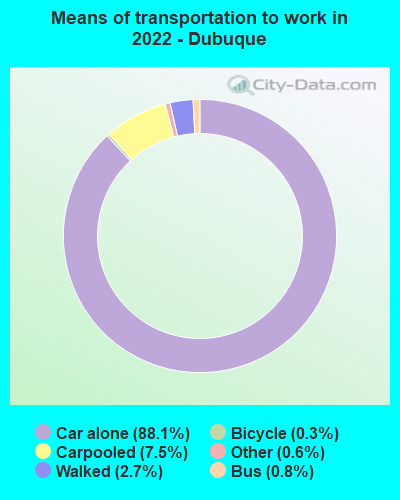
Means of transportation to work:
Drove a car alone: 32,844 (80.0%)Carpooled: 2,941 (7.2%)Bus : 295 (0.7%)Taxi: 219 (0.5%)Bicycle: 121 (0.3%)Walked: 1,024 (2.5%)Worked at home: 3,387 (8.2%)
Unemployment by race in 2022
Unemployment rate for White non-Hispanic residents 2.7% Males3.1% FemalesUnemployment rate for Black residents 34.6% Males20.6% FemalesUnemployment rate for American Indian and Alaska Native residents 35.0% FemalesUnemployment rate for Asian residents 2.0% FemalesUnemployment rate for two or more race residents 11.7% Males1.2% FemalesUnemployment rate for Hispanic or Latino residents 0.9% Females
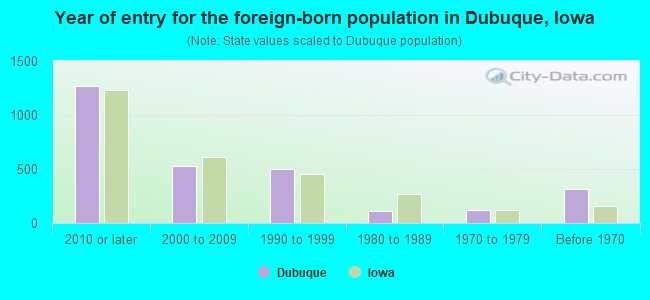
Year of entry for the foreign-born population in Dubuque, Iowa
1,268 2010 or later 525 2000 to 2009 503 1990 to 1999 108 1980 to 1989 120 1970 to 1979 315 Before 1970
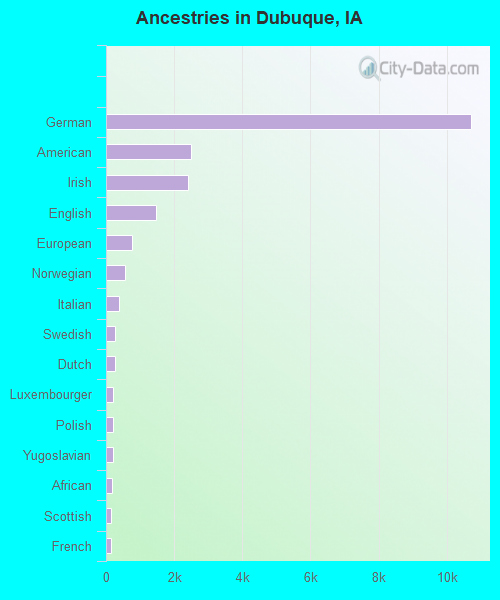
First ancestries reported:
German: 10,704 (40.1%)
American: 2,505 (9.4%)
Irish: 2,403 (9.0%)
English: 1,468 (5.5%)
European: 770 (2.9%)
Norwegian: 564 (2.1%)
Italian: 368 (1.4%)
Swedish: 277 (1.0%)
Dutch: 264 (1.0%)
Luxembourger: 219 (0.8%)
Polish: 207 (0.8%)
Yugoslavian: 197 (0.7%)
African: 186 (0.7%)
Scottish: 153 (0.6%)
French: 142 (0.5%)
Greek: 84 (0.3%)
Czech: 74 (0.3%)
French Canadian: 67 (0.3%)
Iranian: 60 (0.2%)
Swiss: 60 (0.2%)
Danish: 59 (0.2%)
Arab: 53 (0.2%)
Scandinavian: 49 (0.2%)
Scotch-Irish: 45 (0.2%)
Northern European: 43 (0.2%)
Welsh: 36 (0.1%)
Slovak: 25 (0.09%)
British: 23 (0.09%)
Belgian: 22 (0.08%)
Czechoslovakian: 21 (0.08%)
Russian: 18 (0.07%)
Haitian: 18 (0.07%)
Eastern European: 16 (0.06%)
Brazilian: 11 (0.04%)
Lithuanian: 11 (0.04%)
Lebanese: 10 (0.04%)
Ghanaian: 9 (0.03%)
Ukrainian: 9 (0.03%)
Romanian: 8 (0.03%)
Croatian: 8 (0.03%)
Iraqi: 7 (0.03%)
Austrian: 6 (0.02%)
Hungarian: 5 (0.02%)
Somali: 5 (0.02%)
German Russian: 4 (0.01%)
Egyptian: 4 (0.01%)
Slovene: 2 (0.01%)
Syrian: 2 (0.01%)
Nigerian: 2 (0.01%)
Most common places of birth for foreign-born residents (%): Marshall Islands Dubuque:
17.6% (425)Iowa:
0.4% (676)
Philippines Dubuque:
12.5% (302)Iowa:
2.6% (4,675)
Mexico Dubuque:
12.2% (296)Iowa:
23.3% (41,625)
Bosnia and Herzegovina Dubuque:
10.0% (241)Iowa:
3.2% (5,751)
China, excluding Hong Kong and Taiwan Dubuque:
7.7% (185)Iowa:
4.6% (8,194)
Guatemala Dubuque:
5.3% (128)Iowa:
3.2% (5,672)
Saudi Arabia Dubuque:
4.8% (116)Iowa:
0.2% (370)
Spain Dubuque:
2.4% (58)Iowa:
0.3% (603)
Other Southern Africa Dubuque:
2.0% (49)Iowa:
0.0% (88)
Vietnam Dubuque:
1.8% (44)Iowa:
4.2% (7,428)
Place of birth for U.S.-born residents:
This state: 39,680Other state: 16,333Northeast: 833Midwest: 11,356South: 1,720West: 2,439 86.2% of Dubuque residents lived in the same house 1 years ago.
Out of people who lived in different houses, 34.7% lived in this county.
Out of people who lived in different counties, 33.1% lived in Iowa.
Dubuque:
86.2%State average:
87.2%
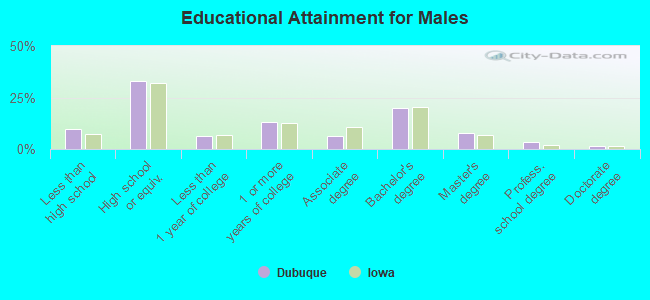
Education attainment for males 25 years and older:
No schooling: 452Nursery to 4th grade: 575th and 6th grade: 67th and 8th grade: 3329th grade: 7210th grade: 36211th grade: 38912th grade, no diploma: 232High school graduate (or equivalency): 6,603Less than 1 year of college: 1,243Some college more than 1 year, no degree: 2,599Associate degree: 1,242Bachelor's degree: 4,006Master's degree: 1,511Professional school degree: 675Doctorate degree: 278
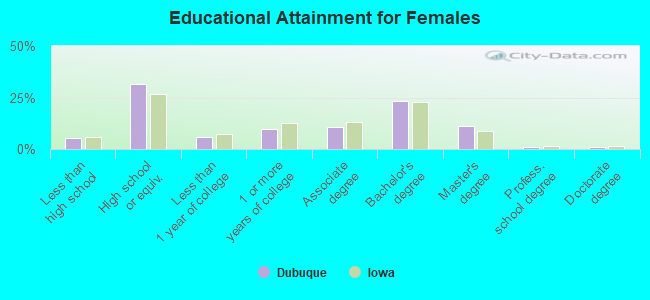
Education attainment for females 25 years and older:
No schooling: 104Nursery to 4th grade: 05th and 6th grade: 447th and 8th grade: 1209th grade: 9510th grade: 29111th grade: 33712th grade, no diploma: 151High school graduate (or equivalency): 6,571Less than 1 year of college: 1,216Some college more than 1 year, no degree: 2,033Associate degree: 2,217Bachelor's degree: 4,813Master's degree: 2,357Professional school degree: 180Doctorate degree: 227
Housing units in structures:
One, detached: 17,187One, attached: 1,129Two: 1,4053 or 4: 1,8535 to 9: 1,40310 to 19: 1,20720 to 49: 1,32450 or more: 1,282Mobile homes: 963Median worth of mobile homes: $27,403
Housing units lacking complete plumbing facilities in 2022: 1.8%Housing units lacking complete kitchen facilities in 2022: 3.4%House/condo owner moved in on average 12 years ago
Renter moved in on average 1 years ago
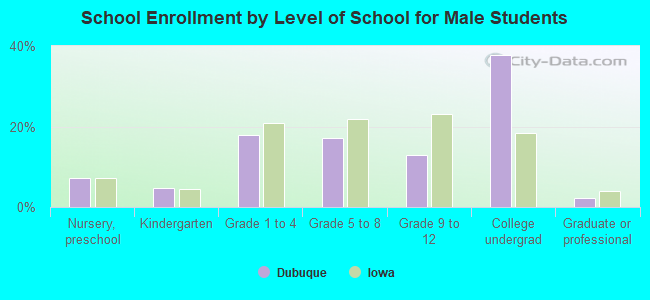
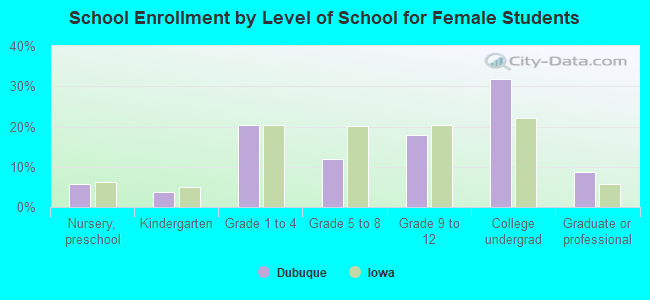
Private vs. public school enrollment:
Students in private schools in grades 1 to 8 (elementary and middle school): 842 Students in private schools in grades 9 to 12 (high school): 231 Students in private undergraduate colleges: 3,644