Decatur, IL (Illinois) Houses and Residents
| Decatur: | $92,200 |
| Illinois: | $251,600 |
Mean price in 2022:
Detached houses: $120,303
Here: $120,303 State: $310,164 Townhouses or other attached units: $178,353
Here: $178,353 State: $286,230 In 2-unit structures: $51,007
Here: $51,007 State: $299,638 In 3-to-4-unit structures: $44,728
Here: $44,728 State: $330,907 In 5-or-more-unit structures: $120,247
Here: $120,247 State: $318,887 Mobile homes: $22,334
Here: $22,334 State: $78,855
Total population: 74,010 (All urban)
Houses: 35,995 (31,106 occupied: 20,909 owner occupied, 10,197 renter occupied)
| % of renters here: | 33% |
| State: | 33% |
Housing density: 866 houses/condos per square mile
Median price asked for vacant for-sale houses and condos in 2022: $36,642.
Median contract rent in 2022: $566 (lower quartile is $434, upper quartile is $717)
Median rent asked for vacant for-rent units in 2022: $513
Median gross rent in Decatur, IL in 2022: $776
Housing units in Decatur with a mortgage: 11,510 (517 second mortgage, 0 home equity loan, 317 both second mortgage and home equity loan)
Houses without a mortgage: 238
Median household income for houses/condos with a mortgage: $72,689
Median household income for apartments without a mortgage: $49,735
Median monthly housing costs: $781
Compare current foreclosures in Decatur, IL:
| Photo | Address | Area | Beds / Baths | Price | Details |
|---|---|---|---|---|---|

|
#1
W Mark Ave
Decatur, IL 62526
|
1,781 sq. feet
|
2 baths 3 beds |
$195,000
|
show details |

|
#2
S Glencoe Ave
Decatur, IL 62522
|
880 sq. feet
|
1 baths 4 beds |
show details | |

|
#3
N 26th St
Decatur, IL 62521
|
848 sq. feet
|
1 baths 2 beds |
show details | |

|
#4
N Graceland Ave
Decatur, IL 62526
|
1,400 sq. feet
|
3 baths 3 beds |
show details | |

|
#5
E Winnetka Ave
Decatur, IL 62526
|
1,248 sq. feet
|
2 baths - beds |
show details | |

|
#6
S Richmond Rd
Decatur, IL 62521
|
925 sq. feet
|
1 baths - beds |
show details | |

|
#7
N Taylor Ave
Decatur, IL 62526
|
936 sq. feet
|
1 baths - beds |
show details | |

|
#8
N Florian Ave
Decatur, IL 62526
|
1,064 sq. feet
|
2 baths - beds |
show details | |

|
#9
S Haworth Ave
Decatur, IL 62522
|
- sq. feet
|
1 baths 3 beds |
show details | |

|
#10
W Waggoner St
Decatur, IL 62526
|
912 sq. feet
|
1 baths - beds |
show details |
| Photo | Address | Area | Beds / Baths | Price | Details |
|---|---|---|---|---|---|

|
#11
N Northbrook Dr
Decatur, IL 62526
|
1,400 sq. feet
|
3 baths - beds |
show details | |

|
#12
S Franklin Street Rd
Decatur, IL 62521
|
1,040 sq. feet
|
1 baths - beds |
show details | |

|
#13
N Pine St
Decatur, IL 62522
|
928 sq. feet
|
1 baths - beds |
show details | |

|
#14
W Evandale Dr
Decatur, IL 62526
|
- sq. feet
|
2 baths 3 beds |
show details | |

|
#15
N Jasper St
Decatur, IL 62526
|
780 sq. feet
|
1 baths - beds |
show details | |

|
#16
N Meadowlark Dr
Decatur, IL 62526
|
994 sq. feet
|
2 baths - beds |
show details | |

|
#17
S Stevens Ave
Decatur, IL 62522
|
- sq. feet
|
2 baths 6 beds |
show details | |

|
#18
N University Ave
Decatur, IL 62526
|
- sq. feet
|
1 baths 3 beds |
show details | |

|
#19
N Oakland Ave
Decatur, IL 62522
|
1,008 sq. feet
|
1 baths - beds |
show details | |

|
#20
W Olive St
Decatur, IL 62526
|
- sq. feet
|
- baths - beds |
show details |
| Photo | Address | Area | Beds / Baths | Price | Details |
|---|---|---|---|---|---|

|
#21
E Lincoln Ave
Decatur, IL 62521
|
- sq. feet
|
- baths - beds |
show details | |

|
#22
N Church St
Decatur, IL 62526
|
- sq. feet
|
- baths - beds |
show details | |

|
#23
W Cerro Gordo St
Decatur, IL 62522
|
- sq. feet
|
- baths - beds |
show details | |

|
#24
Hummingbird Dr
Decatur, IL 62526
|
- sq. feet
|
- baths - beds |
show details | |

|
#25
E William St
Decatur, IL 62521
|
- sq. feet
|
- baths - beds |
show details | |

|
#26
N Main C1
Decatur, IL 62523
|
- sq. feet
|
- baths - beds |
show details | |

|
#27
N 35th St
Decatur, IL 62521
|
- sq. feet
|
- baths - beds |
show details | |

|
#28
N Woodford St
Decatur, IL 62526
|
- sq. feet
|
- baths - beds |
show details | |

|
#29
N Fairlawn Ave
Decatur, IL 62522
|
- sq. feet
|
- baths - beds |
show details | |

|
#30
N Fairlawn Ave
Decatur, IL 62522
|
- sq. feet
|
- baths - beds |
show details |
| Photo | Address | Area | Beds / Baths | Price | Details |
|---|---|---|---|---|---|

|
#31
E Main St
Decatur, IL 62521
|
- sq. feet
|
- baths - beds |
show details | |

|
#32
E Pearl St
Decatur, IL 62521
|
- sq. feet
|
- baths - beds |
show details | |

|
#33
N Dennis Ave
Decatur, IL 62526
|
- sq. feet
|
- baths - beds |
show details | |

|
#34
5th Dr
Decatur, IL 62521
|
- sq. feet
|
- baths - beds |
show details | |

|
#35
N Union St
Decatur, IL 62526
|
- sq. feet
|
- baths - beds |
show details | |

|
#36
N Monroe St
Decatur, IL 62522
|
- sq. feet
|
- baths - beds |
show details | |

|
#37
W Marietta St
Decatur, IL 62521
|
- sq. feet
|
- baths - beds |
show details | |

|
#38
N Walnut Grove Ave
Decatur, IL 62526
|
- sq. feet
|
- baths - beds |
show details | |

|
#39
W Grand Ave
Decatur, IL 62522
|
- sq. feet
|
- baths - beds |
show details | |

|
#40
N Union St
Decatur, IL 62522
|
- sq. feet
|
- baths - beds |
show details |
| Photo | Address | Area | Beds / Baths | Price | Details |
|---|---|---|---|---|---|

|
#41
N Warren St
Decatur, IL 62526
|
- sq. feet
|
- baths - beds |
show details | |

|
#42
W King St
Decatur, IL 62522
|
- sq. feet
|
- baths - beds |
show details | |

|
#43
N College St
Decatur, IL 62526
|
- sq. feet
|
- baths - beds |
show details | |

|
#44
N Edward St
Decatur, IL 62522
|
- sq. feet
|
- baths - beds |
show details | |

|
#45
E Walnut St
Decatur, IL 62526
|
- sq. feet
|
- baths - beds |
show details | |

|
#46
S Haworth Ave
Decatur, IL 62522
|
- sq. feet
|
- baths - beds |
show details | |

|
#47
E Johnson Ave
Decatur, IL 62526
|
- sq. feet
|
- baths - beds |
show details | |

|
#48
W Packard St
Decatur, IL 62521
|
- sq. feet
|
- baths - beds |
show details | |

|
#49
W Green St
Decatur, IL 62522
|
- sq. feet
|
- baths - beds |
show details | |

|
Check over 1 million property listings on Foreclosure.com!
|
browse all offers | |||

Latest news about housing in Decatur, IL collected exclusively by city-data.com from local newspapers, TV, and radio stations

 | Apartments around Decatur? (4 replies) |
| If Chicago was removed, would Illinois be a red or purple state? (44 replies) |
| Apartments in the Decatur Area? (1 reply) |
| Moving to Illinois...literally anywhere but Chicago or it’s suburbs (52 replies) |
| Even the suburban residents are fleeing Illinois.. (294 replies) |
| Tell me about Peoria (14 replies) |

Median year apartment built: 1962
Household type by relationship:
Households: 70,396- Male householders: 13,734 (5,454 living alone), Female householders: 17,372 (7,682 living alone)
10,916 spouses (10,916 opposite-sex spouses), 2,781 unmarried partners, (2,673 opposite-sex unmarried partners), 19,092 children (17,754 natural, 88 adopted, 1,250 stepchildren), 1,097 grandchildren, 338 brothers or sisters, 481 parents, 264 foster children, 145 other relatives, 1,347 non-relatives
- In group quarters: 2,829
Size of family households: 8,731 2-persons, 3,059 3-persons, 1,943 4-persons, 1,555 5-persons, 913 6-persons, 46 7-or-more-persons.
Size of nonfamily households: 13,136 1-person, 1,477 2-persons, 89 3-persons, 103 4-persons, 54 5-persons.
7,770 married couples with children.
6,623 single-parent households (1,318 men, 5,305 women).
95.0% of residents of Decatur speak English at home.
2.4% of residents speak Spanish at home (83% speak English very well, 7% speak English well, 6% speak English not well, 4% don't speak English at all).
0.9% of residents speak other Indo-European language at home (92% speak English very well, 7% speak English well, 1% speak English not well).
0.8% of residents speak Asian or Pacific Island language at home (56% speak English very well, 29% speak English well, 12% speak English not well, 3% don't speak English at all).
0.5% of residents speak other language at home (95% speak English very well, 5% speak English well).
Foreign born population: 1,645 (2.3%)
(23.2% of them are naturalized citizens)
| Here: | 6.1 |
| State: | 6.4 |
| Here: | 4.2 |
| State: | 4.1 |

- Bedrooms in owner-occupied houses and condos in Decatur, Illinois
- 0no bedroom
- 7431 bedroom
- 5,3442 bedrooms
- 10,8223 bedrooms
- 2,8744 bedrooms
- 1,1265+ bedrooms

- Bedrooms in renter-occupied apartments in Decatur, Illinois
- 426no bedroom
- 2,8501 bedroom
- 4,5362 bedrooms
- 2,2113 bedrooms
- 1744 bedrooms
- 05+ bedrooms

- Cars and other vehicles available in Decatur in owner-occupied houses/condos
- 365no vehicle
- 7,7741 vehicle
- 9,3852 vehicles
- 2,2263 vehicles
- 9684 vehicles
- 1915+ vehicles

- Cars and other vehicles available in Decatur in renter-occupied apartments
- 2,276no vehicle
- 5,7121 vehicle
- 1,8202 vehicles
- 1693 vehicles
- 1414 vehicles
- 795+ vehicles

- Rooms in owner-occupied houses in Decatur, Illinois
- 01 room
- 1432 rooms
- 4673 rooms
- 2,4424 rooms
- 4,6195 rooms
- 4,4136 rooms
- 2,8887 rooms
- 3,1388 rooms
- 2,7999+ rooms

- Rooms in renter-occupied apartments in Decatur, Illinois
- 4261 room
- 4822 rooms
- 2,6923 rooms
- 2,2614 rooms
- 2,9275 rooms
- 7246 rooms
- 4417 rooms
- 1758 rooms
- 699+ rooms


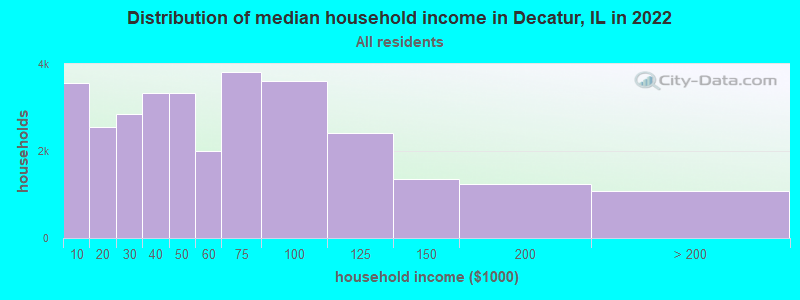
Decatur, IL household income distribution

- 3,562Less than $10,000
- 2,556$10,000 to $19,999
- 2,856$20,000 to $29,999
- 3,328$30,000 to $39,999
- 3,324$40,000 to $49,999
- 1,991$50,000 to $59,999
- 3,809$60,000 to $74,999
- 3,609$75,000 to $99,999
- 2,404$100,000 to $124,999
- 1,348$125,000 to $149,999
- 1,250$150,000 to $199,999
- 1,069$200,000 or more
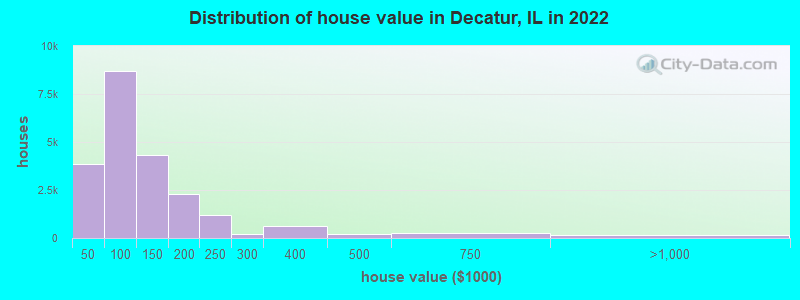
Home value of owner - occupied houses in 2022 in Decatur, IL
-
- 331Less than $10,000
- 582$10,000 to $14,999
- 311$15,000 to $19,999
- 234$20,000 to $24,999
- 333$25,000 to $29,999
- 651$30,000 to $34,999
- 475$35,000 to $39,999
- 938$40,000 to $49,999
- 468$50,000 to $59,999
- 1,542$60,000 to $69,999
- 2,022$70,000 to $79,999
- 2,232$80,000 to $89,999
- 1,518$90,000 to $99,999
- 2,473$100,000 to $124,999
- 1,841$125,000 to $149,999
- 1,228$150,000 to $174,999
- 1,089$175,000 to $199,999
- 1,214$200,000 to $249,999
- 184$250,000 to $299,999
- 624$300,000 to $399,999
- 190$400,000 to $499,999
- 250$500,000 to $749,999
- 138$750,000 to $999,999
- 41$2,000,000 or more
Rent paid by renters in 2022 in Decatur, IL
-
- 62Less than $100
- 88$100 to $149
- 274$150 to $199
- 542$200 to $249
- 34$250 to $299
- 305$300 to $349
- 763$350 to $399
- 617$400 to $449
- 639$450 to $499
- 1,238$500 to $549
- 1,268$550 to $599
- 579$600 to $649
- 956$650 to $699
- 286$700 to $749
- 679$750 to $799
- 789$800 to $899
- 114$900 to $999
- 419$1,000 to $1,249
- 182$1,250 to $1,499
- 40$1,500 to $1,999
- 73$3,500 or more
- 250No cash rent


Percentage of workers working in this county: 92.7%
Number of people working at home: 2,419 (8.2% of all workers)
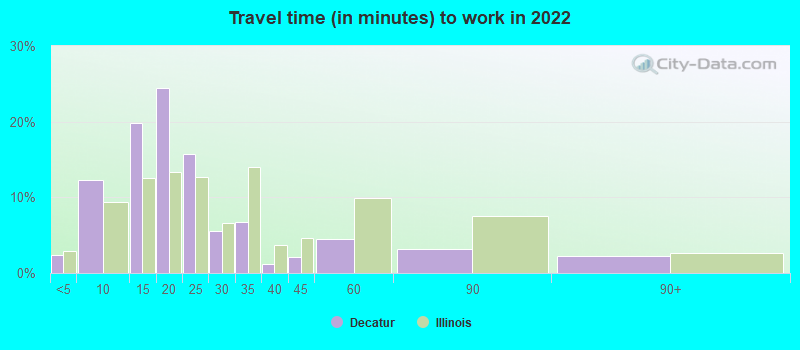
Travel time to work (commute)
- Less than 5 minutes: 802
- 5 to 9 minutes: 3,919
- 10 to 14 minutes: 6,579
- 15 to 19 minutes: 7,091
- 20 to 24 minutes: 4,123
- 25 to 29 minutes: 1,018
- 30 to 34 minutes: 1,251
- 35 to 39 minutes: 180
- 40 to 44 minutes: 405
- 45 to 59 minutes: 870
- 60 to 89 minutes: 408
- 90 or more minutes: 247
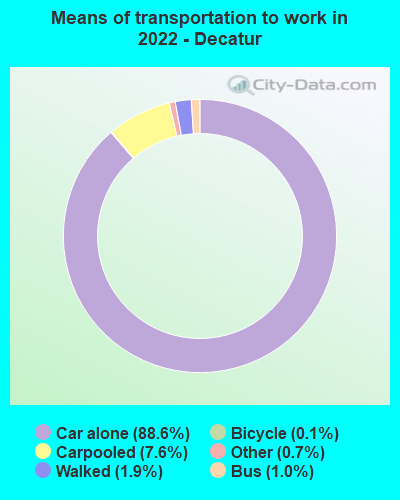
Means of transportation to work:
- Drove a car alone: 32,081 (81.4%)
- Carpooled: 2,945 (7.5%)
- Bus: 329 (0.8%)
- Light rail, streetcar or trolley: 2 (0.0%)
- Taxi: 284 (0.7%)
- Bicycle: 48 (0.1%)
- Walked: 715 (1.8%)
- Worked at home: 2,419 (6.1%)

- Unemployment by race in 2022
- Unemployment rate for White non-Hispanic residents
- 5.4%Males
- 4.4%Females
- Unemployment rate for Black residents
- 16.4%Males
- 11.6%Females
- Unemployment rate for American Indian and Alaska Native residents
- 100.0%Males
- Unemployment rate for Asian residents
- 7.5%Males
- 2.3%Females
- Unemployment rate for other race residents
- 3.6%Males
- 28.9%Females
- Unemployment rate for two or more race residents
- 18.8%Males
- 4.9%Females
- Unemployment rate for Hispanic or Latino residents
- 8.2%Males
- 10.1%Females

- Year of entry for the foreign-born population in Decatur, Illinois
- 8642010 or later
- 3202000 to 2009
- 3091990 to 1999
- 2281980 to 1989
- 1641970 to 1979
- 411Before 1970

First ancestries reported:
- German: 4,333 (12.8%)
- American: 4,031 (11.9%)
- English: 3,587 (10.6%)
- Irish: 1,859 (5.5%)
- European: 474 (1.4%)
- Italian: 428 (1.3%)
- Scottish: 376 (1.1%)
- African: 353 (1.0%)
- Polish: 298 (0.9%)
- French: 262 (0.8%)
- Scotch-Irish: 212 (0.6%)
- Dutch: 188 (0.6%)
- British: 123 (0.4%)
- Norwegian: 123 (0.4%)
- Nigerian: 114 (0.3%)
- Greek: 79 (0.2%)
- Zimbabwean: 75 (0.2%)
- Eastern European: 66 (0.2%)
- Lebanese: 63 (0.2%)
- Swedish: 60 (0.2%)
- Swiss: 41 (0.1%)
- Welsh: 41 (0.1%)
- Arab: 38 (0.1%)
- Austrian: 32 (0.09%)
- Portuguese: 32 (0.09%)
- Ukrainian: 31 (0.09%)
- Czech: 30 (0.09%)
- Albanian: 25 (0.07%)
- Belgian: 21 (0.06%)
- Hungarian: 20 (0.06%)
- Latvian: 18 (0.05%)
- Somali: 18 (0.05%)
- Scandinavian: 14 (0.04%)
- Serbian: 14 (0.04%)
- Pennsylvania German: 13 (0.04%)
- Northern European: 12 (0.04%)
- French Canadian: 12 (0.04%)
- Canadian: 11 (0.03%)
- Russian: 10 (0.03%)
- Czechoslovakian: 9 (0.03%)
- Croatian: 9 (0.03%)
- New Zealander: 8 (0.02%)
- Danish: 8 (0.02%)
- Turkish: 4 (0.01%)
Most common places of birth for foreign-born residents (%):
| Decatur: | 25.1% (484) |
| Illinois: | 34.7% (626,958) |
| Decatur: | 10.1% (196) |
| Illinois: | 5.2% (93,003) |
| Decatur: | 9.4% (182) |
| Illinois: | 9.2% (166,409) |
| Decatur: | 7.8% (151) |
| Illinois: | 1.2% (21,186) |
| Decatur: | 5.0% (97) |
| Illinois: | 0.1% (1,913) |
| Decatur: | 4.7% (91) |
| Illinois: | 4.1% (74,364) |
| Decatur: | 3.4% (66) |
| Illinois: | 1.6% (29,519) |
| Decatur: | 3.3% (63) |
| Illinois: | 1.1% (19,306) |
| Decatur: | 2.7% (52) |
| Illinois: | 0.1% (982) |
| Decatur: | 2.6% (51) |
| Illinois: | 0.0% (494) |
| Decatur: | 2.4% (46) |
| Illinois: | 0.9% (16,553) |
| Decatur: | 2.3% (44) |
| Illinois: | 1.0% (18,753) |
| Decatur: | 2.1% (41) |
| Illinois: | 0.5% (9,688) |
| Decatur: | 1.8% (35) |
| Illinois: | 1.2% (22,269) |
| Decatur: | 1.6% (31) |
| Illinois: | 0.1% (2,269) |
| Decatur: | 1.6% (30) |
| Illinois: | 0.4% (7,117) |
Place of birth for U.S.-born residents:
- This state: 55,020
- Other state: 13,505
- Northeast: 345
- Midwest: 4,495
- South: 6,861
- West: 1,804
84.2% of Decatur residents lived in the same house 1 years ago.
Out of people who lived in different houses, 44.9% lived in this county.
Out of people who lived in different counties, 63.1% lived in Illinois.
| Decatur: | 84.2% |
| State average: | 88.3% |
Education attainment for males 25 years and older:
- No schooling: 92
- Nursery to 4th grade: 0
- 5th and 6th grade: 53
- 7th and 8th grade: 278
- 9th grade: 52
- 10th grade: 286
- 11th grade: 253
- 12th grade, no diploma: 517
- High school graduate (or equivalency): 10,003
- Less than 1 year of college: 1,937
- Some college more than 1 year, no degree: 2,621
- Associate degree: 1,539
- Bachelor's degree: 3,139
- Master's degree: 1,065
- Professional school degree: 240
- Doctorate degree: 83

Education attainment for females 25 years and older:
- No schooling: 98
- Nursery to 4th grade: 0
- 5th and 6th grade: 0
- 7th and 8th grade: 102
- 9th grade: 103
- 10th grade: 125
- 11th grade: 268
- 12th grade, no diploma: 153
- High school graduate (or equivalency): 10,756
- Less than 1 year of college: 1,543
- Some college more than 1 year, no degree: 3,301
- Associate degree: 2,904
- Bachelor's degree: 4,053
- Master's degree: 1,725
- Professional school degree: 0
- Doctorate degree: 107


Housing units in structures:
- One, detached: 28,027
- One, attached: 437
- Two: 250
- 3 or 4: 1,032
- 5 to 9: 1,298
- 10 to 19: 2,059
- 20 to 49: 958
- 50 or more: 1,230
- Mobile homes: 704
Median worth of mobile homes: $9,999
Housing units lacking complete kitchen facilities in 2022: 4.8%
House/condo owner moved in on average 13 years ago
Renter moved in on average 2 years ago

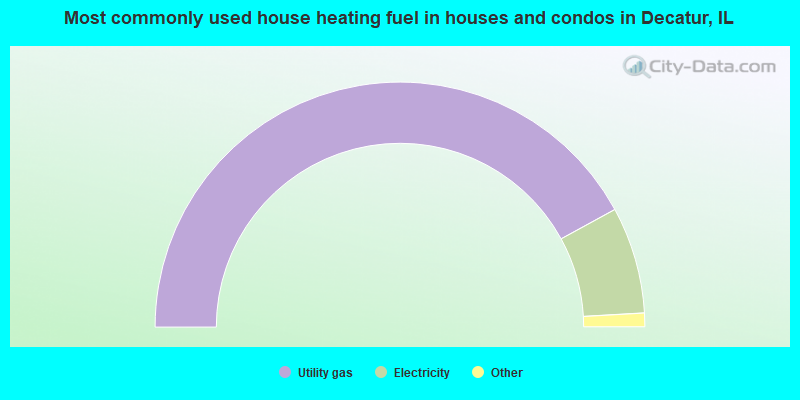
- 84.1%Utility gas
- 14.1%Electricity
- 1.0%Bottled, tank, or LP gas
- 0.3%Other fuel
- 0.2%Wood
- 0.1%Coal or coke
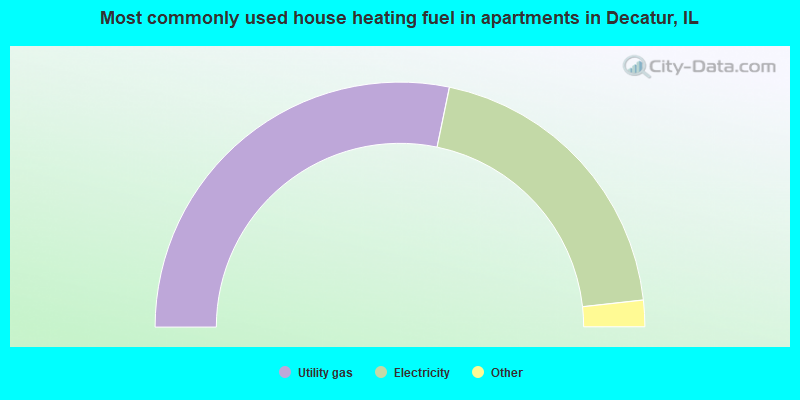
- 56.5%Utility gas
- 40.0%Electricity
- 1.9%No fuel used
- 1.1%Bottled, tank, or LP gas
- 0.5%Other fuel
Private vs. public school enrollment:
| Here: | 11.1% |
| Illinois: | 13.3% |
| Here: | 9.9% |
| Illinois: | 9.9% |
| Here: | 59.9% |
| Illinois: | 27.4% |


