Crystal City, TX (Texas) Houses and Residents
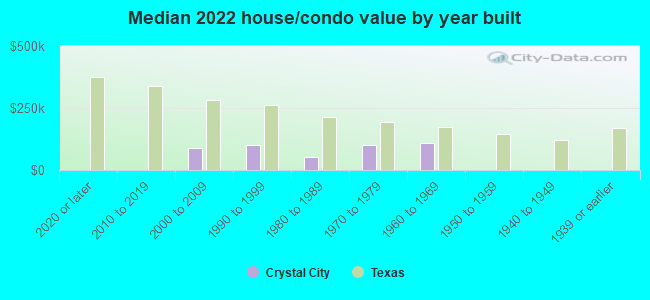
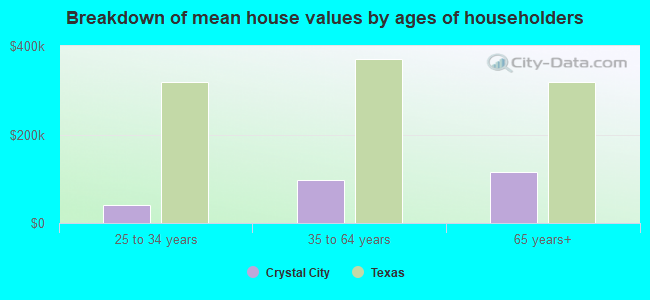
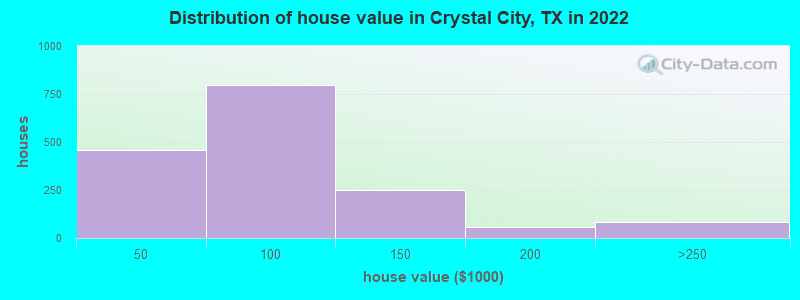
Estimated median house or condo value in 2022: $89,563 (it was $26,800 in 2000 )
Crystal City:
$89,563Texas:
$275,400
Lower value quartile - upper value quartile: $54,754 - $126,393Total population: 7,513 (Urban population: 6,687 (all inside urban clusters), Rural population: 351 (all nonfarm) )
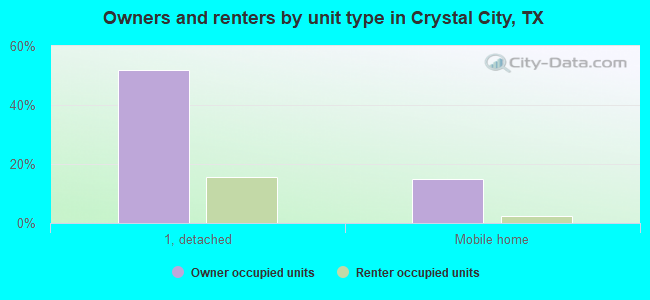
Houses: 2,756 (2,463 occupied: 1,711 owner occupied, 789 renter occupied )
% of renters here:
32%State:
38%
Housing density: 757 houses/condos per square mile
Median price asked for vacant for-sale houses and condos in 2022 in this state: $336,800.
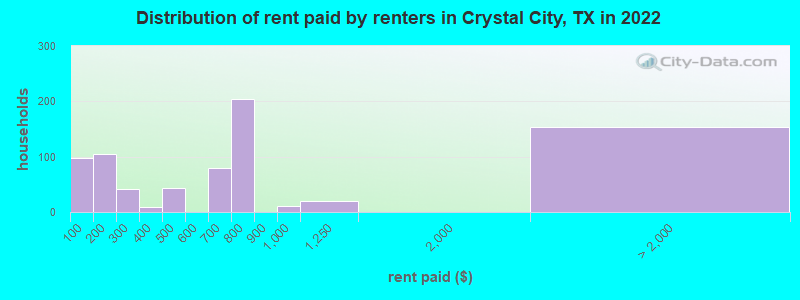
Median contract rent in 2022: $625 (lower quartile is $165, upper quartile is $749)
Median rent asked for vacant for-rent units in 2022: $819
Median gross rent in Crystal City, TX in 2022: $831
Housing units in Crystal City with a mortgage: 409 (0 second mortgage, 0 home equity loan, 0 both second mortgage and home equity loan )Houses without a mortgage: 68
Median household income for houses/condos with a mortgage: $48,123
Median household income for apartments without a mortgage: $52,376
Median monthly housing costs: $562
Data:
Median house or condo value ($)
Median house or condo value ($ change since 2000)
Median house or condo value ($) - White
Median house or condo value ($) - Black or African American
Median house or condo value ($) - Asian
Median house or condo value ($) - Hispanic or Latino
Median house or condo value ($) - American Indian and Alaska Native
Median house or condo value ($) - Multirace
Median house or condo value ($) - Other Race
Median price asked for mobile homes ($)
Household density (households per square mile)
Mean house or condo value by units in structure - 1, detached ($)
Mean house or condo value by units in structure - 1, attached ($)
Mean house or condo value by units in structure - 2 ($)
Mean house or condo value by units in structure by units in structure - 3 or 4 ($)
Mean house or condo value by units in structure - 5 or more ($)
Mean house or condo value by units in structure - Boat, RV, van, etc. ($)
Mean house or condo value by units in structure - Mobile home ($)
Median contract rent ($)
Median contract rent - Lower quartile ($)
Median contract rent - Upper quartile ($)
Median gross rent ($)
Urban houses (%)
Rural houses (%)
Houses occupied (%)
Houses occupied (% change since 2000)
Houses owner occupied (%)
Houses owner occupied (% change since 2000)
Houses renter occupied (%)
Houses renter occupied (% change since 2000)
Vacant housing units - For rent (%)
Vacant housing units - For rent (% change since 2000)
Vacant housing units - For sale only (%)
Vacant housing units - For sale only (% change since 2000)
Vacant housing units - Rented or sold, not occupied (%)
Vacant housing units - Rented or sold, not occupied (% change since 2000)
Vacant housing units - For seasonal, recreational, or occasional use (%)
Vacant housing units - For seasonal, recreational, or occasional use (% change since 2000)
Vacant housing units - For migrant workers (%)
Vacant housing units - For migrant workers (% change since 2000)
Vacant housing units - Other vacant (%)
Vacant housing units - Other vacant (% change since 2000)
Median monthly housing costs ($)
Median household income for houses/condos with a mortgage ($)
Median household income for houses/condos without a mortgage ($)
Median household income ($)
Median household income ($) - White
Median household income ($) - Black or African American
Median household income ($) - Asian
Median household income ($) - Hispanic or Latino
Median household income ($) - American Indian and Alaska Native
Median household income ($) - Multirace
Median household income ($) - Other Race
Mortgage status - with mortgage (%)
Mortgage status - with second mortgage (%)
Mortgage status - with home equity loan (%)
Mortgage status - with both second mortgage and home equity loan (%)
Mortgage status - without a mortgage (%)
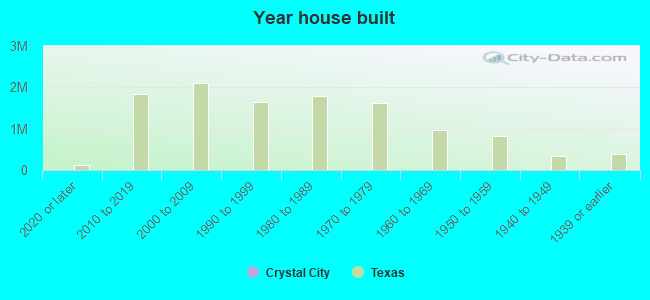
Median year house/condo built
Median year apartment built
Household type by relationship - Male householder living alone (%)
Household type by relationship - Male householder not living alone (%)
Household type by relationship - Female householder living alone (%)
Household type by relationship - Female householder not living alone (%)
Household type by relationship - Opposite-Sex spouse (%)
Household type by relationship - Same-Sex spouse (%)
Household type by relationship - Opposite-Sex unmarried partner (%)
Household type by relationship - Same-Sex unmarried partner (%)
Household type by relationship - In group quarters (%)
Size of family households - 2-person household (%)
Size of family households - 3-person household (%)
Size of family households - 4-person household (%)
Size of family households - 5-person household (%)
Size of family households - 6-person household (%)
Size of family households - 7-or-more-person household (%)
Size of nonfamily households - 1-person household (%)
Size of nonfamily households - 2-person household (%)
Size of nonfamily households - 3-person household (%)
Size of nonfamily households - 4-person household (%)
Size of nonfamily households - 5-person household (%)
Size of nonfamily households - 6-person household (%)
Size of nonfamily households - 7-or-moreperson household (%)
Year house built - Built 2010 or later (%)
Year house built - Built 2000 to 2009 (%)
Year house built - Built 1990 to 1999 (%)
Year house built - Built 1980 to 1989 (%)
Year house built - Built 1970 to 1979 (%)
Year house built - Built 1960 to 1969 (%)
Year house built - Built 1950 to 1959 (%)
Year house built - Built 1940 to 1949 (%)
Year house built - Built 1939 or earlier (%)
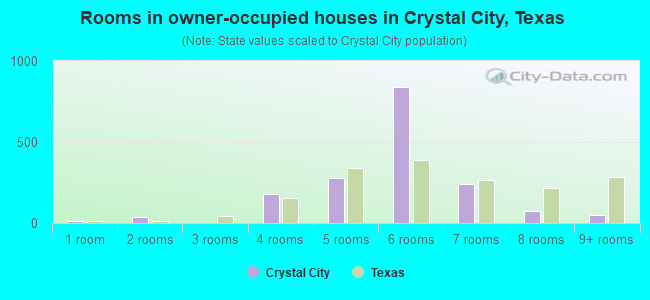
Median number of rooms in houses and condos
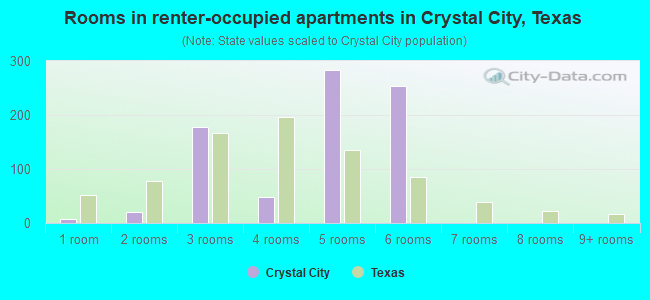
Median number of rooms in apartments
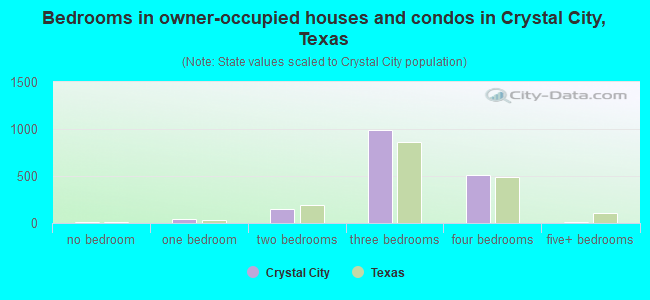
Median number of bedrooms in owner occupied houses
Mean number of bedrooms in owner occupied houses
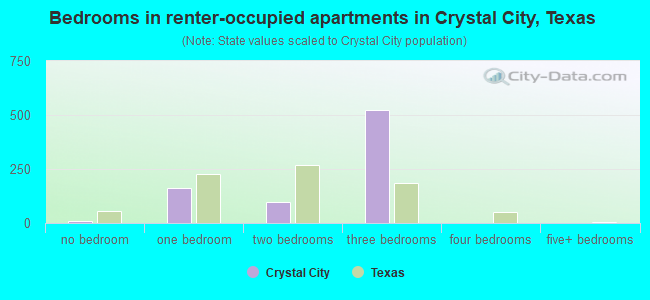
Median number of bedrooms in renter occupied houses
Mean number of bedrooms in renter occupied houses
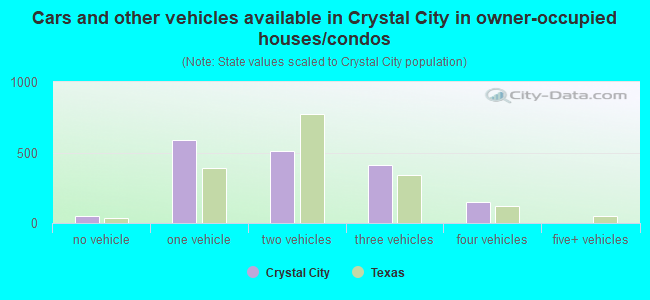
Median number of vehichles in owner occupied houses
Mean number of vehichles in owner occupied houses
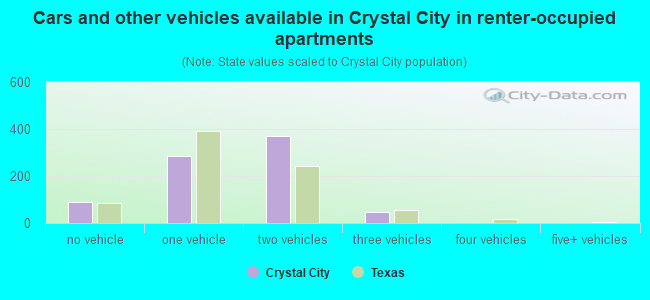
Median number of vehichles in renter occupied houses
Mean number of vehichles in renter occupied houses
Rooms in owner-occupied houses - 1 room (%)
Rooms in owner-occupied houses - 2 rooms (%)
Rooms in owner-occupied houses - 3 rooms (%)
Rooms in owner-occupied houses - 4 rooms (%)
Rooms in owner-occupied houses - 5 rooms (%)
Rooms in owner-occupied houses - 6 rooms (%)
Rooms in owner-occupied houses - 7 rooms (%)
Rooms in owner-occupied houses - 8 rooms (%)
Rooms in owner-occupied houses - 9+ rooms (%)
Rooms in renter-occupied houses - 1 room (%)
Rooms in renter-occupied houses - 2 rooms (%)
Rooms in renter-occupied houses - 3 rooms (%)
Rooms in renter-occupied houses - 4 rooms (%)
Rooms in renter-occupied houses - 5 rooms (%)
Rooms in renter-occupied houses - 6 rooms (%)
Rooms in renter-occupied houses - 7 rooms (%)
Rooms in renter-occupied houses - 8 rooms (%)
Rooms in renter-occupied houses - 9+ rooms (%)
Bedrooms in owner-occupied houses - no bedrooms (%)
Bedrooms in owner-occupied houses - 1 bedroom (%)
Bedrooms in owner-occupied houses - 2 bedrooms (%)
Bedrooms in owner-occupied houses - 3 bedrooms (%)
Bedrooms in owner-occupied houses - 4 bedrooms (%)
Bedrooms in owner-occupied houses - 5+ bedrooms (%)
Bedrooms in renter-occupied houses - no bedrooms (%)
Bedrooms in renter-occupied houses - 1 bedroom (%)
Bedrooms in renter-occupied houses - 2 bedrooms (%)
Bedrooms in renter-occupied houses - 3 bedrooms (%)
Bedrooms in renter-occupied houses - 4 bedrooms (%)
Bedrooms in renter-occupied houses - 5+ bedrooms (%)
Vehicles available in owner-occupied houses - no vehicle available (%)
Vehicles available in owner-occupied houses - 1 vehicle available(%)
Vehicles available in owner-occupied houses - 2 Vehicles available (%)
Vehicles available in owner-occupied houses - 3 Vehicles available (%)
Vehicles available in owner-occupied houses - 4 Vehicles available (%)
Vehicles available in owner-occupied houses - 5+ Vehicles available (%)
Vehicles available in renter-occupied houses - no vehicle available (%)
Vehicles available in renter-occupied houses - 1 vehicle available (%)
Vehicles available in renter-occupied houses - 2 Vehicles available (%)
Vehicles available in renter-occupied houses - 3 Vehicles available (%)
Vehicles available in renter-occupied houses - 4 Vehicles available (%)
Vehicles available in renter-occupied houses - 5+ Vehicles available (%)
Housing units in structures - 1, detached (%)
Housing units in structures - 1, attached (%)
Housing units in structures - 2 (%)
Housing units in structures - 3 or 4 (%)
Housing units in structures - 5 to 9 (%)
Housing units in structures - 10 to 19 (%)
Housing units in structures - 20 to 49 (%)
Housing units in structures - 50 or more (%)
Housing units in structures - Mobile home (%)
Housing units in structures - Boat, RV, van, etc. (%)
Housing units in structures - Owners - 1, detached (%)
Housing units in structures - Owners - 1, attached (%)
Housing units in structures - Owners - 2 (%)
Housing units in structures - Owners - 3 or 4 (%)
Housing units in structures - Owners - 5 to 9 (%)
Housing units in structures - Owners - 10 to 19 (%)
Housing units in structures - Owners - 20 to 49 (%)
Housing units in structures - Owners - 50 or more (%)
Housing units in structures - Owners - Mobile home (%)
Housing units in structures - Owners - Boat, RV, van, etc. (%)
Housing units in structures - Renters - 1, detached (%)
Housing units in structures - Renters - 1, attached (%)
Housing units in structures - Renters - 2 (%)
Housing units in structures - Renters - 3 or 4 (%)
Housing units in structures - Renters - 5 to 9 (%)
Housing units in structures - Renters - 10 to 19 (%)
Housing units in structures - Renters - 20 to 49 (%)
Housing units in structures - Renters - 50 or more (%)
Housing units in structures - Renters - Mobile home (%)
Housing units in structures - Renters - Boat, RV, van, etc. (%)
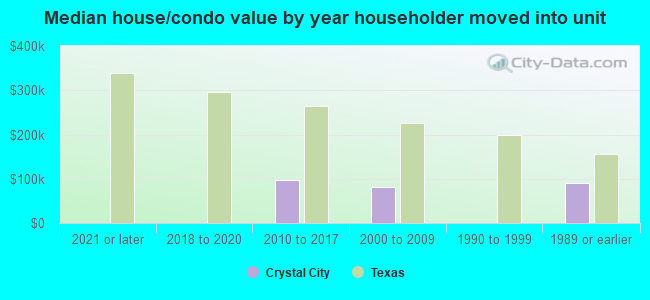
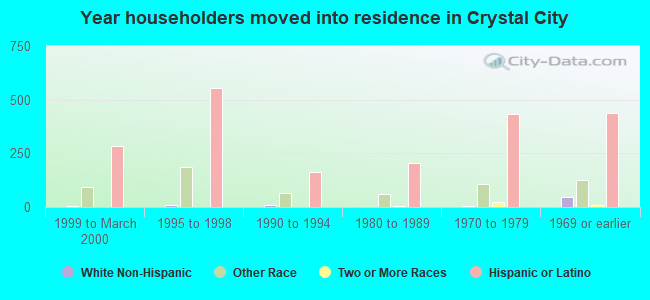
House/condo owner moved in on average (years ago)
Renter moved in on average (years ago)
Year householder moved into unit - Moved in 1999 to March 2000 (%)
Year householder moved into unit - Moved in 1999 to March 2000 (%) - White
Year householder moved into unit - Moved in 1999 to March 2000 (%) - Black or African American
Year householder moved into unit - Moved in 1999 to March 2000 (%) - Asian
Year householder moved into unit - Moved in 1999 to March 2000 (%) - Hispanic or Latino
Year householder moved into unit - Moved in 1999 to March 2000 (%) - American Indian and Alaska Native
Year householder moved into unit - Moved in 1999 to March 2000 (%) - Multirace
Year householder moved into unit - Moved in 1999 to March 2000 (%) - Other Race
Year householder moved into unit - Moved in 1995 to 1998 (%)
Year householder moved into unit - Moved in 1995 to 1998 (%) - White
Year householder moved into unit - Moved in 1995 to 1998 (%) - Black or African American
Year householder moved into unit - Moved in 1995 to 1998 (%) - Asian
Year householder moved into unit - Moved in 1995 to 1998 (%) - Hispanic or Latino
Year householder moved into unit - Moved in 1995 to 1998 (%) - American Indian and Alaska Native
Year householder moved into unit - Moved in 1995 to 1998 (%) - Multirace
Year householder moved into unit - Moved in 1995 to 1998 (%) - Other Race
Year householder moved into unit - Moved in 1990 to 1994 (%)
Year householder moved into unit - Moved in 1990 to 1994 (%) - White
Year householder moved into unit - Moved in 1990 to 1994 (%) - Black or African American
Year householder moved into unit - Moved in 1990 to 1994 (%) - Asian
Year householder moved into unit - Moved in 1990 to 1994 (%) - Hispanic or Latino
Year householder moved into unit - Moved in 1990 to 1994 (%) - American Indian and Alaska Native
Year householder moved into unit - Moved in 1990 to 1994 (%) - Multirace
Year householder moved into unit - Moved in 1990 to 1994 (%) - Other Race
Year householder moved into unit - Moved in 1980 to 1989 (%)
Year householder moved into unit - Moved in 1980 to 1989 (%) - White
Year householder moved into unit - Moved in 1980 to 1989 (%) - Black or African American
Year householder moved into unit - Moved in 1980 to 1989 (%) - Asian
Year householder moved into unit - Moved in 1980 to 1989 (%) - Hispanic or Latino
Year householder moved into unit - Moved in 1980 to 1989 (%) - American Indian and Alaska Native
Year householder moved into unit - Moved in 1980 to 1989 (%) - Multirace
Year householder moved into unit - Moved in 1980 to 1989 (%) - Other Race
Year householder moved into unit - Moved in 1970 to 1979 (%)
Year householder moved into unit - Moved in 1970 to 1979 (%) - White
Year householder moved into unit - Moved in 1970 to 1979 (%) - Black or African American
Year householder moved into unit - Moved in 1970 to 1979 (%) - Asian
Year householder moved into unit - Moved in 1970 to 1979 (%) - Hispanic or Latino
Year householder moved into unit - Moved in 1970 to 1979 (%) - American Indian and Alaska Native
Year householder moved into unit - Moved in 1970 to 1979 (%) - Multirace
Year householder moved into unit - Moved in 1970 to 1979 (%) - Other Race
Year householder moved into unit - Moved in 1969 or earlier (%)
Year householder moved into unit - Moved in 1969 or earlier (%) - White
Year householder moved into unit - Moved in 1969 or earlier (%) - Black or African American
Year householder moved into unit - Moved in 1969 or earlier (%) - Asian
Year householder moved into unit - Moved in 1969 or earlier (%) - Hispanic or Latino
Year householder moved into unit - Moved in 1969 or earlier (%) - American Indian and Alaska Native
Year householder moved into unit - Moved in 1969 or earlier (%) - Multirace
Year householder moved into unit - Moved in 1969 or earlier (%) - Other Race
Housing units lacking complete plumbing facilities (%)
Housing units lacking complete kitchen facilities (%)
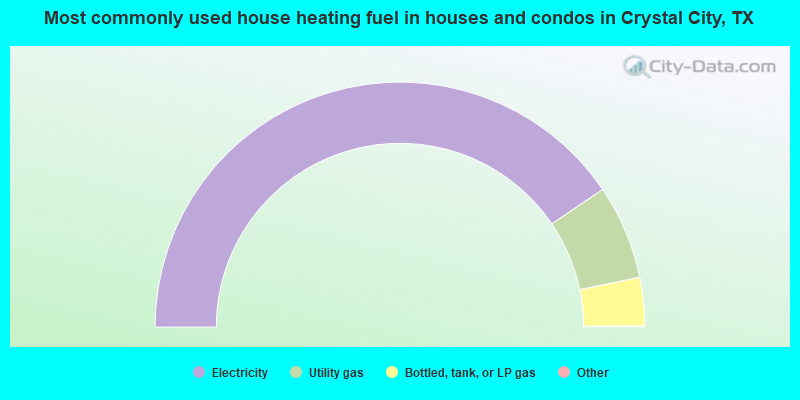
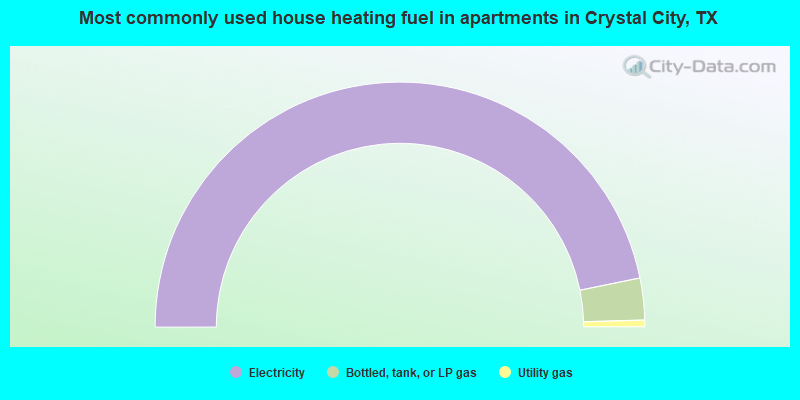
House heating fuel used in houses and condos - Utility gas (%)
House heating fuel used in houses and condos - Bottled, tank, or LP gas (%)
House heating fuel used in houses and condos - Electricity (%)
House heating fuel used in houses and condos - Fuel oil, kerosene, etc. (%)
House heating fuel used in houses and condos - Coal or coke (%)
House heating fuel used in houses and condos - Wood (%)
House heating fuel used in houses and condos - Solar energy (%)
House heating fuel used in houses and condos - Other fuel (%)
House heating fuel used in houses and condos - No fuel used (%)
House heating fuel used in apartments - Utility gas (%)
House heating fuel used in apartments - Bottled, tank, or LP gas (%)
House heating fuel used in apartments - Electricity (%)
House heating fuel used in apartments - Fuel oil, kerosene, etc. (%)
House heating fuel used in apartments - Coal or coke (%)
House heating fuel used in apartments - Wood (%)
House heating fuel used in apartments - Solar energy (%)
House heating fuel used in apartments - Other fuel (%)
House heating fuel used in apartments - No fuel used (%)
Median year house/condo built: 1975Median year apartment built: 1961Household type by relationship:
Households: 6,502
Male householders: 1,343 (271 living alone ), Female householders: 1,086 (167 living alone )904 spouses (904 opposite-sex spouses ), 326 unmarried partners , (326 opposite-sex unmarried partners ), 2,029 children (1,943 natural , 0 adopted , 85 stepchildren ), 230 grandchildren , 269 brothers or sisters , 126 parents , 0 foster children , 106 other relatives , 25 non-relatives In group quarters: 54
Size of family households: 670 2-persons , 712 3-persons , 274 4-persons , 308 5-persons , 6 6-persons , 19 7-or-more-persons .
Size of nonfamily households: 462 1-person , 35 2-persons .
315 married couples with children. single-parent households (117 men , 933 women ).
27.3% of residents of Crystal City speak English at home. of residents speak Spanish at home (76% speak English very well , 18% speak English well , 6% speak English not well ).
Foreign born population: 434 (6.7%)of them are naturalized citizens )
Median number of rooms in houses and condos:
Median number of rooms in apartments
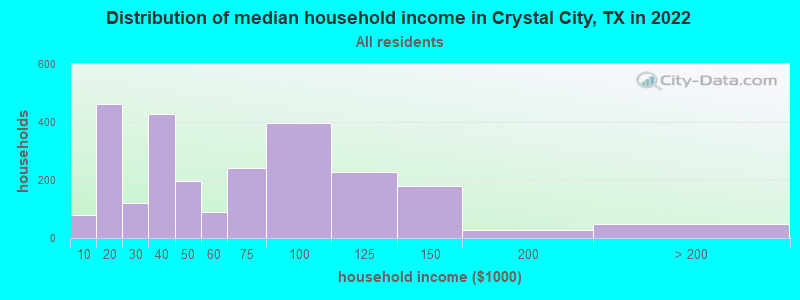
Crystal City, TX household income distribution 79 Less than $10,000463 $10,000 to $19,999122 $20,000 to $29,999426 $30,000 to $39,999195 $40,000 to $49,99988 $50,000 to $59,999242 $60,000 to $74,999396 $75,000 to $99,999229 $100,000 to $124,999179 $125,000 to $149,99929 $150,000 to $199,99950 $200,000 or more
Home value of owner - occupied houses in 2022 in Crystal City, TX 24 $10,000 to $14,99988 $15,000 to $19,99912 $20,000 to $24,99939 $30,000 to $34,99931 $35,000 to $39,999259 $40,000 to $49,999115 $50,000 to $59,999188 $70,000 to $79,999167 $80,000 to $89,99966 $90,000 to $99,999137 $100,000 to $124,999112 $125,000 to $149,99917 $150,000 to $174,99940 $175,000 to $199,99975 $200,000 to $249,9995 $400,000 to $499,999Rent paid by renters in 2022 in Crystal City, TX 97 Less than $10033 $100 to $14971 $150 to $19941 $200 to $2499 $350 to $39944 $400 to $44965 $600 to $64913 $650 to $699203 $700 to $74910 $900 to $99919 $1,000 to $1,249153 No cash rent
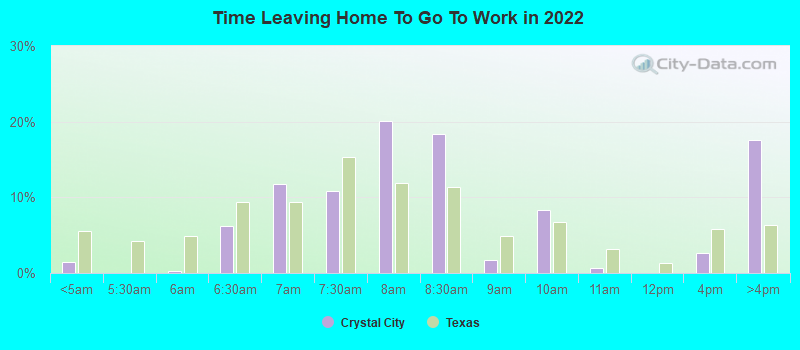
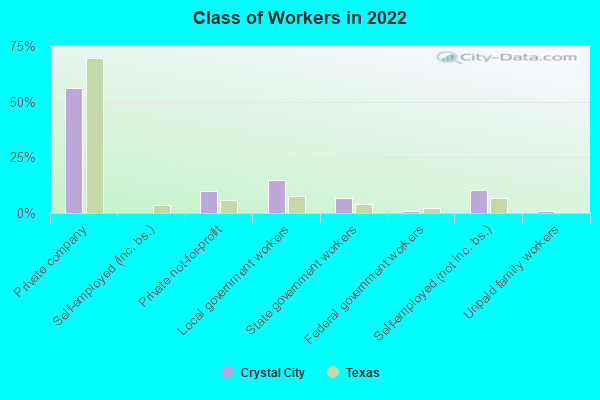
Percentage of workers working in this county: 59.3%Number of people working at home: 83 (3.1% of all workers )
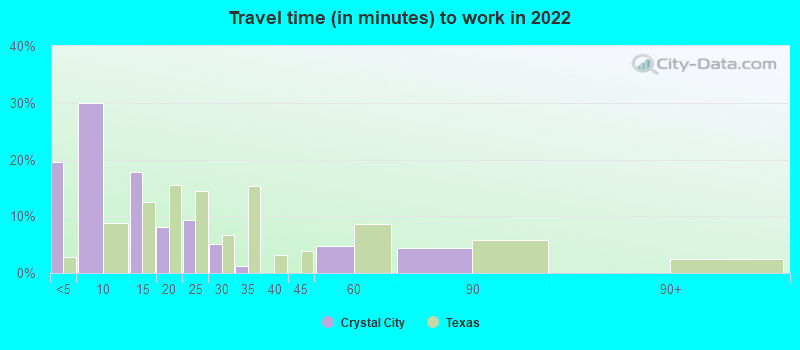
Travel time to work (commute)
Less than 5 minutes: 4135 to 9 minutes: 55410 to 14 minutes: 43415 to 19 minutes: 39320 to 24 minutes: 20925 to 29 minutes: 25630 to 34 minutes: 3235 to 39 minutes: 040 to 44 minutes: 045 to 59 minutes: 7860 to 89 minutes: 11090 or more minutes: 18
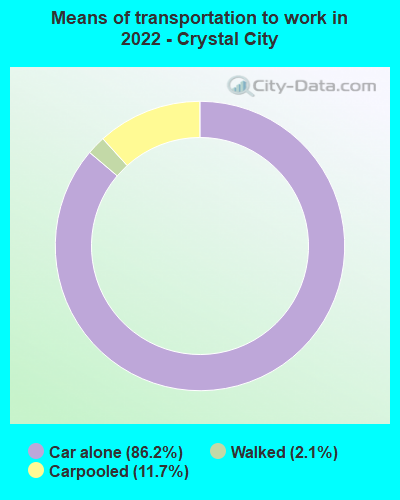
Means of transportation to work:
Drove a car alone: 1,366 (78.7%)Carpooled: 202 (11.6%)Walked: 35 (2.0%)Worked at home: 83 (4.8%)
Unemployment by race in 2022
Unemployment rate for two or more race residents 15.0% FemalesUnemployment rate for Hispanic or Latino residents 1.9% Males7.0% Females
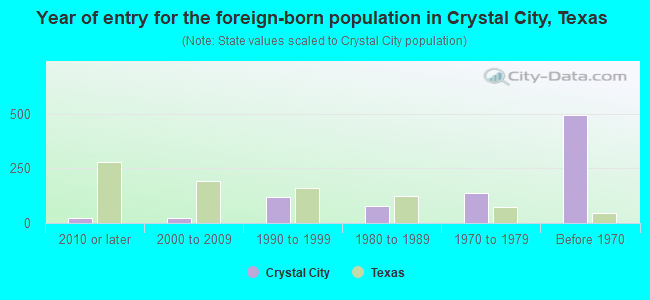
Year of entry for the foreign-born population in Crystal City, Texas
25 2010 or later 23 2000 to 2009 121 1990 to 1999 77 1980 to 1989 137 1970 to 1979 494 Before 1970
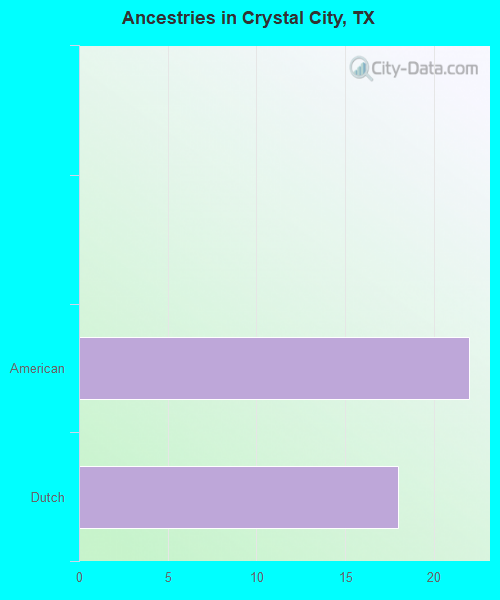
First ancestries reported:
American: 22 (0.4%)
Dutch: 18 (0.3%) Most common places of birth for foreign-born residents (%): Mexico Crystal City:
83.2% (361)Texas:
48.4% (2,411,723)
South Africa Crystal City:
9.0% (39)Texas:
0.2% (11,402)
Netherlands Crystal City:
4.6% (20)Texas:
0.1% (5,793)
Chile Crystal City:
2.3% (10)Texas:
0.1% (7,230)
Place of birth for U.S.-born residents:
This state: 5,436Other state: 498Northeast: 0Midwest: 333South: 98West: 61 98.1% of Crystal City residents lived in the same house 1 years ago.
Out of people who lived in different houses, 45.3% lived in this county.
Out of people who lived in different counties, 100.0% lived in Texas.
Crystal City:
98.1%State average:
85.7%
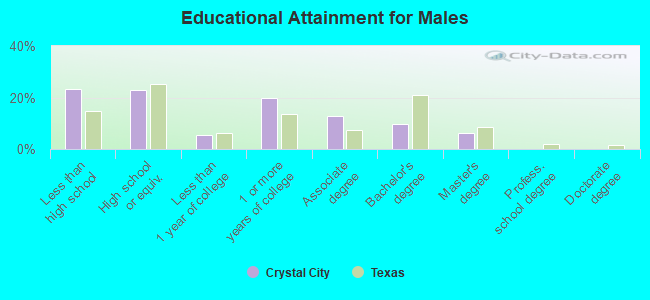
Education attainment for males 25 years and older:
No schooling: 17Nursery to 4th grade: 135th and 6th grade: 1117th and 8th grade: 1369th grade: 810th grade: 4411th grade: 7012th grade, no diploma: 86High school graduate (or equivalency): 476Less than 1 year of college: 112Some college more than 1 year, no degree: 411Associate degree: 266Bachelor's degree: 198Master's degree: 125Professional school degree: 0Doctorate degree: 0
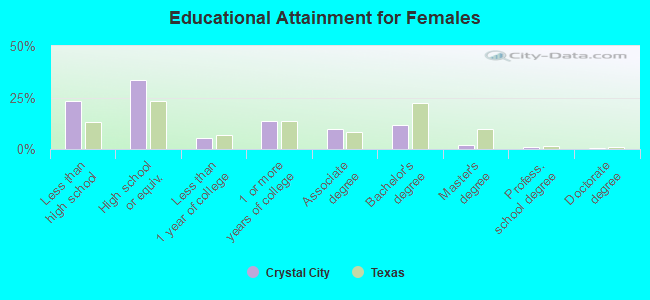
Education attainment for females 25 years and older:
No schooling: 88Nursery to 4th grade: 755th and 6th grade: 907th and 8th grade: 429th grade: 6310th grade: 8111th grade: 012th grade, no diploma: 6High school graduate (or equivalency): 640Less than 1 year of college: 99Some college more than 1 year, no degree: 264Associate degree: 187Bachelor's degree: 226Master's degree: 34Professional school degree: 16Doctorate degree: 11
Housing units in structures:
One, detached: 1,819One, attached: 66Two: 1953 or 4: 1305 to 9: 1810 to 19: 19Mobile homes: 506Median worth of mobile homes: $53,875
Housing units lacking complete plumbing facilities in 2022: 2.7%Housing units lacking complete kitchen facilities in 2022: 2.9%House/condo owner moved in on average 23 years ago
Renter moved in on average 6 years ago
Private vs. public school enrollment:
Students in private schools in grades 1 to 8 (elementary and middle school): 80 Students in private schools in grades 9 to 12 (high school): 0 Students in private undergraduate colleges: 0