Crescent City, CA (California) Houses and Residents
| Crescent City: | $305,449 |
| California: | $715,900 |
Total population: 6,786 (Urban population: 3,861 (all inside urban clusters), Rural population: 27 (all nonfarm))
Houses: 2,298 (2,057 occupied: 754 owner occupied, 1,310 renter occupied)
| % of renters here: | 63% |
| State: | 44% |
Housing density: 1,292 houses/condos per square mile
Median price asked for vacant for-sale houses and condos in 2022 in this county: $333,531.
Median contract rent in 2022: $944 (lower quartile is $761, upper quartile is $1,173)
Median rent asked for vacant for-rent units in 2022: $1,293
Median gross rent in Crescent City, CA in 2022: $1,130
Housing units in Crescent City with a mortgage: 345 (19 second mortgage, 0 home equity loan, 20 both second mortgage and home equity loan)
Houses without a mortgage: 0
Median household income for houses/condos with a mortgage: $70,223
Median household income for apartments without a mortgage: $41,103
Median monthly housing costs: $994
Compare current foreclosures in Crescent City, CA:
| Photo | Address | Area | Beds / Baths | Price | Details |
|---|---|---|---|---|---|

|
#1
Kings Valley Rd
Crescent City, CA 95531
|
- sq. feet
|
2 baths 5 beds |
$314,900
|
show details |

|
#2
Railroad Ave
Crescent City, CA 95531
|
- sq. feet
|
- baths - beds |
show details | |

|
#3
Northcrest Dr Spc 33
Crescent City, CA 95531
|
- sq. feet
|
- baths - beds |
show details | |

|
#4
Childs Ave
Crescent City, CA 95531
|
- sq. feet
|
- baths - beds |
show details | |

|
#5
Iowa Ave
Crescent City, CA 95531
|
- sq. feet
|
- baths - beds |
show details | |

|
#6
Union St
Crescent City, CA 95531
|
- sq. feet
|
- baths - beds |
show details | |

|
#7
Iowa Ave
Crescent City, CA 95531
|
- sq. feet
|
- baths - beds |
show details | |

|
#8
Minnesota Ave
Crescent City, CA 95531
|
- sq. feet
|
- baths - beds |
show details | |

|
#9
Minnesota Ave
Crescent City, CA 95531
|
- sq. feet
|
- baths - beds |
show details | |

|
#10
Iowa Ave
Crescent City, CA 95531
|
- sq. feet
|
- baths - beds |
show details |
| Photo | Address | Area | Beds / Baths | Price | Details |
|---|---|---|---|---|---|

|
#11
Minnesota Ave
Crescent City, CA 95531
|
- sq. feet
|
- baths - beds |
show details | |

|
#12
Union St
Crescent City, CA 95531
|
- sq. feet
|
- baths - beds |
show details | |

|
#13
Union St
Crescent City, CA 95531
|
- sq. feet
|
- baths - beds |
show details | |

|
#14
Union St
Crescent City, CA 95531
|
- sq. feet
|
- baths - beds |
show details | |

|
#15
Minnesota Ave
Crescent City, CA 95531
|
- sq. feet
|
- baths - beds |
show details | |

|
#16
National Park Way
Crescent City, CA 95531
|
- sq. feet
|
- baths - beds |
show details | |

|
#17
Congress St
Crescent City, CA 95531
|
- sq. feet
|
- baths - beds |
show details | |

|
#18
Union St
Crescent City, CA 95531
|
- sq. feet
|
- baths - beds |
show details | |

|
#19
Holben Rd
Crescent City, CA 95531
|
- sq. feet
|
- baths - beds |
show details | |

|
#20
C St
Crescent City, CA 95531
|
- sq. feet
|
- baths - beds |
show details |
| Photo | Address | Area | Beds / Baths | Price | Details |
|---|---|---|---|---|---|

|
#21
Inyo Ct
Crescent City, CA 95531
|
- sq. feet
|
- baths - beds |
show details | |

|
#22
M St
Crescent City, CA 95531
|
- sq. feet
|
- baths - beds |
show details | |

|
#23
Dream St
Crescent City, CA 95531
|
- sq. feet
|
- baths - beds |
show details | |

|
#24
Michigan Rd
Crescent City, CA 95531
|
- sq. feet
|
- baths - beds |
show details | |

|
#25
Skycrest Dr
Crescent City, CA 95531
|
- sq. feet
|
- baths - beds |
show details | |

|
#26
Minnesota Ave
Crescent City, CA 95531
|
- sq. feet
|
- baths - beds |
show details | |

|
#27
Dakota St
Crescent City, CA 95531
|
- sq. feet
|
- baths - beds |
show details | |

|
#28
Minnesota Ave
Crescent City, CA 95531
|
- sq. feet
|
- baths - beds |
show details | |

|
#29
National Blvd
Crescent City, CA 95531
|
- sq. feet
|
- baths - beds |
show details | |

|
#30
National Blvd
Crescent City, CA 95531
|
- sq. feet
|
- baths - beds |
show details |
| Photo | Address | Area | Beds / Baths | Price | Details |
|---|---|---|---|---|---|

|
#31
Union St
Crescent City, CA 95531
|
- sq. feet
|
- baths - beds |
show details | |

|
#32
Dakota St
Crescent City, CA 95531
|
- sq. feet
|
- baths - beds |
show details | |

|
#33
Dakota St
Crescent City, CA 95531
|
- sq. feet
|
- baths - beds |
show details | |

|
#34
Eau Claire Ave
Crescent City, CA 95531
|
- sq. feet
|
- baths - beds |
show details | |

|
#35
Chicago Ave
Crescent City, CA 95531
|
- sq. feet
|
- baths - beds |
show details | |

|
#36
Minnesota Ave
Crescent City, CA 95531
|
- sq. feet
|
- baths - beds |
show details | |

|
#37
National Park Way
Crescent City, CA 95531
|
- sq. feet
|
- baths - beds |
show details | |

|
#38
Dakota Ave
Crescent City, CA 95531
|
- sq. feet
|
- baths - beds |
show details | |

|
#39
Chicago Ave
Crescent City, CA 95531
|
- sq. feet
|
- baths - beds |
show details | |

|
#40
Iowa Ave
Crescent City, CA 95531
|
- sq. feet
|
- baths - beds |
show details |
| Photo | Address | Area | Beds / Baths | Price | Details |
|---|---|---|---|---|---|

|
#41
Union St
Crescent City, CA 95531
|
- sq. feet
|
- baths - beds |
show details | |

|
#42
Union St
Crescent City, CA 95531
|
- sq. feet
|
- baths - beds |
show details | |

|
#43
Wisconsin Ave
Crescent City, CA 95531
|
- sq. feet
|
- baths - beds |
show details | |

|
#44
National Park Way
Crescent City, CA 95531
|
- sq. feet
|
- baths - beds |
show details | |

|
#45
Broad St
Crescent City, CA 95531
|
- sq. feet
|
- baths - beds |
show details | |

|
#46
Claire Ave
Crescent City, CA 95531
|
- sq. feet
|
- baths - beds |
show details | |

|
#47
Union St
Crescent City, CA 95531
|
- sq. feet
|
- baths - beds |
show details | |

|
#48
Union St
Crescent City, CA 95531
|
- sq. feet
|
- baths - beds |
show details | |

|
#49
Dakota Ave
Crescent City, CA 95531
|
- sq. feet
|
- baths - beds |
show details | |

|
Check over 1 million property listings on Foreclosure.com!
|
browse all offers | |||


Median year apartment built: 1979
Household type by relationship:
Households: 6,326- Male householders: 887 (317 living alone), Female householders: 1,124 (537 living alone)
495 spouses (495 opposite-sex spouses), 250 unmarried partners, (234 opposite-sex unmarried partners), 1,094 children (1,010 natural, 31 adopted, 52 stepchildren), 121 grandchildren, 7 brothers or sisters, 100 parents, 0 foster children, 82 other relatives, 24 non-relatives
- In group quarters: 2,135
Size of family households: 522 2-persons, 219 3-persons, 175 4-persons, 78 5-persons, 33 6-persons, 13 7-or-more-persons.
Size of nonfamily households: 894 1-person, 142 2-persons.
339 married couples with children.
334 single-parent households (126 men, 208 women).
86.6% of residents of Crescent City speak English at home.
8.0% of residents speak Spanish at home (54% speak English very well, 21% speak English well, 24% speak English not well, 2% don't speak English at all).
2.4% of residents speak other Indo-European language at home (45% speak English very well, 35% speak English well, 20% speak English not well).
1.7% of residents speak Asian or Pacific Island language at home (25% speak English very well, 58% speak English well, 10% speak English not well, 8% don't speak English at all).
0.2% of residents speak other language at home (100% speak English very well).
Foreign born population: 645 (10.2%)
(44.7% of them are naturalized citizens)
| Here: | 5.5 |
| State: | 6.0 |
| Here: | 4.0 |
| State: | 3.9 |

- Bedrooms in owner-occupied houses and condos in Crescent City, California
- 0no bedroom
- 71 bedroom
- 1892 bedrooms
- 4483 bedrooms
- 1104 bedrooms
- 05+ bedrooms

- Bedrooms in renter-occupied apartments in Crescent City, California
- 58no bedroom
- 3551 bedroom
- 5812 bedrooms
- 2963 bedrooms
- 84 bedrooms
- 125+ bedrooms

- Cars and other vehicles available in Crescent City in owner-occupied houses/condos
- 13no vehicle
- 3551 vehicle
- 2642 vehicles
- 783 vehicles
- 444 vehicles
- 05+ vehicles

- Cars and other vehicles available in Crescent City in renter-occupied apartments
- 402no vehicle
- 6201 vehicle
- 1972 vehicles
- 323 vehicles
- 04 vehicles
- 605+ vehicles

- Rooms in owner-occupied houses in Crescent City, California
- 01 room
- 02 rooms
- 03 rooms
- 1044 rooms
- 2715 rooms
- 1956 rooms
- 837 rooms
- 378 rooms
- 649+ rooms

- Rooms in renter-occupied apartments in Crescent City, California
- 581 room
- 712 rooms
- 3593 rooms
- 3394 rooms
- 1245 rooms
- 2726 rooms
- 257 rooms
- 118 rooms
- 519+ rooms


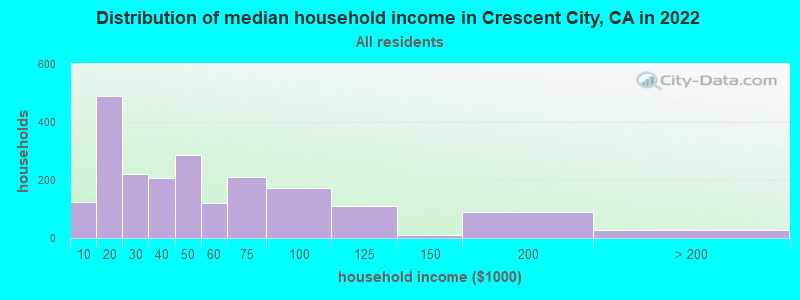
Crescent City, CA household income distribution

- 125Less than $10,000
- 491$10,000 to $19,999
- 222$20,000 to $29,999
- 206$30,000 to $39,999
- 287$40,000 to $49,999
- 119$50,000 to $59,999
- 209$60,000 to $74,999
- 171$75,000 to $99,999
- 109$100,000 to $124,999
- 10$125,000 to $149,999
- 88$150,000 to $199,999
- 26$200,000 or more
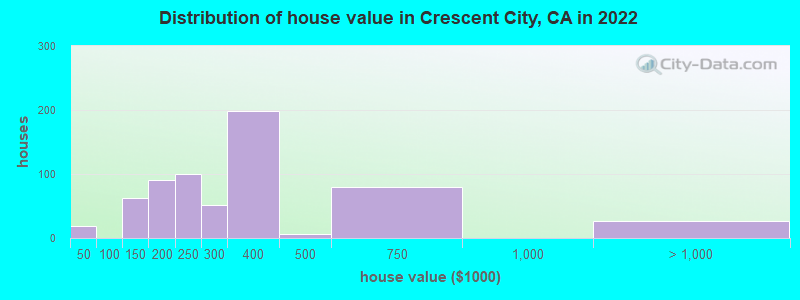
Home value of owner - occupied houses in 2022 in Crescent City, CA
-
- 12$15,000 to $19,999
- 6$25,000 to $29,999
- 62$100,000 to $124,999
- 81$150,000 to $174,999
- 9$175,000 to $199,999
- 99$200,000 to $249,999
- 51$250,000 to $299,999
- 198$300,000 to $399,999
- 6$400,000 to $499,999
- 79$500,000 to $749,999
- 27$1,000,000 to $1,499,999
Rent paid by renters in 2022 in Crescent City, CA
-
- 26$150 to $199
- 116$200 to $249
- 9$250 to $299
- 21$300 to $349
- 33$400 to $449
- 21$450 to $499
- 21$500 to $549
- 6$550 to $599
- 72$700 to $749
- 191$750 to $799
- 86$800 to $899
- 98$900 to $999
- 364$1,000 to $1,249
- 172$1,250 to $1,499
- 43No cash rent

Percentage of workers working in this county: 93.9%
Number of people working at home: 174 (10.5% of all workers)
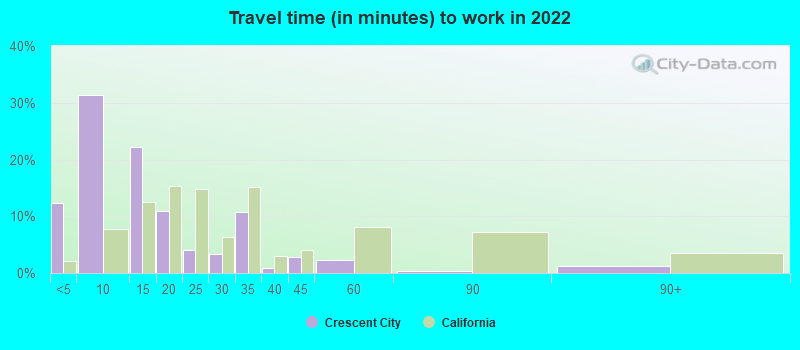
Travel time to work (commute)
- Less than 5 minutes: 159
- 5 to 9 minutes: 525
- 10 to 14 minutes: 335
- 15 to 19 minutes: 179
- 20 to 24 minutes: 35
- 25 to 29 minutes: 0
- 30 to 34 minutes: 99
- 35 to 39 minutes: 24
- 40 to 44 minutes: 0
- 45 to 59 minutes: 0
- 60 to 89 minutes: 0
- 90 or more minutes: 130
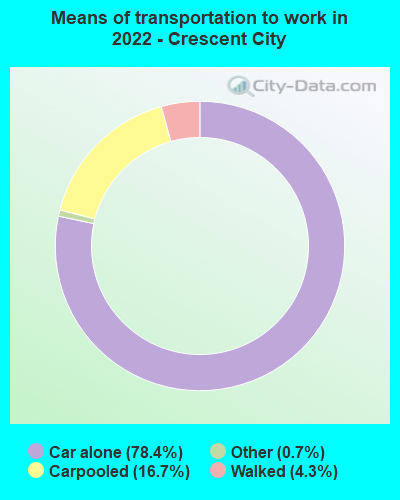
Means of transportation to work:
- Drove a car alone: 3,979 (73.1%)
- Carpooled: 910 (16.7%)
- Taxi: 37 (0.7%)
- Walked: 231 (4.2%)
- Worked at home: 174 (3.2%)
- Unemployment by race in 2022
- Unemployment rate for White non-Hispanic residents
- 8.9%Males
- 6.7%Females
- Unemployment rate for Hispanic or Latino residents
- 5.6%Males

- Year of entry for the foreign-born population in Crescent City, California
- 832010 or later
- 1452000 to 2009
- 1591990 to 1999
- 951980 to 1989
- 491970 to 1979
- 77Before 1970

First ancestries reported:
- American: 395 (12.7%)
- English: 380 (12.2%)
- Portuguese: 123 (3.9%)
- Irish: 80 (2.6%)
- German: 55 (1.8%)
- Swedish: 33 (1.1%)
- Italian: 17 (0.5%)
- Dutch: 15 (0.5%)
- Russian: 14 (0.4%)
- European: 13 (0.4%)
- African: 10 (0.3%)
- Swiss: 9 (0.3%)
- Polish: 8 (0.3%)
- Czechoslovakian: 7 (0.2%)
- Norwegian: 2 (0.06%)
Most common places of birth for foreign-born residents (%):
| Crescent City: | 52.2% (337) |
| California: | 37.2% (3,881,193) |
| Crescent City: | 17.1% (110) |
| California: | 0.2% (25,462) |
| Crescent City: | 11.9% (77) |
| California: | 4.9% (512,335) |
| Crescent City: | 7.0% (45) |
| California: | 0.1% (8,659) |
| Crescent City: | 3.4% (22) |
| California: | 0.6% (65,335) |
| Crescent City: | 3.1% (20) |
| California: | 7.8% (818,297) |
| Crescent City: | 3.1% (20) |
| California: | 0.2% (18,925) |
| Crescent City: | 2.3% (15) |
| California: | 0.0% (4,333) |
Place of birth for U.S.-born residents:
- This state: 4,709
- Other state: 937
- Northeast: 176
- Midwest: 189
- South: 246
- West: 324
79.6% of Crescent City residents lived in the same house 1 years ago.
Out of people who lived in different houses, 22.5% lived in this county.
Out of people who lived in different counties, 83.9% lived in California.
| Crescent City: | 79.6% |
| State average: | 88.9% |
Education attainment for males 25 years and older:
- No schooling: 49
- Nursery to 4th grade: 56
- 5th and 6th grade: 131
- 7th and 8th grade: 13
- 9th grade: 165
- 10th grade: 241
- 11th grade: 221
- 12th grade, no diploma: 236
- High school graduate (or equivalency): 940
- Less than 1 year of college: 218
- Some college more than 1 year, no degree: 315
- Associate degree: 220
- Bachelor's degree: 116
- Master's degree: 83
- Professional school degree: 85
- Doctorate degree: 30

Education attainment for females 25 years and older:
- No schooling: 52
- Nursery to 4th grade: 12
- 5th and 6th grade: 86
- 7th and 8th grade: 0
- 9th grade: 36
- 10th grade: 0
- 11th grade: 56
- 12th grade, no diploma: 73
- High school graduate (or equivalency): 301
- Less than 1 year of college: 179
- Some college more than 1 year, no degree: 348
- Associate degree: 145
- Bachelor's degree: 267
- Master's degree: 223
- Professional school degree: 0
- Doctorate degree: 0


Housing units in structures:
- One, detached: 1,134
- One, attached: 80
- Two: 103
- 3 or 4: 283
- 5 to 9: 204
- 10 to 19: 48
- 20 to 49: 76
- 50 or more: 267
- Mobile homes: 99
House/condo owner moved in on average 8 years ago
Renter moved in on average 2 years ago


- 66.4%Electricity
- 12.3%No fuel used
- 9.7%Wood
- 7.0%Bottled, tank, or LP gas
- 4.6%Fuel oil, kerosene, etc.
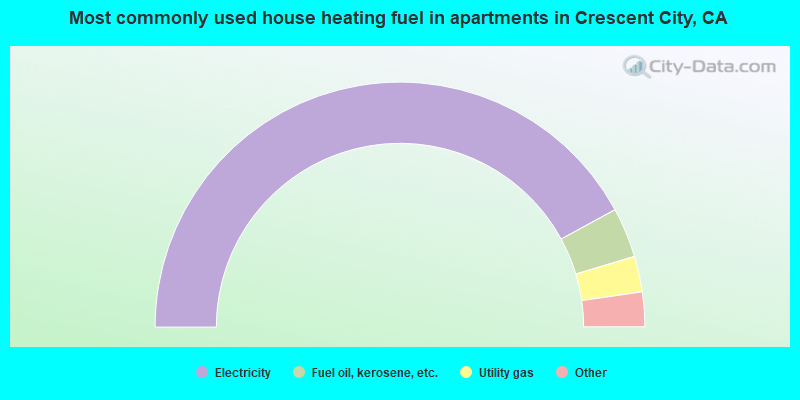
- 84.2%Electricity
- 6.6%Fuel oil, kerosene, etc.
- 4.7%Utility gas
- 2.9%Wood
- 1.6%Bottled, tank, or LP gas
Private vs. public school enrollment:
| Here: | 25.5% |
| California: | 10.5% |
| Here: | 20.3% |
| California: | 8.5% |
| Here: | 3.2% |
| California: | 15.9% |


