Compton, CA (California) Houses and Residents
| Compton: | $554,600 |
| California: | $715,900 |
Mean price in 2022:
Detached houses: $564,145
Here: $564,145 State: $988,808 Townhouses or other attached units: $719,349
Here: $719,349 State: $838,546 In 2-unit structures: $544,244
Here: $544,244 State: $1,138,100 In 3-to-4-unit structures: $647,166
Here: $647,166 State: $824,253 In 5-or-more-unit structures: $550,641
Here: $550,641 State: $730,996 Mobile homes: $306,928
Here: $306,928 State: $184,506
Total population: 98,597 (Urban population: 93,226, Rural population: 0)
Houses: 24,380 (23,389 occupied: 12,269 owner occupied, 11,120 renter occupied)
| % of renters here: | 48% |
| State: | 44% |
Housing density: 2,406 houses/condos per square mile
Median price asked for vacant for-sale houses and condos in 2022: $445,172.
Median contract rent in 2022: $1,507 (lower quartile is $1,119, upper quartile is $1,891)
Median rent asked for vacant for-rent units in 2022: $1,239
Median gross rent in Compton, CA in 2022: $1,618
Housing units in Compton with a mortgage: 8,378 (568 second mortgage, 0 home equity loan, 91 both second mortgage and home equity loan)
Houses without a mortgage: 0
Median household income for houses/condos with a mortgage: $97,944
Median household income for apartments without a mortgage: $47,335
Median monthly housing costs: $1,653
Compare current foreclosures in Compton, CA:
| Photo | Address | Area | Beds / Baths | Price | Details |
|---|---|---|---|---|---|

|
#1
S Slater Ave
Compton, CA 90222
|
- sq. feet
|
2 baths 3 beds |
$572,000
|
show details |

|
#2
W Arbutus St
Compton, CA 90220
|
1,812 sq. feet
|
2 baths 4 beds |
show details | |

|
#3
E Stockton Ave
Compton, CA 90221
|
918 sq. feet
|
1 baths 2 beds |
show details | |

|
#4
S Atlantic Dr
Compton, CA 90221
|
1,880 sq. feet
|
2 baths 3 beds |
show details | |

|
#5
E 124th St
Compton, CA 90222
|
1,373 sq. feet
|
2 baths 3 beds |
show details | |

|
#6
N Grandee Ave
Compton, CA 90220
|
831 sq. feet
|
1 baths 2 beds |
show details | |

|
#7
N Maie Ave
Compton, CA 90220
|
768 sq. feet
|
1 baths 2 beds |
show details | |

|
#8
E Tucker St
Compton, CA 90221
|
1,811 sq. feet
|
2 baths 4 beds |
show details | |

|
#9
S Willowbrook Ave
Compton, CA 90222
|
1,947 sq. feet
|
3 baths 5 beds |
show details | |

|
#10
E Palmerstone St
Compton, CA 90221
|
1,410 sq. feet
|
2 baths 3 beds |
show details |
| Photo | Address | Area | Beds / Baths | Price | Details |
|---|---|---|---|---|---|

|
#11
S Thorson Ave
Compton, CA 90221
|
1,758 sq. feet
|
2 baths 3 beds |
show details | |

|
#12
E Mcmillan St
Compton, CA 90221
|
1,248 sq. feet
|
2 baths 3 beds |
show details | |

|
#13
S Mayo Ave
Compton, CA 90221
|
1,118 sq. feet
|
1 baths 3 beds |
show details | |

|
#14
S Cahita Ave
Compton, CA 90220
|
1,389 sq. feet
|
2 baths 3 beds |
show details | |

|
#15
W Alondra Blvd
Compton, CA 90220
|
775 sq. feet
|
1 baths 2 beds |
show details | |

|
#16
N Bullis Rd
Compton, CA 90221
|
11,530 sq. feet
|
13 baths 26 beds |
show details | |

|
#17
N Chester Ave
Compton, CA 90221
|
1,120 sq. feet
|
2 baths 4 beds |
show details | |

|
#18
W Maple St
Compton, CA 90220
|
1,202 sq. feet
|
1 baths 2 beds |
show details | |

|
#19
S Butler Ave
Compton, CA 90221
|
1,751 sq. feet
|
2 baths 4 beds |
show details | |

|
#20
W Raymond St
Compton, CA 90220
|
2,689 sq. feet
|
4 baths 3 beds |
show details |
| Photo | Address | Area | Beds / Baths | Price | Details |
|---|---|---|---|---|---|

|
#21
E Palmer St
Compton, CA 90221
|
975 sq. feet
|
1 baths 2 beds |
show details | |

|
#22
S Wilmington Ave Apt A
Compton, CA 90220
|
1,137 sq. feet
|
2 baths 3 beds |
show details | |

|
#23
S Bentley Ave
Compton, CA 90220
|
1,738 sq. feet
|
2 baths 4 beds |
show details | |

|
#24
E Stockwell St
Compton, CA 90222
|
848 sq. feet
|
2 baths 4 beds |
show details | |

|
#25
N Evers Ave
Compton, CA 90220
|
1,743 sq. feet
|
3 baths 4 beds |
show details | |

|
#26
N Van Ness Ave
Compton, CA 90221
|
1,300 sq. feet
|
1 baths 3 beds |
show details | |

|
#27
N Adelon Ln
Compton, CA 90221
|
1,900 sq. feet
|
3 baths 3 beds |
show details | |

|
#28
E Johnson St
Compton, CA 90220
|
1,729 sq. feet
|
2 baths 4 beds |
show details | |

|
#29
W Alondra Blvd
Compton, CA 90220
|
1,419 sq. feet
|
3 baths 3 beds |
show details | |

|
#30
E Piru St
Compton, CA 90222
|
672 sq. feet
|
1 baths 2 beds |
show details |
| Photo | Address | Area | Beds / Baths | Price | Details |
|---|---|---|---|---|---|

|
#31
S Castlegate Ave
Compton, CA 90221
|
1,424 sq. feet
|
1 baths 3 beds |
show details | |

|
#32
W Compton Blvd Unit 24
Compton, CA 90220
|
1,349 sq. feet
|
3 baths 3 beds |
show details | |

|
#33
W 166th St
Compton, CA 90220
|
1,121 sq. feet
|
2 baths 4 beds |
show details | |

|
#34
S Northwood Ave
Compton, CA 90220
|
1,489 sq. feet
|
2 baths 3 beds |
show details | |

|
#35
S Largo Ave
Compton, CA 90222
|
874 sq. feet
|
1 baths 3 beds |
show details | |

|
#36
N Rose Ave
Compton, CA 90221
|
1,719 sq. feet
|
3 baths 3 beds |
show details | |

|
#37
E Nord St
Compton, CA 90222
|
672 sq. feet
|
1 baths 2 beds |
show details | |

|
#38
S Corlett Ave
Compton, CA 90220
|
768 sq. feet
|
1 baths 2 beds |
show details | |

|
#39
N Bullis Rd
Compton, CA 90221
|
6,028 sq. feet
|
10 baths 15 beds |
show details | |

|
#40
W Palm St
Compton, CA 90220
|
1,712 sq. feet
|
3 baths 5 beds |
show details |
| Photo | Address | Area | Beds / Baths | Price | Details |
|---|---|---|---|---|---|

|
#41
W 156th St
Compton, CA 90220
|
1,040 sq. feet
|
1 baths 3 beds |
show details | |

|
#42
N Broadacres Ave
Compton, CA 90220
|
831 sq. feet
|
1 baths 2 beds |
show details | |

|
#43
W 130th St
Compton, CA 90222
|
983 sq. feet
|
1 baths 3 beds |
show details | |

|
#44
E Reeve St
Compton, CA 90220
|
1,008 sq. feet
|
1 baths 3 beds |
show details | |

|
#45
W Brazil St
Compton, CA 90220
|
1,316 sq. feet
|
2 baths 2 beds |
show details | |

|
#46
W Billings St
Compton, CA 90220
|
1,583 sq. feet
|
3 baths 4 beds |
show details | |

|
#47
W 153rd St
Compton, CA 90220
|
1,162 sq. feet
|
2 baths 3 beds |
show details | |

|
#48
W 129th St
Compton, CA 90222
|
753 sq. feet
|
1 baths 2 beds |
show details | |

|
#49
S Penrose Ave
Compton, CA 90222
|
1,152 sq. feet
|
2 baths 3 beds |
show details | |

|
Check over 1 million property listings on Foreclosure.com!
|
browse all offers | |||

Latest news about housing in Compton, CA collected exclusively by city-data.com from local newspapers, TV, and radio stations

 | CA Cities(Pop 65,000+) by Median Household Income, 2019 (8 replies) |
| The Bay Area Soiled/Homeless/Infested/Trashed Containment Thread (1266 replies) |
| How Blockbusting Shaped Compton (1 reply) |
| Median price for existing OC house: $760,000 (LA & IE prices rise faster than OC) (115 replies) |
| Compton? (102 replies) |
| How much would a home like this costs? (37 replies) |

Median year apartment built: 1974
Household type by relationship:
Households: 91,979- Male householders: 10,878 (1,117 living alone), Female householders: 12,511 (3,064 living alone)
10,714 spouses (10,615 opposite-sex spouses), 1,239 unmarried partners, (1,017 opposite-sex unmarried partners), 33,018 children (31,468 natural, 406 adopted, 1,144 stepchildren), 7,172 grandchildren, 3,984 brothers or sisters, 3,524 parents, 226 foster children, 5,149 other relatives, 3,153 non-relatives
- In group quarters: 411
Size of family households: 3,872 2-persons, 2,853 3-persons, 4,239 4-persons, 3,603 5-persons, 1,329 6-persons, 2,796 7-or-more-persons.
Size of nonfamily households: 4,181 1-person, 233 2-persons, 237 3-persons, 46 4-persons.
12,429 married couples with children.
5,464 single-parent households (2,003 men, 3,461 women).
35.7% of residents of Compton speak English at home.
62.3% of residents speak Spanish at home (64% speak English very well, 15% speak English well, 11% speak English not well, 10% don't speak English at all).
0.1% of residents speak other Indo-European language at home (93% speak English very well, 7% speak English well).
0.9% of residents speak Asian or Pacific Island language at home (54% speak English very well, 18% speak English well, 23% speak English not well, 5% don't speak English at all).
Foreign born population: 26,778 (29.1%)
(32.4% of them are naturalized citizens)
| Here: | 5.3 |
| State: | 6.0 |
| Here: | 4.1 |
| State: | 3.9 |

- Bedrooms in owner-occupied houses and condos in Compton, California
- 90no bedroom
- 1761 bedroom
- 3,8082 bedrooms
- 5,8083 bedrooms
- 2,1174 bedrooms
- 2705+ bedrooms

- Bedrooms in renter-occupied apartments in Compton, California
- 475no bedroom
- 2,2181 bedroom
- 4,9542 bedrooms
- 2,8263 bedrooms
- 6474 bedrooms
- 05+ bedrooms

- Cars and other vehicles available in Compton in owner-occupied houses/condos
- 805no vehicle
- 2,0211 vehicle
- 4,1572 vehicles
- 2,3103 vehicles
- 1,9034 vehicles
- 1,0735+ vehicles

- Cars and other vehicles available in Compton in renter-occupied apartments
- 662no vehicle
- 3,6351 vehicle
- 4,1062 vehicles
- 2,0003 vehicles
- 4974 vehicles
- 2205+ vehicles

- Rooms in owner-occupied houses in Compton, California
- 901 room
- 1302 rooms
- 1813 rooms
- 2,6814 rooms
- 3,6155 rooms
- 2,5946 rooms
- 1,3417 rooms
- 1,1368 rooms
- 5019+ rooms

- Rooms in renter-occupied apartments in Compton, California
- 4751 room
- 6122 rooms
- 2,1713 rooms
- 3,6524 rooms
- 2,3895 rooms
- 1,2106 rooms
- 4707 rooms
- 1078 rooms
- 349+ rooms


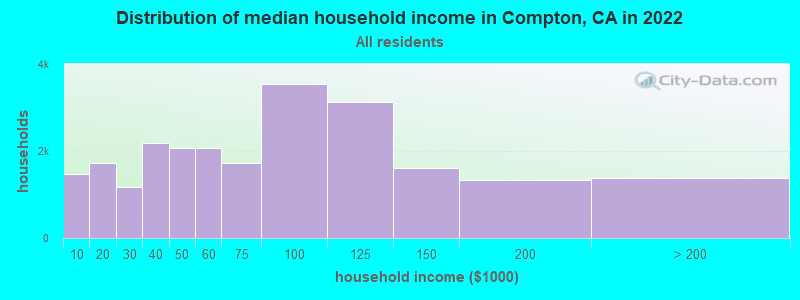
Compton, CA household income distribution

- 1,475Less than $10,000
- 1,732$10,000 to $19,999
- 1,181$20,000 to $29,999
- 2,173$30,000 to $39,999
- 2,061$40,000 to $49,999
- 2,067$50,000 to $59,999
- 1,715$60,000 to $74,999
- 3,548$75,000 to $99,999
- 3,115$100,000 to $124,999
- 1,601$125,000 to $149,999
- 1,342$150,000 to $199,999
- 1,379$200,000 or more
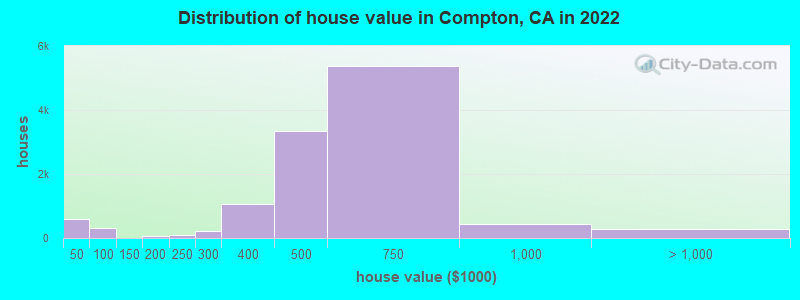
Home value of owner - occupied houses in 2022 in Compton, CA
-
- 318Less than $10,000
- 11$10,000 to $14,999
- 14$15,000 to $19,999
- 10$20,000 to $24,999
- 45$30,000 to $34,999
- 4$35,000 to $39,999
- 177$40,000 to $49,999
- 76$50,000 to $59,999
- 7$80,000 to $89,999
- 56$90,000 to $99,999
- 14$125,000 to $149,999
- 56$150,000 to $174,999
- 16$175,000 to $199,999
- 104$200,000 to $249,999
- 224$250,000 to $299,999
- 1,067$300,000 to $399,999
- 3,340$400,000 to $499,999
- 5,365$500,000 to $749,999
- 424$750,000 to $999,999
- 93$1,000,000 to $1,499,999
- 181$2,000,000 or more
Rent paid by renters in 2022 in Compton, CA
-
- 76Less than $100
- 41$100 to $149
- 189$200 to $249
- 76$250 to $299
- 47$300 to $349
- 52$350 to $399
- 48$400 to $449
- 64$450 to $499
- 33$500 to $549
- 69$550 to $599
- 83$600 to $649
- 75$650 to $699
- 117$700 to $749
- 118$750 to $799
- 527$800 to $899
- 857$900 to $999
- 2,071$1,000 to $1,249
- 1,919$1,250 to $1,499
- 2,909$1,500 to $1,999
- 841$2,000 to $2,499
- 123$2,500 to $2,999
- 86$3,000 to $3,499
- 47$3,500 or more
- 238No cash rent


Percentage of workers working in this county: 95.5%
Number of people working at home: 1,707 (4.3% of all workers)
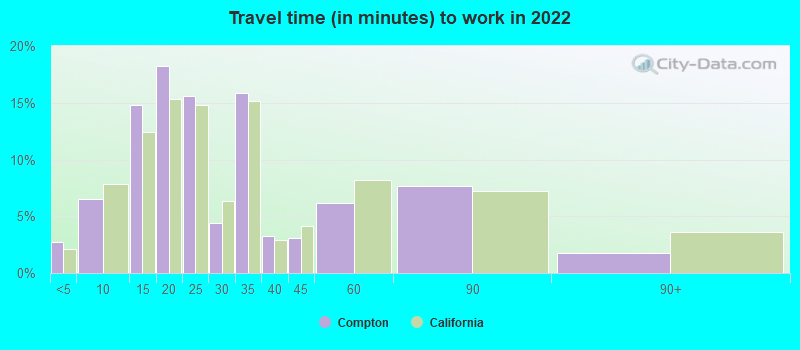
Travel time to work (commute)
- Less than 5 minutes: 908
- 5 to 9 minutes: 1,178
- 10 to 14 minutes: 3,597
- 15 to 19 minutes: 4,721
- 20 to 24 minutes: 6,637
- 25 to 29 minutes: 2,236
- 30 to 34 minutes: 7,609
- 35 to 39 minutes: 1,405
- 40 to 44 minutes: 1,659
- 45 to 59 minutes: 2,282
- 60 to 89 minutes: 1,855
- 90 or more minutes: 824
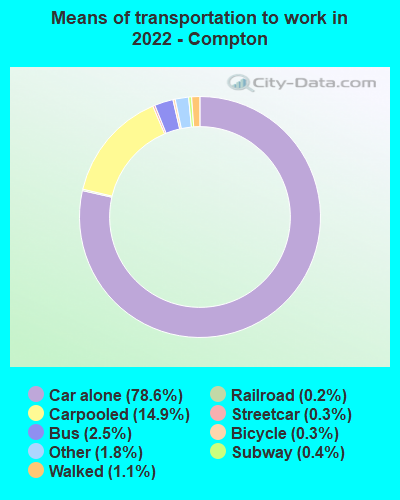
Means of transportation to work:
- Drove a car alone: 20,173 (71.1%)
- Carpooled: 4,223 (14.9%)
- Bus: 581 (2.0%)
- Subway or elevated rail: 56 (0.2%)
- Long-distance train or commuter rail: 55 (0.2%)
- Light rail, streetcar or trolley: 26 (0.1%)
- Taxi: 499 (1.8%)
- Bicycle: 86 (0.3%)
- Walked: 302 (1.1%)
- Worked at home: 1,707 (6.0%)

- Unemployment by race in 2022
- Unemployment rate for White non-Hispanic residents
- 1.1%Males
- Unemployment rate for Black residents
- 20.5%Males
- 1.1%Females
- Unemployment rate for American Indian and Alaska Native residents
- 13.7%Males
- 3.9%Females
- Unemployment rate for Asian residents
- 3.8%Females
- Unemployment rate for other race residents
- 8.8%Males
- 5.5%Females
- Unemployment rate for two or more race residents
- 6.8%Males
- 7.2%Females
- Unemployment rate for Hispanic or Latino residents
- 8.3%Males
- 6.0%Females

- Year of entry for the foreign-born population in Compton, California
- 2,7742010 or later
- 4,6572000 to 2009
- 6,8751990 to 1999
- 10,6881980 to 1989
- 7,2031970 to 1979
- 1,372Before 1970

First ancestries reported:
- African: 1,182 (1.6%)
- American: 287 (0.4%)
- Belizean: 118 (0.2%)
- Jamaican: 85 (0.1%)
- Canadian: 50 (0.07%)
- Italian: 46 (0.06%)
- Nigerian: 30 (0.04%)
- French: 27 (0.04%)
- German: 23 (0.03%)
- Welsh: 21 (0.03%)
- Russian: 17 (0.02%)
- Iranian: 13 (0.02%)
- Northern European: 12 (0.02%)
- European: 11 (0.02%)
Most common places of birth for foreign-born residents (%):
| Compton: | 77.0% (20,910) |
| California: | 37.2% (3,881,193) |
| Compton: | 8.5% (2,308) |
| California: | 4.2% (440,287) |
| Compton: | 5.0% (1,356) |
| California: | 2.8% (290,436) |
| Compton: | 2.6% (719) |
| California: | 0.6% (66,590) |
Place of birth for U.S.-born residents:
- This state: 59,897
- Other state: 4,720
- Northeast: 162
- Midwest: 745
- South: 3,103
- West: 710
96.2% of Compton residents lived in the same house 1 years ago.
Out of people who lived in different houses, 45.5% lived in this county.
Out of people who lived in different counties, 47.4% lived in California.
| Compton: | 96.2% |
| State average: | 88.9% |
Education attainment for males 25 years and older:
- No schooling: 1,659
- Nursery to 4th grade: 802
- 5th and 6th grade: 2,694
- 7th and 8th grade: 1,067
- 9th grade: 509
- 10th grade: 307
- 11th grade: 548
- 12th grade, no diploma: 2,184
- High school graduate (or equivalency): 6,539
- Less than 1 year of college: 2,520
- Some college more than 1 year, no degree: 3,026
- Associate degree: 2,775
- Bachelor's degree: 2,011
- Master's degree: 489
- Professional school degree: 0
- Doctorate degree: 0

Education attainment for females 25 years and older:
- No schooling: 2,040
- Nursery to 4th grade: 1,507
- 5th and 6th grade: 1,843
- 7th and 8th grade: 1,276
- 9th grade: 644
- 10th grade: 859
- 11th grade: 497
- 12th grade, no diploma: 1,245
- High school graduate (or equivalency): 7,672
- Less than 1 year of college: 1,851
- Some college more than 1 year, no degree: 2,682
- Associate degree: 2,677
- Bachelor's degree: 2,688
- Master's degree: 1,957
- Professional school degree: 165
- Doctorate degree: 76


Housing units in structures:
- One, detached: 17,083
- One, attached: 1,668
- Two: 506
- 3 or 4: 1,758
- 5 to 9: 468
- 10 to 19: 1,286
- 20 to 49: 250
- 50 or more: 669
- Mobile homes: 692
Median worth of mobile homes: $9,999
Housing units lacking complete kitchen facilities in 2022: 1.7%
House/condo owner moved in on average 18 years ago
Renter moved in on average 8 years ago

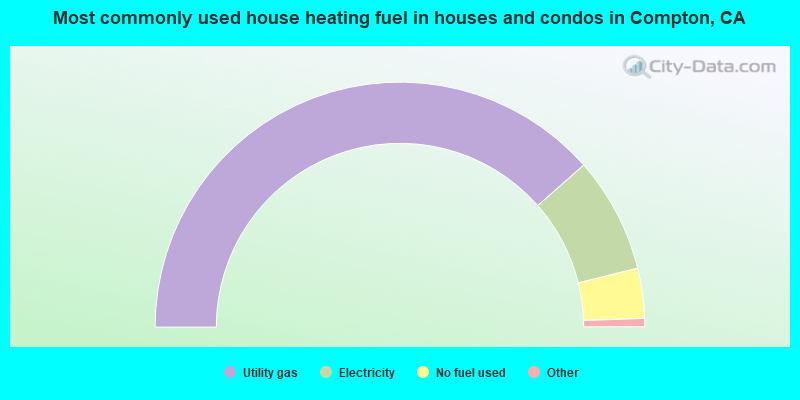
- 77.1%Utility gas
- 15.3%Electricity
- 6.6%No fuel used
- 0.5%Bottled, tank, or LP gas
- 0.2%Solar energy
- 0.2%Other fuel
- 0.1%Wood
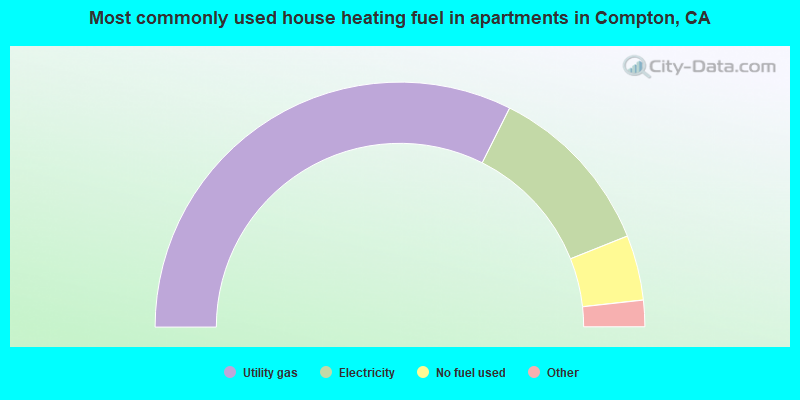
- 64.8%Utility gas
- 23.1%Electricity
- 8.6%No fuel used
- 2.5%Bottled, tank, or LP gas
- 0.7%Other fuel
- 0.3%Wood
Private vs. public school enrollment:
| Here: | 2.9% |
| California: | 10.5% |
| Here: | 2.1% |
| California: | 8.5% |
| Here: | 11.8% |
| California: | 15.9% |


