Cicero, IL (Illinois) Houses and Residents
| Cicero: | $243,900 |
| Illinois: | $251,600 |
Mean price in 2022:
Detached houses: $226,717
Here: $226,717 State: $310,164 Townhouses or other attached units: $183,722
Here: $183,722 State: $286,230 In 2-unit structures: $213,381
Here: $213,381 State: $299,638 In 3-to-4-unit structures: $296,988
Here: $296,988 State: $330,907 In 5-or-more-unit structures: $183,093
Here: $183,093 State: $318,887 Mobile homes: $150,581
Here: $150,581 State: $78,855
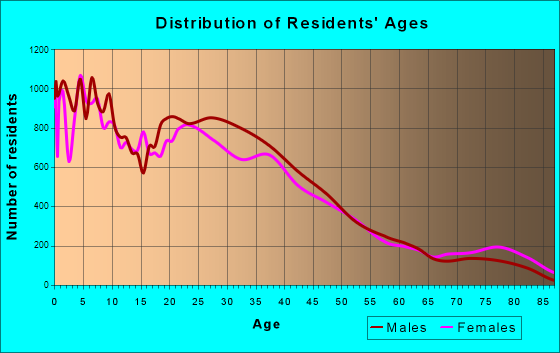
Total population: 84,354 (All urban)
Houses: 28,572 (27,136 occupied: 15,172 owner occupied, 11,964 renter occupied)
| % of renters here: | 44% |
| State: | 33% |
Housing density: 4,887 houses/condos per square mile
Median price asked for vacant for-sale houses and condos in 2022: $241,826.
Median contract rent in 2022: $929 (lower quartile is $784, upper quartile is $1,105)
Median rent asked for vacant for-rent units in 2022: $1,016
Median gross rent in Cicero, IL in 2022: $1,000
Housing units in Cicero with a mortgage: 7,727 (364 second mortgage, 66 home equity loan, 208 both second mortgage and home equity loan)
Houses without a mortgage: 129
Median household income for houses/condos with a mortgage: $90,248
Median household income for apartments without a mortgage: $71,140
Median monthly housing costs: $1,038
Compare current foreclosures in Cicero, IL:
| Photo | Address | Area | Beds / Baths | Price | Details |
|---|---|---|---|---|---|

|
#1
W 24th Pl
Cicero, IL 60804
|
1,248 sq. feet
|
2 baths 3 beds |
show details | |

|
#2
S 49th Ave
Cicero, IL 60804
|
2,470 sq. feet
|
2 baths 6 beds |
show details | |

|
#3
S 50th Ave
Cicero, IL 60804
|
840 sq. feet
|
1 baths 3 beds |
show details | |

|
#4
S 50th Ct
Cicero, IL 60804
|
945 sq. feet
|
1 baths 2 beds |
show details | |

|
#5
S 61st Ave
Cicero, IL 60804
|
1,682 sq. feet
|
2 baths 4 beds |
show details | |

|
#6
S 58th Ct
Cicero, IL 60804
|
1,003 sq. feet
|
2 baths 3 beds |
show details | |

|
#7
S 58th Ave
Cicero, IL 60804
|
1,832 sq. feet
|
2 baths 6 beds |
show details | |

|
#8
S 58th Ct
Cicero, IL 60804
|
1,176 sq. feet
|
2 baths 3 beds |
show details | |

|
#9
S 58th Ave
Cicero, IL 60804
|
1,774 sq. feet
|
2 baths 2 beds |
show details | |

|
#10
S 56th Ct
Cicero, IL 60804
|
958 sq. feet
|
2 baths 2 beds |
show details |
| Photo | Address | Area | Beds / Baths | Price | Details |
|---|---|---|---|---|---|

|
#11
S 54th Ave
Cicero, IL 60804
|
979 sq. feet
|
2 baths 3 beds |
show details | |

|
#12
S 58th Ave
Cicero, IL 60804
|
1,003 sq. feet
|
2 baths 3 beds |
show details | |

|
#13
S 61st Ct
Cicero, IL 60804
|
1,483 sq. feet
|
1 baths 3 beds |
show details | |

|
#14
S 57th Ave
Cicero, IL 60804
|
1,099 sq. feet
|
2 baths 2 beds |
show details | |

|
#15
S 58th Ct
Cicero, IL 60804
|
1,053 sq. feet
|
1 baths 3 beds |
show details | |

|
#16
S Central Ave
Cicero, IL 60804
|
976 sq. feet
|
1 baths 2 beds |
show details | |

|
#17
S 58th Ave
Cicero, IL 60804
|
1,290 sq. feet
|
3 baths 3 beds |
show details | |

|
#18
S 59th Ave
Cicero, IL 60804
|
936 sq. feet
|
1 baths 2 beds |
show details | |

|
#19
S Austin Blvd
Cicero, IL 60804
|
3,053 sq. feet
|
2 baths 3 beds |
show details | |

|
#20
S 57th Ct
Cicero, IL 60804
|
1,110 sq. feet
|
1 baths 3 beds |
show details |
| Photo | Address | Area | Beds / Baths | Price | Details |
|---|---|---|---|---|---|

|
#21
W 23rd St
Cicero, IL 60804
|
1,248 sq. feet
|
2 baths 4 beds |
show details | |

|
#22
S 56th Ct
Cicero, IL 60804
|
968 sq. feet
|
1 baths 2 beds |
show details | |

|
#23
W 32nd St
Cicero, IL 60804
|
1,950 sq. feet
|
3 baths 5 beds |
show details | |

|
#24
Ogden Ave
Cicero, IL 60804
|
1,680 sq. feet
|
2 baths 4 beds |
show details | |

|
#25
S 54th Ct
Cicero, IL 60804
|
1,048 sq. feet
|
2 baths 3 beds |
show details | |

|
#26
S 53rd Ave
Cicero, IL 60804
|
1,008 sq. feet
|
1 baths 3 beds |
show details | |

|
#27
S 51st Ave
Cicero, IL 60804
|
2,355 sq. feet
|
3 baths 6 beds |
show details | |

|
#28
S 49th Ave
Cicero, IL 60804
|
1,528 sq. feet
|
3 baths 3 beds |
show details | |

|
#29
W 12th Pl
Cicero, IL 60804
|
2,162 sq. feet
|
2 baths 5 beds |
show details | |

|
#30
S 61st Ave
Cicero, IL 60804
|
- sq. feet
|
1 baths 3 beds |
show details |
| Photo | Address | Area | Beds / Baths | Price | Details |
|---|---|---|---|---|---|

|
#31
S 61st Ave
Cicero, IL 60804
|
1,024 sq. feet
|
1 baths 3 beds |
show details | |

|
#32
S 57th Ct
Cicero, IL 60804
|
946 sq. feet
|
1 baths 3 beds |
show details | |

|
#33
S 59th Ave
Cicero, IL 60804
|
936 sq. feet
|
1 baths 3 beds |
show details | |

|
#34
S 61st Ct
Cicero, IL 60804
|
1,215 sq. feet
|
1 baths 3 beds |
show details | |

|
#35
S Lombard Ave
Cicero, IL 60804
|
1,062 sq. feet
|
1 baths 2 beds |
show details | |

|
#36
S 60th Ct
Cicero, IL 60804
|
1,500 sq. feet
|
2 baths 3 beds |
show details | |

|
#37
S 59th Ave
Cicero, IL 60804
|
1,590 sq. feet
|
2 baths 4 beds |
show details | |

|
#38
S Central Ave
Cicero, IL 60804
|
1,286 sq. feet
|
2 baths 2 beds |
show details | |

|
#39
S 59th Ave
Cicero, IL 60804
|
1,624 sq. feet
|
2 baths 4 beds |
show details | |

|
#40
S Lombard Ave
Cicero, IL 60804
|
2,142 sq. feet
|
3 baths 4 beds |
show details |
| Photo | Address | Area | Beds / Baths | Price | Details |
|---|---|---|---|---|---|

|
#41
S Austin Blvd
Cicero, IL 60804
|
1,003 sq. feet
|
1 baths 2 beds |
show details | |

|
#42
S 57th Ave
Cicero, IL 60804
|
1,499 sq. feet
|
2 baths 3 beds |
show details | |

|
#43
S 48th Ct
Cicero, IL 60804
|
2,500 sq. feet
|
2 baths 4 beds |
show details | |

|
#44
S 59th Ave
Cicero, IL 60804
|
1,176 sq. feet
|
2 baths 3 beds |
show details | |

|
#45
S 57th Ct
Cicero, IL 60804
|
829 sq. feet
|
1 baths 2 beds |
show details | |

|
#46
S 54th Ave # 1
Cicero, IL 60804
|
1,630 sq. feet
|
2 baths 4 beds |
show details | |

|
#47
S 57th Ct
Cicero, IL 60804
|
1,004 sq. feet
|
1 baths 2 beds |
show details | |

|
#48
W Ogden Ave
Cicero, IL 60804
|
1,096 sq. feet
|
2 baths 3 beds |
show details | |

|
#49
S 48th Ct
Cicero, IL 60804
|
840 sq. feet
|
1 baths 3 beds |
show details | |

|
Check over 1 million property listings on Foreclosure.com!
|
browse all offers | |||

Latest news about housing in Cicero, IL collected exclusively by city-data.com from local newspapers, TV, and radio stations

 | Lincoln Park to Naperville around 200k, condo/townhome (3 replies) |
| UIC-Family of 4 housing (4 replies) |
| Are Chicago suburbs better or different than other large midwest city suburbs? (75 replies) |
| Buying Multiplex for Investment using home equity loan (33 replies) |
| How come North Chicago suburbs are predominantly White? (47 replies) |
| Berwyn/Cicero (15 replies) |
Median year apartment built: 1938
Household type by relationship:
Households: 81,916- Male householders: 16,306 (3,583 living alone), Female householders: 10,830 (2,324 living alone)
11,787 spouses (11,787 opposite-sex spouses), 2,850 unmarried partners, (2,850 opposite-sex unmarried partners), 26,263 children (26,035 natural, 63 adopted, 165 stepchildren), 4,241 grandchildren, 716 brothers or sisters, 1,978 parents, 0 foster children, 1,706 other relatives, 4,486 non-relatives
- In group quarters: 753
Size of family households: 4,605 2-persons, 4,521 3-persons, 6,153 4-persons, 2,345 5-persons, 1,366 6-persons, 817 7-or-more-persons.
Size of nonfamily households: 5,907 1-person, 1,155 2-persons, 149 3-persons, 118 6-persons.
8,579 married couples with children.
5,838 single-parent households (3,153 men, 2,685 women).
18.4% of residents of Cicero speak English at home.
81.0% of residents speak Spanish at home (59% speak English very well, 21% speak English well, 15% speak English not well, 4% don't speak English at all).
0.8% of residents speak other Indo-European language at home (77% speak English very well, 10% speak English well, 13% speak English not well).
0.6% of residents speak Asian or Pacific Island language at home (80% speak English very well, 5% speak English well, 15% speak English not well).
0.2% of residents speak other language at home (100% speak English very well).
Foreign born population: 31,169 (38.0%)
(42.7% of them are naturalized citizens)
| Here: | 5.8 |
| State: | 6.4 |
| Here: | 4.6 |
| State: | 4.1 |

- Bedrooms in owner-occupied houses and condos in Cicero, Illinois
- 232no bedroom
- 01 bedroom
- 4,3722 bedrooms
- 8,3143 bedrooms
- 1,7254 bedrooms
- 5295+ bedrooms

- Bedrooms in renter-occupied apartments in Cicero, Illinois
- 1,238no bedroom
- 2,5451 bedroom
- 5,7112 bedrooms
- 1,8863 bedrooms
- 1574 bedrooms
- 4275+ bedrooms

- Cars and other vehicles available in Cicero in owner-occupied houses/condos
- 1,247no vehicle
- 4,1771 vehicle
- 4,6112 vehicles
- 3,8293 vehicles
- 1,0224 vehicles
- 2865+ vehicles

- Cars and other vehicles available in Cicero in renter-occupied apartments
- 1,699no vehicle
- 6,0081 vehicle
- 3,5932 vehicles
- 5133 vehicles
- 04 vehicles
- 1515+ vehicles

- Rooms in owner-occupied houses in Cicero, Illinois
- 2321 room
- 02 rooms
- 2123 rooms
- 1,8134 rooms
- 3,6155 rooms
- 5,7116 rooms
- 1,8557 rooms
- 1,0818 rooms
- 6539+ rooms

- Rooms in renter-occupied apartments in Cicero, Illinois
- 8811 room
- 4332 rooms
- 2,2603 rooms
- 2,0294 rooms
- 4,2495 rooms
- 1,6116 rooms
- 747 rooms
- 4278 rooms
- 09+ rooms


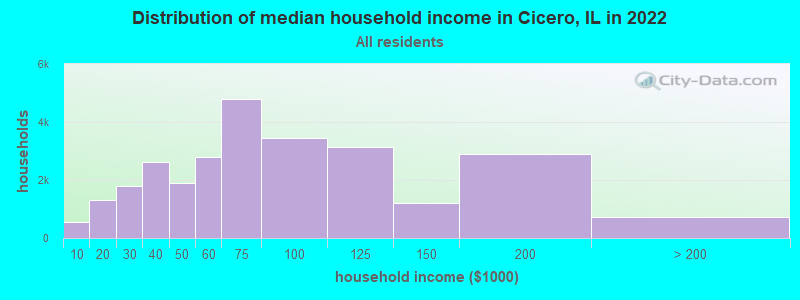
Cicero, IL household income distribution

- 547Less than $10,000
- 1,302$10,000 to $19,999
- 1,809$20,000 to $29,999
- 2,612$30,000 to $39,999
- 1,880$40,000 to $49,999
- 2,785$50,000 to $59,999
- 4,785$60,000 to $74,999
- 3,455$75,000 to $99,999
- 3,130$100,000 to $124,999
- 1,199$125,000 to $149,999
- 2,891$150,000 to $199,999
- 741$200,000 or more
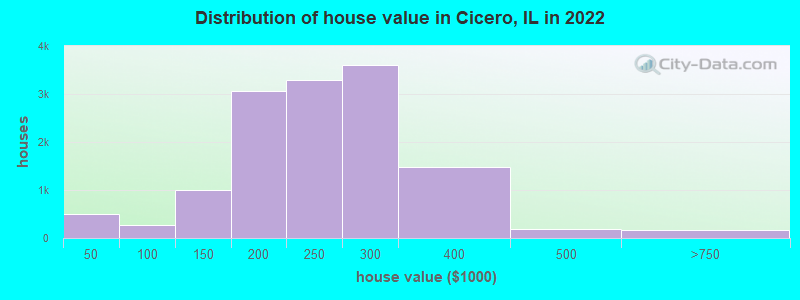
Home value of owner - occupied houses in 2022 in Cicero, IL
-
- 343Less than $10,000
- 7$10,000 to $14,999
- 25$15,000 to $19,999
- 55$20,000 to $24,999
- 13$25,000 to $29,999
- 23$30,000 to $34,999
- 14$35,000 to $39,999
- 14$40,000 to $49,999
- 19$50,000 to $59,999
- 24$60,000 to $69,999
- 73$70,000 to $79,999
- 96$80,000 to $89,999
- 35$90,000 to $99,999
- 482$100,000 to $124,999
- 525$125,000 to $149,999
- 1,737$150,000 to $174,999
- 1,334$175,000 to $199,999
- 3,286$200,000 to $249,999
- 3,594$250,000 to $299,999
- 1,484$300,000 to $399,999
- 189$400,000 to $499,999
- 103$500,000 to $749,999
- 30$750,000 to $999,999
- 8$1,000,000 to $1,499,999
- 17$2,000,000 or more
Rent paid by renters in 2022 in Cicero, IL
-
- 34Less than $100
- 186$150 to $199
- 263$200 to $249
- 31$300 to $349
- 13$350 to $399
- 6$400 to $449
- 52$450 to $499
- 35$500 to $549
- 100$550 to $599
- 440$600 to $649
- 242$650 to $699
- 655$700 to $749
- 733$750 to $799
- 2,023$800 to $899
- 1,691$900 to $999
- 3,140$1,000 to $1,249
- 1,016$1,250 to $1,499
- 456$1,500 to $1,999
- 116$2,000 to $2,499
- 410No cash rent


Percentage of workers working in this county: 90.8%
Number of people working at home: 2,047 (5.2% of all workers)
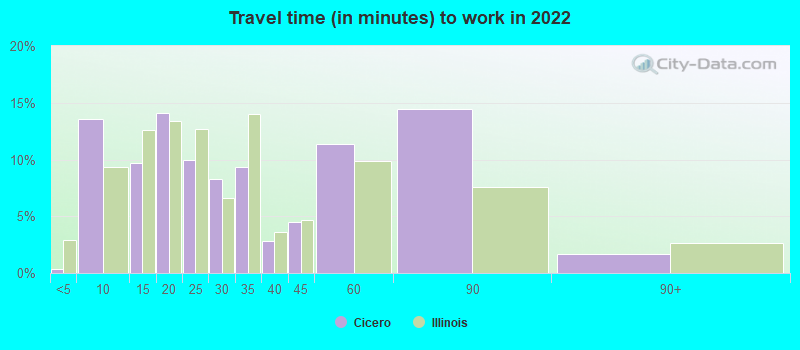
Travel time to work (commute)
- Less than 5 minutes: 0
- 5 to 9 minutes: 3,503
- 10 to 14 minutes: 3,765
- 15 to 19 minutes: 3,374
- 20 to 24 minutes: 7,380
- 25 to 29 minutes: 3,020
- 30 to 34 minutes: 7,284
- 35 to 39 minutes: 758
- 40 to 44 minutes: 2,436
- 45 to 59 minutes: 2,595
- 60 to 89 minutes: 2,929
- 90 or more minutes: 196
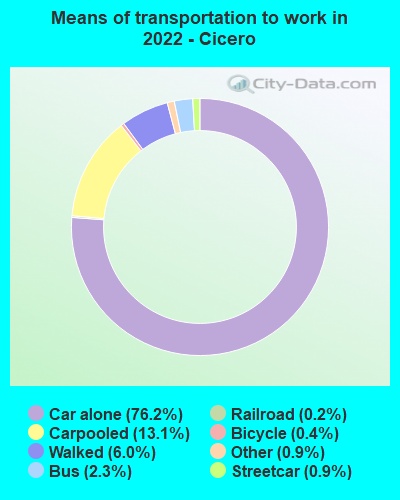
Means of transportation to work:
- Drove a car alone: 12,678 (67.8%)
- Carpooled: 2,330 (12.5%)
- Bus: 354 (1.9%)
- Subway or elevated rail: 120 (0.6%)
- Light rail, streetcar or trolley: 25 (0.1%)
- Taxi: 144 (0.8%)
- Bicycle: 64 (0.3%)
- Walked: 1,035 (5.5%)
- Worked at home: 2,047 (11.0%)

- Unemployment by race in 2022
- Unemployment rate for White non-Hispanic residents
- 2.1%Males
- 3.6%Females
- Unemployment rate for Black residents
- 10.6%Males
- 7.6%Females
- Unemployment rate for American Indian and Alaska Native residents
- 11.8%Males
- 1.7%Females
- Unemployment rate for other race residents
- 2.2%Males
- 3.1%Females
- Unemployment rate for two or more race residents
- 2.8%Males
- 4.1%Females
- Unemployment rate for Hispanic or Latino residents
- 6.3%Males
- 6.2%Females

- Year of entry for the foreign-born population in Cicero, Illinois
- 3,3952010 or later
- 6,1162000 to 2009
- 9,5901990 to 1999
- 11,1411980 to 1989
- 7,5801970 to 1979
- 2,694Before 1970

First ancestries reported:
- Polish: 625 (1.0%)
- American: 458 (0.7%)
- Irish: 420 (0.7%)
- Czech: 252 (0.4%)
- German: 214 (0.3%)
- Italian: 159 (0.3%)
- Arab: 73 (0.1%)
- French: 70 (0.1%)
- Lithuanian: 69 (0.1%)
- Croatian: 53 (0.08%)
- Slovene: 47 (0.07%)
- Ukrainian: 39 (0.06%)
- Jamaican: 38 (0.06%)
- Ugandan: 36 (0.06%)
- Palestinian: 33 (0.05%)
- Scottish: 33 (0.05%)
- European: 32 (0.05%)
- Serbian: 28 (0.04%)
- English: 27 (0.04%)
- Romanian: 25 (0.04%)
- Scotch-Irish: 18 (0.03%)
- Eastern European: 14 (0.02%)
- African: 13 (0.02%)
- Armenian: 11 (0.02%)
- Greek: 11 (0.02%)
- Swedish: 9 (0.01%)
- Czechoslovakian: 7 (0.01%)
- Russian: 7 (0.01%)
Most common places of birth for foreign-born residents (%):
| Cicero: | 90.1% (29,176) |
| Illinois: | 34.7% (626,958) |
| Cicero: | 2.3% (757) |
| Illinois: | 1.3% (22,793) |
| Cicero: | 1.5% (501) |
| Illinois: | 0.9% (16,553) |
Place of birth for U.S.-born residents:
- This state: 44,358
- Other state: 5,099
- Northeast: 554
- Midwest: 738
- South: 2,286
- West: 1,521
94.7% of Cicero residents lived in the same house 1 years ago.
Out of people who lived in different houses, 48.0% lived in this county.
Out of people who lived in different counties, 49.1% lived in Illinois.
| Cicero: | 94.7% |
| State average: | 88.3% |
Education attainment for males 25 years and older:
- No schooling: 1,447
- Nursery to 4th grade: 768
- 5th and 6th grade: 3,026
- 7th and 8th grade: 599
- 9th grade: 524
- 10th grade: 77
- 11th grade: 602
- 12th grade, no diploma: 781
- High school graduate (or equivalency): 9,717
- Less than 1 year of college: 861
- Some college more than 1 year, no degree: 1,981
- Associate degree: 1,990
- Bachelor's degree: 2,704
- Master's degree: 514
- Professional school degree: 0
- Doctorate degree: 0

Education attainment for females 25 years and older:
- No schooling: 1,588
- Nursery to 4th grade: 819
- 5th and 6th grade: 1,690
- 7th and 8th grade: 717
- 9th grade: 1,246
- 10th grade: 297
- 11th grade: 676
- 12th grade, no diploma: 551
- High school graduate (or equivalency): 9,893
- Less than 1 year of college: 1,213
- Some college more than 1 year, no degree: 1,554
- Associate degree: 1,775
- Bachelor's degree: 3,254
- Master's degree: 1,327
- Professional school degree: 60
- Doctorate degree: 0

Housing units in structures:
- One, detached: 12,664
- One, attached: 694
- Two: 7,601
- 3 or 4: 3,486
- 5 to 9: 2,076
- 10 to 19: 1,932
- 20 to 49: 119
Housing units lacking complete kitchen facilities in 2022: 2.4%
House/condo owner moved in on average 15 years ago
Renter moved in on average 3 years ago

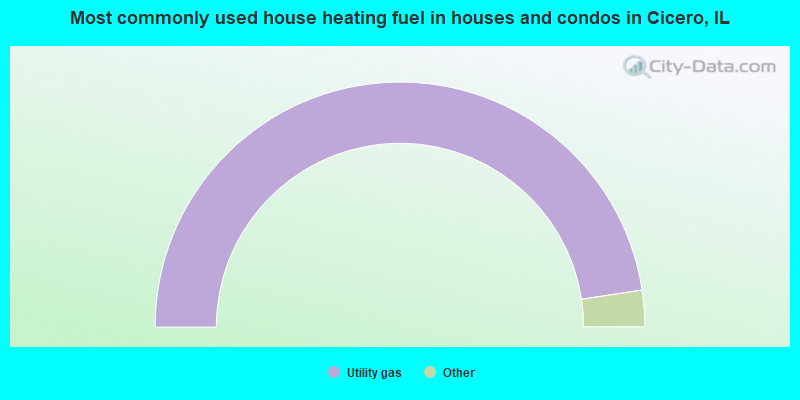
- 95.2%Utility gas
- 3.0%Electricity
- 1.5%Bottled, tank, or LP gas
- 0.1%Fuel oil, kerosene, etc.
- 0.1%Other fuel
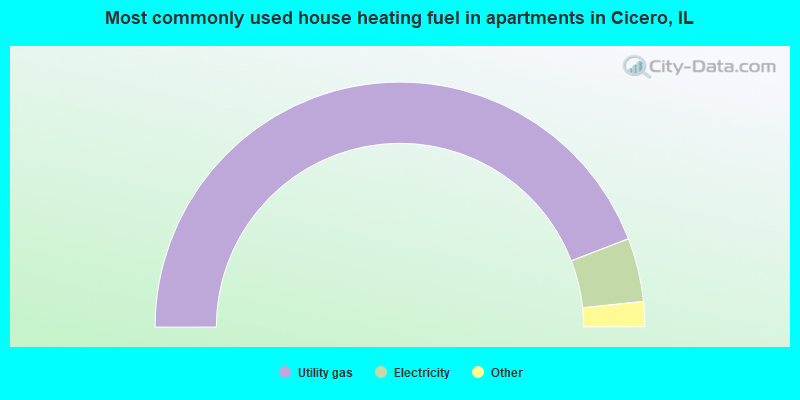
- 88.3%Utility gas
- 8.4%Electricity
- 1.3%Bottled, tank, or LP gas
- 1.1%No fuel used
- 0.7%Other fuel
- 0.2%Coal or coke
Private vs. public school enrollment:
| Here: | 8.7% |
| Illinois: | 13.3% |
| Here: | 9.5% |
| Illinois: | 9.9% |
| Here: | 29.0% |
| Illinois: | 27.4% |


