Christiansburg, VA (Virginia) Houses and Residents
| Christiansburg: | $271,121 |
| Virginia: | $365,700 |
Total population: 21,805 (Urban population: 16,446, Rural population: 530 (all nonfarm))
Houses: 10,956 (10,010 occupied: 6,127 owner occupied, 3,686 renter occupied)
| % of renters here: | 38% |
| State: | 33% |
Housing density: 787 houses/condos per square mile
Median price asked for vacant for-sale houses and condos in 2022: $152,132.
Median contract rent in 2022: $903 (lower quartile is $690, upper quartile is $1,222)
Median rent asked for vacant for-rent units in 2022: $1,867
Median gross rent in Christiansburg, VA in 2022: $1,106
Housing units in Christiansburg with a mortgage: 3,746 (396 second mortgage, 0 home equity loan, 323 both second mortgage and home equity loan)
Houses without a mortgage: 74
Median household income for houses/condos with a mortgage: $93,417
Median household income for apartments without a mortgage: $91,632
Median monthly housing costs: $1,058
Compare current foreclosures in Christiansburg, VA:
| Photo | Address | Area | Beds / Baths | Price | Details |
|---|---|---|---|---|---|

|
#1
Divine Dr
Christiansburg, VA 24073
|
3,339 sq. feet
|
3 baths 4 beds |
show details | |

|
#2
Springview Dr
Christiansburg, VA 24073
|
960 sq. feet
|
1 baths 3 beds |
show details | |

|
#3
Huckleberry St
Christiansburg, VA 24073
|
720 sq. feet
|
1 baths 2 beds |
show details | |

|
#4
Massie Dr
Christiansburg, VA 24073
|
1,872 sq. feet
|
2 baths 3 beds |
show details | |

|
#5
Mahone St # 1
Christiansburg, VA 24073
|
1,272 sq. feet
|
2 baths 4 beds |
show details | |

|
#6
Brown St
Christiansburg, VA 24073
|
846 sq. feet
|
1 baths 2 beds |
show details | |

|
#7
Victory Hts
Christiansburg, VA 24073
|
910 sq. feet
|
1 baths 2 beds |
show details | |

|
#8
Leather Rd
Christiansburg, VA 24073
|
2,352 sq. feet
|
2 baths 3 beds |
show details | |

|
#9
Cambria St NE
Christiansburg, VA 24073
|
2,196 sq. feet
|
1 baths 3 beds |
show details | |

|
#10
Mud Pike
Christiansburg, VA 24073
|
1,457 sq. feet
|
1 baths 3 beds |
show details |
| Photo | Address | Area | Beds / Baths | Price | Details |
|---|---|---|---|---|---|

|
#11
Cambria St NW
Christiansburg, VA 24073
|
2,261 sq. feet
|
2 baths 3 beds |
show details | |

|
#12
Madison Ave
Christiansburg, VA 24073
|
2,060 sq. feet
|
3 baths - beds |
show details | |

|
#13
Rainbow St Apt A1
Christiansburg, VA 24073
|
- sq. feet
|
- baths - beds |
show details | |

|
#14
Hill St NE Apt 2
Christiansburg, VA 24073
|
- sq. feet
|
- baths - beds |
show details | |

|
#15
Clearview Dr
Christiansburg, VA 24073
|
- sq. feet
|
- baths - beds |
show details | |

|
#16
Park St
Christiansburg, VA 24073
|
- sq. feet
|
- baths - beds |
show details | |

|
#17
Wimmer St
Christiansburg, VA 24073
|
- sq. feet
|
- baths - beds |
show details | |

|
#18
Gate Rd
Christiansburg, VA 24073
|
- sq. feet
|
- baths - beds |
show details | |

|
#19
Dairy Rd
Christiansburg, VA 24073
|
- sq. feet
|
- baths - beds |
show details | |

|
#20
W Main St
Christiansburg, VA 24073
|
- sq. feet
|
- baths - beds |
show details |
| Photo | Address | Area | Beds / Baths | Price | Details |
|---|---|---|---|---|---|

|
#21
Via Liberty
Christiansburg, VA 24073
|
- sq. feet
|
- baths - beds |
show details | |

|
#22
Tunnel Cir
Christiansburg, VA 24073
|
- sq. feet
|
- baths - beds |
show details | |

|
#23
Jimmy Ln
Christiansburg, VA 24073
|
- sq. feet
|
- baths - beds |
show details | |

|
#24
Dominion Dr Apt 4c
Christiansburg, VA 24073
|
- sq. feet
|
- baths - beds |
show details | |

|
#25
Montgomery St
Christiansburg, VA 24073
|
- sq. feet
|
- baths - beds |
show details | |

|
#26
Dunlap Dr
Christiansburg, VA 24073
|
- sq. feet
|
- baths - beds |
show details | |

|
#27
Virginian Dr
Christiansburg, VA 24073
|
- sq. feet
|
- baths - beds |
show details | |

|
#28
Huff Heritage Ln
Christiansburg, VA 24073
|
- sq. feet
|
- baths - beds |
show details | |

|
#29
Pin Oak Dr NW
Christiansburg, VA 24073
|
- sq. feet
|
- baths - beds |
show details | |

|
#30
Craigs Mountain Rd
Christiansburg, VA 24073
|
- sq. feet
|
- baths - beds |
show details |
| Photo | Address | Area | Beds / Baths | Price | Details |
|---|---|---|---|---|---|

|
#31
Roanoke St
Christiansburg, VA 24073
|
- sq. feet
|
- baths - beds |
show details | |

|
#32
Peppers Ferry Rd NW
Christiansburg, VA 24073
|
- sq. feet
|
- baths - beds |
show details | |

|
Check over 1 million property listings on Foreclosure.com!
|
browse all offers | |||

Latest news about housing in Christiansburg, VA collected exclusively by city-data.com from local newspapers, TV, and radio stations

 | Relocating for VA homestead/farmstead (56 replies) |
| Possible move to Staunton - Looking for info on apartments (4 replies) |
| Christiansburg / New River Valley - Hoping to Call it Home. (32 replies) |
| Relo Research for Second Trip to VA (24 replies) |
| Blacksburg-Radford-Christiansburg (3 replies) |
| Housing in Christiansburg/Blacksburg/Radford (1 reply) |

Median year apartment built: 1991
Household type by relationship:
Households: 22,841- Male householders: 5,281 (1,327 living alone), Female householders: 4,359 (1,748 living alone)
4,782 spouses (4,766 opposite-sex spouses), 561 unmarried partners, (549 opposite-sex unmarried partners), 5,951 children (5,326 natural, 294 adopted, 330 stepchildren), 333 grandchildren, 98 brothers or sisters, 187 parents, 0 foster children, 242 other relatives, 754 non-relatives
- In group quarters: 287
Size of family households: 2,830 2-persons, 1,435 3-persons, 1,294 4-persons, 444 5-persons, 272 6-persons, 125 7-or-more-persons.
Size of nonfamily households: 2,614 1-person, 785 2-persons, 54 3-persons, 17 4-persons.
3,350 married couples with children.
818 single-parent households (267 men, 551 women).
92.2% of residents of Christiansburg speak English at home.
2.2% of residents speak Spanish at home (52% speak English very well, 36% speak English well, 10% speak English not well, 2% don't speak English at all).
2.4% of residents speak other Indo-European language at home (45% speak English very well, 26% speak English well, 23% speak English not well, 6% don't speak English at all).
2.2% of residents speak Asian or Pacific Island language at home (70% speak English very well, 30% speak English well).
0.9% of residents speak other language at home (100% speak English very well).
Foreign born population: 1,397 (6.1%)
(45.6% of them are naturalized citizens)
| Here: | 6.4 |
| State: | 7.0 |
| Here: | 4.6 |
| State: | 4.3 |

- Bedrooms in owner-occupied houses and condos in Christiansburg, Virginia
- 24no bedroom
- 181 bedroom
- 1,1392 bedrooms
- 3,2353 bedrooms
- 1,4184 bedrooms
- 2945+ bedrooms

- Bedrooms in renter-occupied apartments in Christiansburg, Virginia
- 0no bedroom
- 3531 bedroom
- 1,5992 bedrooms
- 1,2593 bedrooms
- 3074 bedrooms
- 1685+ bedrooms

- Cars and other vehicles available in Christiansburg in owner-occupied houses/condos
- 28no vehicle
- 1,7751 vehicle
- 2,6832 vehicles
- 1,1543 vehicles
- 2384 vehicles
- 2495+ vehicles

- Cars and other vehicles available in Christiansburg in renter-occupied apartments
- 175no vehicle
- 1,2031 vehicle
- 1,7852 vehicles
- 3503 vehicles
- 1314 vehicles
- 435+ vehicles

- Rooms in owner-occupied houses in Christiansburg, Virginia
- 241 room
- 02 rooms
- 1423 rooms
- 6164 rooms
- 1,2395 rooms
- 1,1766 rooms
- 1,0427 rooms
- 5058 rooms
- 1,3849+ rooms

- Rooms in renter-occupied apartments in Christiansburg, Virginia
- 01 room
- 2162 rooms
- 2713 rooms
- 1,1694 rooms
- 8025 rooms
- 5916 rooms
- 1747 rooms
- 1658 rooms
- 2989+ rooms


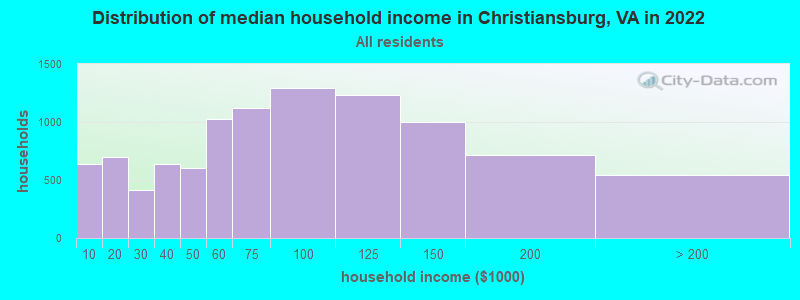
Christiansburg, VA household income distribution

- 638Less than $10,000
- 699$10,000 to $19,999
- 410$20,000 to $29,999
- 638$30,000 to $39,999
- 602$40,000 to $49,999
- 1,030$50,000 to $59,999
- 1,122$60,000 to $74,999
- 1,292$75,000 to $99,999
- 1,230$100,000 to $124,999
- 1,000$125,000 to $149,999
- 715$150,000 to $199,999
- 546$200,000 or more
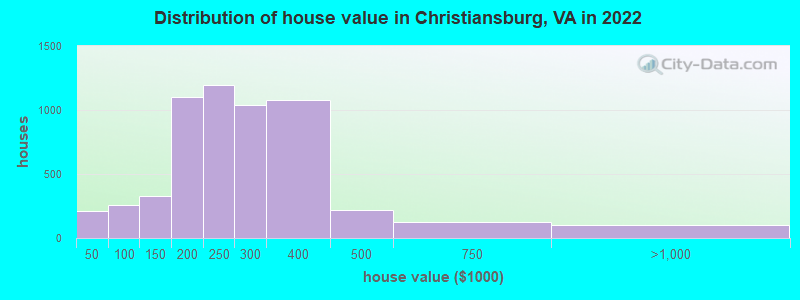
Home value of owner - occupied houses in 2022 in Christiansburg, VA
-
- 111Less than $10,000
- 38$10,000 to $14,999
- 5$15,000 to $19,999
- 17$20,000 to $24,999
- 8$30,000 to $34,999
- 31$35,000 to $39,999
- 24$50,000 to $59,999
- 42$60,000 to $69,999
- 61$70,000 to $79,999
- 53$80,000 to $89,999
- 75$90,000 to $99,999
- 193$100,000 to $124,999
- 132$125,000 to $149,999
- 578$150,000 to $174,999
- 519$175,000 to $199,999
- 1,193$200,000 to $249,999
- 1,039$250,000 to $299,999
- 1,075$300,000 to $399,999
- 222$400,000 to $499,999
- 127$500,000 to $749,999
- 84$750,000 to $999,999
- 20$1,000,000 to $1,499,999
Rent paid by renters in 2022 in Christiansburg, VA
-
- 33Less than $100
- 146$150 to $199
- 33$250 to $299
- 31$300 to $349
- 10$350 to $399
- 46$400 to $449
- 79$500 to $549
- 95$550 to $599
- 190$600 to $649
- 263$650 to $699
- 219$700 to $749
- 177$750 to $799
- 284$800 to $899
- 395$900 to $999
- 533$1,000 to $1,249
- 304$1,250 to $1,499
- 472$1,500 to $1,999
- 50$2,000 to $2,499
- 355No cash rent

Percentage of workers working in this county: 76.9%
Number of people working at home: 1,425 (12.0% of all workers)
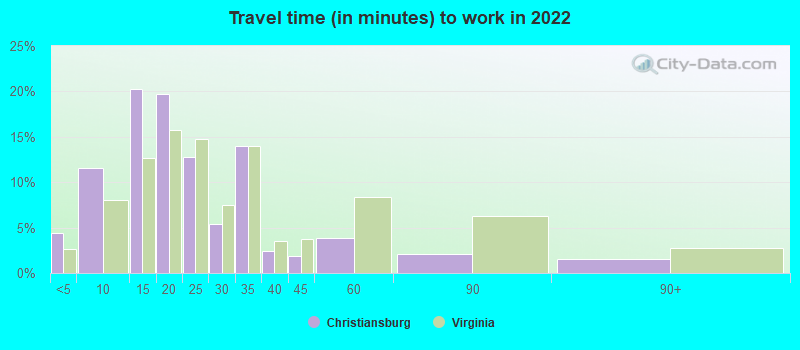
Travel time to work (commute)
- Less than 5 minutes: 471
- 5 to 9 minutes: 1,180
- 10 to 14 minutes: 2,616
- 15 to 19 minutes: 3,448
- 20 to 24 minutes: 1,424
- 25 to 29 minutes: 268
- 30 to 34 minutes: 836
- 35 to 39 minutes: 94
- 40 to 44 minutes: 333
- 45 to 59 minutes: 401
- 60 to 89 minutes: 171
- 90 or more minutes: 29
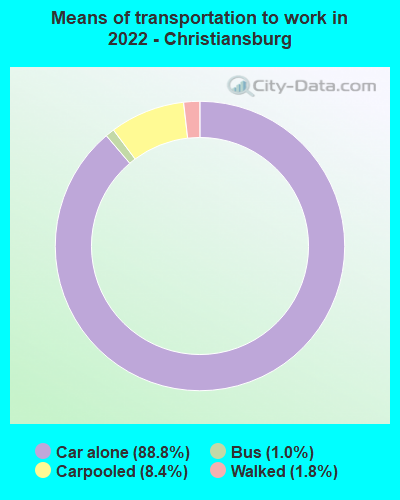
Means of transportation to work:
- Drove a car alone: 10,458 (77.7%)
- Carpooled: 1,037 (7.7%)
- Bus: 198 (1.5%)
- Walked: 182 (1.4%)
- Worked at home: 1,354 (10.1%)
- Unemployment by race in 2022
- Unemployment rate for White non-Hispanic residents
- 1.5%Males
- 1.5%Females
- Unemployment rate for American Indian and Alaska Native residents
- 100.0%Males
- Unemployment rate for Asian residents
- 1.2%Females
- Unemployment rate for two or more race residents
- 22.9%Females
- Unemployment rate for Hispanic or Latino residents
- 6.0%Males

- Year of entry for the foreign-born population in Christiansburg, Virginia
- 5812010 or later
- 2802000 to 2009
- 2341990 to 1999
- 781980 to 1989
- 421970 to 1979
- 11Before 1970

First ancestries reported:
- American: 3,432 (28.6%)
- English: 1,642 (13.7%)
- German: 1,309 (10.9%)
- Irish: 986 (8.2%)
- European: 625 (5.2%)
- Italian: 403 (3.4%)
- Scottish: 204 (1.7%)
- Egyptian: 126 (1.0%)
- Scotch-Irish: 104 (0.9%)
- Polish: 87 (0.7%)
- African: 85 (0.7%)
- British: 58 (0.5%)
- Austrian: 52 (0.4%)
- Ukrainian: 50 (0.4%)
- Russian: 30 (0.2%)
- French: 25 (0.2%)
- Hungarian: 23 (0.2%)
- French Canadian: 17 (0.1%)
- Brazilian: 16 (0.1%)
- Dutch: 14 (0.1%)
- Canadian: 10 (0.08%)
- Northern European: 10 (0.08%)
- Norwegian: 7 (0.06%)
- Welsh: 6 (0.05%)
- Arab: 4 (0.03%)
- Iranian: 4 (0.03%)
- Afghan: 1 (0.01%)
- Ethiopian: 1 (0.01%)
Most common places of birth for foreign-born residents (%):
| Christiansburg: | 21.9% (287) |
| Virginia: | 9.0% (97,830) |
| Christiansburg: | 16.8% (221) |
| Virginia: | 4.9% (52,857) |
| Christiansburg: | 10.6% (139) |
| Virginia: | 0.8% (8,186) |
| Christiansburg: | 8.7% (114) |
| Virginia: | 0.9% (9,672) |
| Christiansburg: | 6.0% (79) |
| Virginia: | 5.3% (57,498) |
| Christiansburg: | 5.9% (77) |
| Virginia: | 2.3% (24,582) |
| Christiansburg: | 4.9% (64) |
| Virginia: | 4.2% (45,750) |
| Christiansburg: | 4.0% (52) |
| Virginia: | 1.3% (14,435) |
| Christiansburg: | 2.9% (38) |
| Virginia: | 3.9% (42,989) |
| Christiansburg: | 2.1% (28) |
| Virginia: | 0.2% (2,176) |
| Christiansburg: | 1.6% (21) |
| Virginia: | 0.7% (8,081) |
| Christiansburg: | 1.6% (21) |
| Virginia: | 1.2% (12,984) |
Place of birth for U.S.-born residents:
- This state: 14,510
- Other state: 6,881
- Northeast: 1,780
- Midwest: 1,000
- South: 3,382
- West: 730
84.3% of Christiansburg residents lived in the same house 1 years ago.
Out of people who lived in different houses, 35.2% lived in this county.
Out of people who lived in different counties, 43.3% lived in Virginia.
| Christiansburg: | 84.3% |
| State average: | 86.6% |
Education attainment for males 25 years and older:
- No schooling: 12
- Nursery to 4th grade: 0
- 5th and 6th grade: 161
- 7th and 8th grade: 29
- 9th grade: 78
- 10th grade: 55
- 11th grade: 26
- 12th grade, no diploma: 59
- High school graduate (or equivalency): 2,343
- Less than 1 year of college: 365
- Some college more than 1 year, no degree: 714
- Associate degree: 571
- Bachelor's degree: 1,884
- Master's degree: 1,017
- Professional school degree: 184
- Doctorate degree: 528

Education attainment for females 25 years and older:
- No schooling: 132
- Nursery to 4th grade: 0
- 5th and 6th grade: 0
- 7th and 8th grade: 23
- 9th grade: 55
- 10th grade: 279
- 11th grade: 22
- 12th grade, no diploma: 54
- High school graduate (or equivalency): 1,457
- Less than 1 year of college: 412
- Some college more than 1 year, no degree: 1,193
- Associate degree: 692
- Bachelor's degree: 1,777
- Master's degree: 1,424
- Professional school degree: 132
- Doctorate degree: 246


Housing units in structures:
- One, detached: 6,473
- One, attached: 1,520
- Two: 663
- 3 or 4: 472
- 5 to 9: 466
- 10 to 19: 342
- 20 to 49: 32
- 50 or more: 65
- Mobile homes: 921
Housing units lacking complete kitchen facilities in 2022: 1.6%
House/condo owner moved in on average 10 years ago
Renter moved in on average 2 years ago

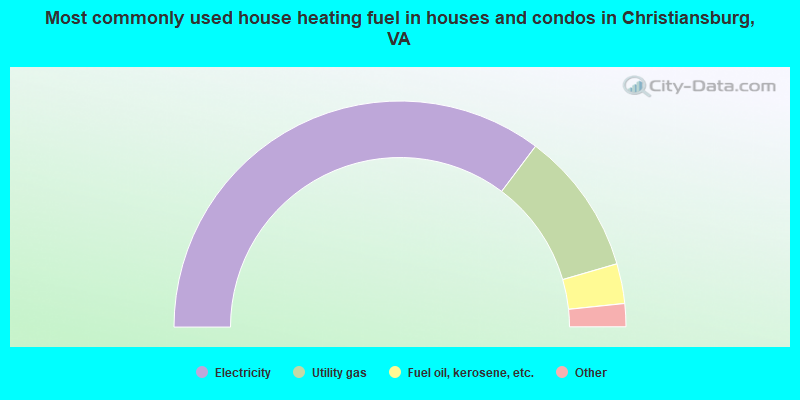
- 70.5%Electricity
- 20.5%Utility gas
- 5.7%Fuel oil, kerosene, etc.
- 1.2%Other fuel
- 1.2%Bottled, tank, or LP gas
- 0.4%Wood
- 0.3%No fuel used
- 0.2%Solar energy
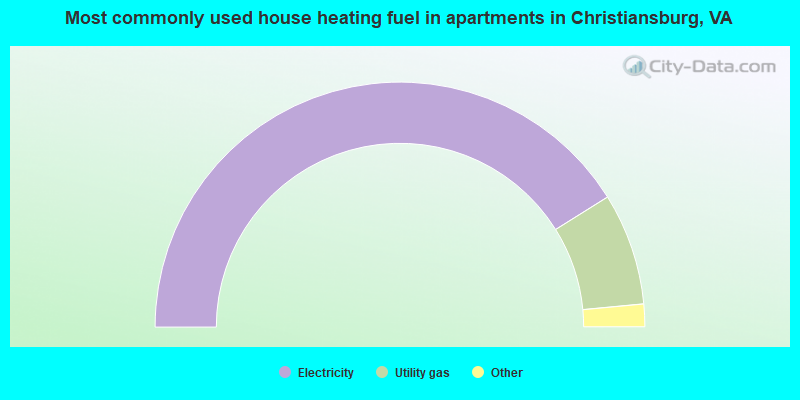
- 82.2%Electricity
- 14.8%Utility gas
- 1.7%Fuel oil, kerosene, etc.
- 1.1%No fuel used
- 0.2%Bottled, tank, or LP gas
Private vs. public school enrollment:
| Here: | 11.7% |
| Virginia: | 13.2% |
| Here: | 5.0% |
| Virginia: | 10.2% |
| Here: | 9.9% |
| Virginia: | 18.7% |


