Belmont, MA (Massachusetts) Houses and Residents
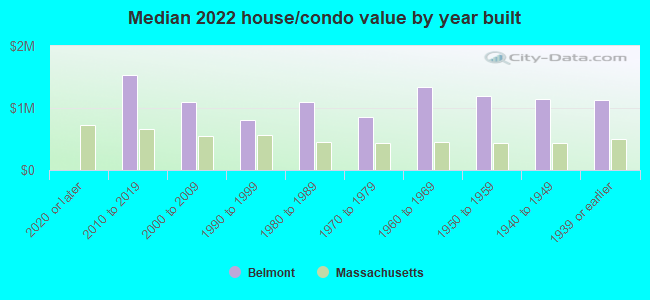
Estimated median house or condo value in 2022: $1,119,765 (it was $419,700 in 2000 )
Belmont:
$1,119,765Massachusetts:
$534,700
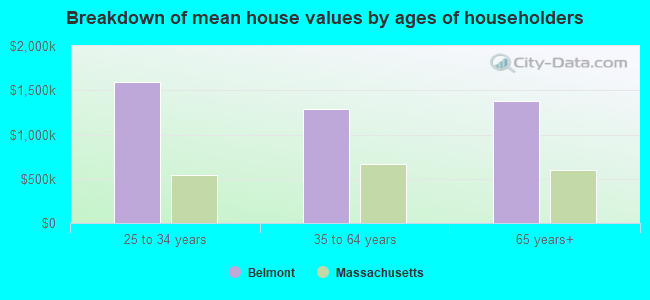
Lower value quartile - upper value quartile: $855,262 - $1,435,367Mean price in 2022: Detached houses: $1,394,908 Here:
$1,394,908State:
$651,570
Townhouses or other attached units: $1,159,209 Here:
$1,159,209State:
$617,749
In 2-unit structures: $810,910 Here:
$810,910State:
$594,808
In 3-to-4-unit structures: $659,962 Here:
$659,962State:
$601,912
In 5-or-more-unit structures: $724,420 Here:
$724,420State:
$555,768
Total population: 24,729 (Urban population: 24,194, Rural population: 0)
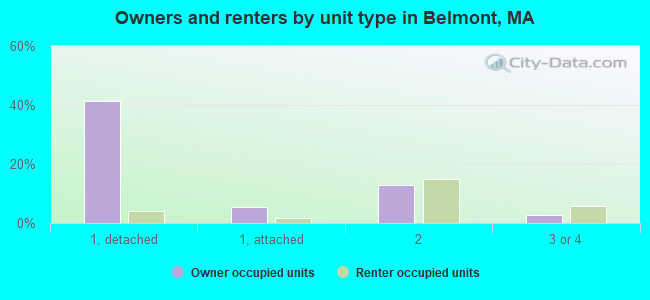
Houses: 11,006 (10,580 occupied: 6,711 owner occupied, 3,859 renter occupied )
% of renters here:
37%State:
38%
Housing density: 2,361 houses/condos per square mile
Median price asked for vacant for-sale houses and condos in 2022: $1,434,133.
Median contract rent in 2022: over $2,000 (lower quartile is $1,793, upper quartile is over $2,000)
Median rent asked for vacant for-rent units in 2022: $3,333
Median gross rent in Belmont, MA in 2022: over $2,000
Housing units in Belmont with a mortgage: 4,189 (768 second mortgage, 30 home equity loan, 671 both second mortgage and home equity loan )Houses without a mortgage: 248
Median household income for houses/condos with a mortgage: $243,233
Median household income for apartments without a mortgage: $131,783
Median monthly housing costs: $2,501
Data:
Median house or condo value ($)
Median house or condo value ($ change since 2000)
Median house or condo value ($) - White
Median house or condo value ($) - Black or African American
Median house or condo value ($) - Asian
Median house or condo value ($) - Hispanic or Latino
Median house or condo value ($) - American Indian and Alaska Native
Median house or condo value ($) - Multirace
Median house or condo value ($) - Other Race
Median price asked for mobile homes ($)
Household density (households per square mile)
Mean house or condo value by units in structure - 1, detached ($)
Mean house or condo value by units in structure - 1, attached ($)
Mean house or condo value by units in structure - 2 ($)
Mean house or condo value by units in structure by units in structure - 3 or 4 ($)
Mean house or condo value by units in structure - 5 or more ($)
Mean house or condo value by units in structure - Boat, RV, van, etc. ($)
Mean house or condo value by units in structure - Mobile home ($)
Median contract rent ($)
Median contract rent - Lower quartile ($)
Median contract rent - Upper quartile ($)
Median gross rent ($)
Urban houses (%)
Rural houses (%)
Houses occupied (%)
Houses occupied (% change since 2000)
Houses owner occupied (%)
Houses owner occupied (% change since 2000)
Houses renter occupied (%)
Houses renter occupied (% change since 2000)
Vacant housing units - For rent (%)
Vacant housing units - For rent (% change since 2000)
Vacant housing units - For sale only (%)
Vacant housing units - For sale only (% change since 2000)
Vacant housing units - Rented or sold, not occupied (%)
Vacant housing units - Rented or sold, not occupied (% change since 2000)
Vacant housing units - For seasonal, recreational, or occasional use (%)
Vacant housing units - For seasonal, recreational, or occasional use (% change since 2000)
Vacant housing units - For migrant workers (%)
Vacant housing units - For migrant workers (% change since 2000)
Vacant housing units - Other vacant (%)
Vacant housing units - Other vacant (% change since 2000)
Median monthly housing costs ($)
Median household income for houses/condos with a mortgage ($)
Median household income for houses/condos without a mortgage ($)
Median household income ($)
Median household income ($) - White
Median household income ($) - Black or African American
Median household income ($) - Asian
Median household income ($) - Hispanic or Latino
Median household income ($) - American Indian and Alaska Native
Median household income ($) - Multirace
Median household income ($) - Other Race
Mortgage status - with mortgage (%)
Mortgage status - with second mortgage (%)
Mortgage status - with home equity loan (%)
Mortgage status - with both second mortgage and home equity loan (%)
Mortgage status - without a mortgage (%)
Median year house/condo built
Median year apartment built
Household type by relationship - Male householder living alone (%)
Household type by relationship - Male householder not living alone (%)
Household type by relationship - Female householder living alone (%)
Household type by relationship - Female householder not living alone (%)
Household type by relationship - Opposite-Sex spouse (%)
Household type by relationship - Same-Sex spouse (%)
Household type by relationship - Opposite-Sex unmarried partner (%)
Household type by relationship - Same-Sex unmarried partner (%)
Household type by relationship - In group quarters (%)
Size of family households - 2-person household (%)
Size of family households - 3-person household (%)
Size of family households - 4-person household (%)
Size of family households - 5-person household (%)
Size of family households - 6-person household (%)
Size of family households - 7-or-more-person household (%)
Size of nonfamily households - 1-person household (%)
Size of nonfamily households - 2-person household (%)
Size of nonfamily households - 3-person household (%)
Size of nonfamily households - 4-person household (%)
Size of nonfamily households - 5-person household (%)
Size of nonfamily households - 6-person household (%)
Size of nonfamily households - 7-or-moreperson household (%)
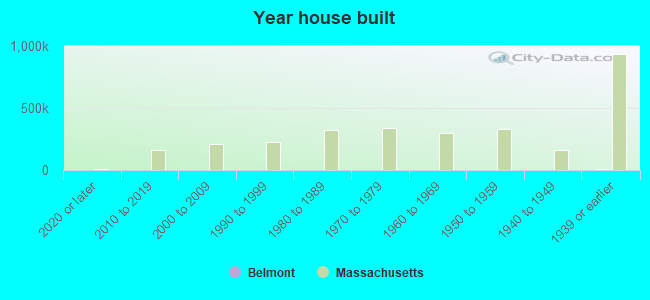
Year house built - Built 2010 or later (%)
Year house built - Built 2000 to 2009 (%)
Year house built - Built 1990 to 1999 (%)
Year house built - Built 1980 to 1989 (%)
Year house built - Built 1970 to 1979 (%)
Year house built - Built 1960 to 1969 (%)
Year house built - Built 1950 to 1959 (%)
Year house built - Built 1940 to 1949 (%)
Year house built - Built 1939 or earlier (%)
Median number of rooms in houses and condos
Median number of rooms in apartments
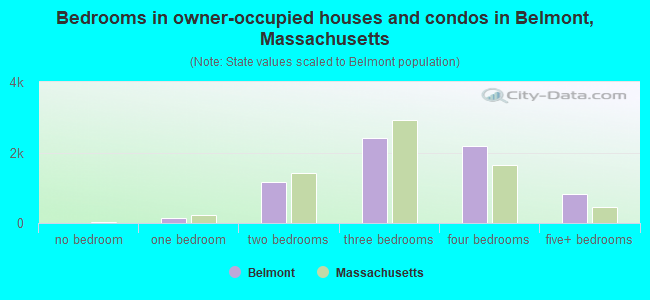
Median number of bedrooms in owner occupied houses
Mean number of bedrooms in owner occupied houses
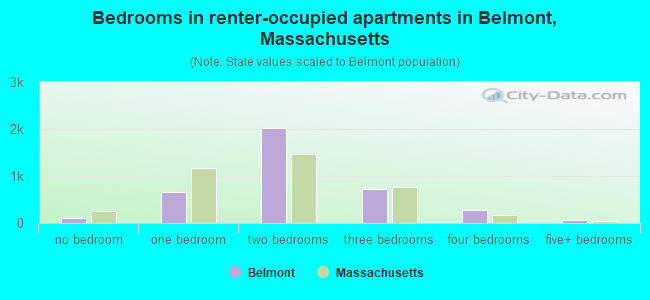
Median number of bedrooms in renter occupied houses
Mean number of bedrooms in renter occupied houses
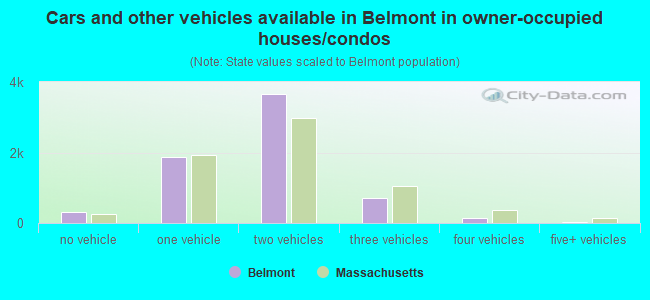
Median number of vehichles in owner occupied houses
Mean number of vehichles in owner occupied houses
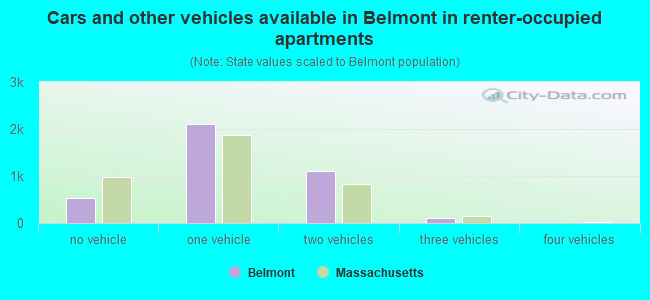
Median number of vehichles in renter occupied houses
Mean number of vehichles in renter occupied houses
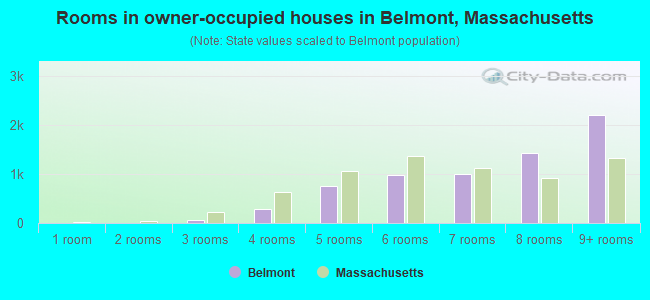
Rooms in owner-occupied houses - 1 room (%)
Rooms in owner-occupied houses - 2 rooms (%)
Rooms in owner-occupied houses - 3 rooms (%)
Rooms in owner-occupied houses - 4 rooms (%)
Rooms in owner-occupied houses - 5 rooms (%)
Rooms in owner-occupied houses - 6 rooms (%)
Rooms in owner-occupied houses - 7 rooms (%)
Rooms in owner-occupied houses - 8 rooms (%)
Rooms in owner-occupied houses - 9+ rooms (%)
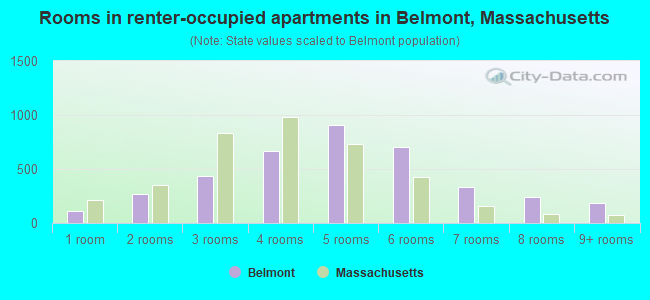
Rooms in renter-occupied houses - 1 room (%)
Rooms in renter-occupied houses - 2 rooms (%)
Rooms in renter-occupied houses - 3 rooms (%)
Rooms in renter-occupied houses - 4 rooms (%)
Rooms in renter-occupied houses - 5 rooms (%)
Rooms in renter-occupied houses - 6 rooms (%)
Rooms in renter-occupied houses - 7 rooms (%)
Rooms in renter-occupied houses - 8 rooms (%)
Rooms in renter-occupied houses - 9+ rooms (%)
Bedrooms in owner-occupied houses - no bedrooms (%)
Bedrooms in owner-occupied houses - 1 bedroom (%)
Bedrooms in owner-occupied houses - 2 bedrooms (%)
Bedrooms in owner-occupied houses - 3 bedrooms (%)
Bedrooms in owner-occupied houses - 4 bedrooms (%)
Bedrooms in owner-occupied houses - 5+ bedrooms (%)
Bedrooms in renter-occupied houses - no bedrooms (%)
Bedrooms in renter-occupied houses - 1 bedroom (%)
Bedrooms in renter-occupied houses - 2 bedrooms (%)
Bedrooms in renter-occupied houses - 3 bedrooms (%)
Bedrooms in renter-occupied houses - 4 bedrooms (%)
Bedrooms in renter-occupied houses - 5+ bedrooms (%)
Vehicles available in owner-occupied houses - no vehicle available (%)
Vehicles available in owner-occupied houses - 1 vehicle available(%)
Vehicles available in owner-occupied houses - 2 Vehicles available (%)
Vehicles available in owner-occupied houses - 3 Vehicles available (%)
Vehicles available in owner-occupied houses - 4 Vehicles available (%)
Vehicles available in owner-occupied houses - 5+ Vehicles available (%)
Vehicles available in renter-occupied houses - no vehicle available (%)
Vehicles available in renter-occupied houses - 1 vehicle available (%)
Vehicles available in renter-occupied houses - 2 Vehicles available (%)
Vehicles available in renter-occupied houses - 3 Vehicles available (%)
Vehicles available in renter-occupied houses - 4 Vehicles available (%)
Vehicles available in renter-occupied houses - 5+ Vehicles available (%)
Housing units in structures - 1, detached (%)
Housing units in structures - 1, attached (%)
Housing units in structures - 2 (%)
Housing units in structures - 3 or 4 (%)
Housing units in structures - 5 to 9 (%)
Housing units in structures - 10 to 19 (%)
Housing units in structures - 20 to 49 (%)
Housing units in structures - 50 or more (%)
Housing units in structures - Mobile home (%)
Housing units in structures - Boat, RV, van, etc. (%)
Housing units in structures - Owners - 1, detached (%)
Housing units in structures - Owners - 1, attached (%)
Housing units in structures - Owners - 2 (%)
Housing units in structures - Owners - 3 or 4 (%)
Housing units in structures - Owners - 5 to 9 (%)
Housing units in structures - Owners - 10 to 19 (%)
Housing units in structures - Owners - 20 to 49 (%)
Housing units in structures - Owners - 50 or more (%)
Housing units in structures - Owners - Mobile home (%)
Housing units in structures - Owners - Boat, RV, van, etc. (%)
Housing units in structures - Renters - 1, detached (%)
Housing units in structures - Renters - 1, attached (%)
Housing units in structures - Renters - 2 (%)
Housing units in structures - Renters - 3 or 4 (%)
Housing units in structures - Renters - 5 to 9 (%)
Housing units in structures - Renters - 10 to 19 (%)
Housing units in structures - Renters - 20 to 49 (%)
Housing units in structures - Renters - 50 or more (%)
Housing units in structures - Renters - Mobile home (%)
Housing units in structures - Renters - Boat, RV, van, etc. (%)
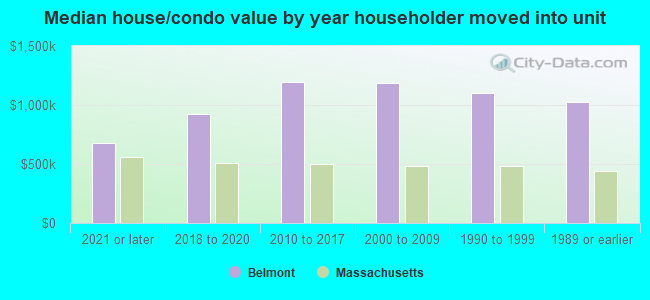
House/condo owner moved in on average (years ago)
Renter moved in on average (years ago)
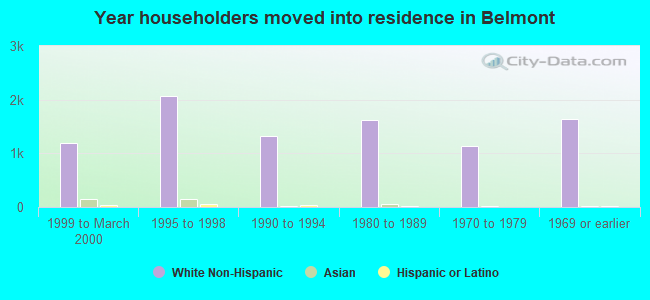
Year householder moved into unit - Moved in 1999 to March 2000 (%)
Year householder moved into unit - Moved in 1999 to March 2000 (%) - White
Year householder moved into unit - Moved in 1999 to March 2000 (%) - Black or African American
Year householder moved into unit - Moved in 1999 to March 2000 (%) - Asian
Year householder moved into unit - Moved in 1999 to March 2000 (%) - Hispanic or Latino
Year householder moved into unit - Moved in 1999 to March 2000 (%) - American Indian and Alaska Native
Year householder moved into unit - Moved in 1999 to March 2000 (%) - Multirace
Year householder moved into unit - Moved in 1999 to March 2000 (%) - Other Race
Year householder moved into unit - Moved in 1995 to 1998 (%)
Year householder moved into unit - Moved in 1995 to 1998 (%) - White
Year householder moved into unit - Moved in 1995 to 1998 (%) - Black or African American
Year householder moved into unit - Moved in 1995 to 1998 (%) - Asian
Year householder moved into unit - Moved in 1995 to 1998 (%) - Hispanic or Latino
Year householder moved into unit - Moved in 1995 to 1998 (%) - American Indian and Alaska Native
Year householder moved into unit - Moved in 1995 to 1998 (%) - Multirace
Year householder moved into unit - Moved in 1995 to 1998 (%) - Other Race
Year householder moved into unit - Moved in 1990 to 1994 (%)
Year householder moved into unit - Moved in 1990 to 1994 (%) - White
Year householder moved into unit - Moved in 1990 to 1994 (%) - Black or African American
Year householder moved into unit - Moved in 1990 to 1994 (%) - Asian
Year householder moved into unit - Moved in 1990 to 1994 (%) - Hispanic or Latino
Year householder moved into unit - Moved in 1990 to 1994 (%) - American Indian and Alaska Native
Year householder moved into unit - Moved in 1990 to 1994 (%) - Multirace
Year householder moved into unit - Moved in 1990 to 1994 (%) - Other Race
Year householder moved into unit - Moved in 1980 to 1989 (%)
Year householder moved into unit - Moved in 1980 to 1989 (%) - White
Year householder moved into unit - Moved in 1980 to 1989 (%) - Black or African American
Year householder moved into unit - Moved in 1980 to 1989 (%) - Asian
Year householder moved into unit - Moved in 1980 to 1989 (%) - Hispanic or Latino
Year householder moved into unit - Moved in 1980 to 1989 (%) - American Indian and Alaska Native
Year householder moved into unit - Moved in 1980 to 1989 (%) - Multirace
Year householder moved into unit - Moved in 1980 to 1989 (%) - Other Race
Year householder moved into unit - Moved in 1970 to 1979 (%)
Year householder moved into unit - Moved in 1970 to 1979 (%) - White
Year householder moved into unit - Moved in 1970 to 1979 (%) - Black or African American
Year householder moved into unit - Moved in 1970 to 1979 (%) - Asian
Year householder moved into unit - Moved in 1970 to 1979 (%) - Hispanic or Latino
Year householder moved into unit - Moved in 1970 to 1979 (%) - American Indian and Alaska Native
Year householder moved into unit - Moved in 1970 to 1979 (%) - Multirace
Year householder moved into unit - Moved in 1970 to 1979 (%) - Other Race
Year householder moved into unit - Moved in 1969 or earlier (%)
Year householder moved into unit - Moved in 1969 or earlier (%) - White
Year householder moved into unit - Moved in 1969 or earlier (%) - Black or African American
Year householder moved into unit - Moved in 1969 or earlier (%) - Asian
Year householder moved into unit - Moved in 1969 or earlier (%) - Hispanic or Latino
Year householder moved into unit - Moved in 1969 or earlier (%) - American Indian and Alaska Native
Year householder moved into unit - Moved in 1969 or earlier (%) - Multirace
Year householder moved into unit - Moved in 1969 or earlier (%) - Other Race
Housing units lacking complete plumbing facilities (%)
Housing units lacking complete kitchen facilities (%)
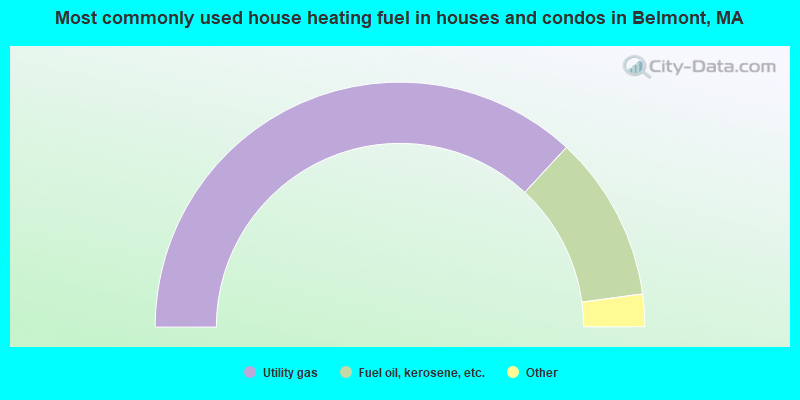
House heating fuel used in houses and condos - Utility gas (%)
House heating fuel used in houses and condos - Bottled, tank, or LP gas (%)
House heating fuel used in houses and condos - Electricity (%)
House heating fuel used in houses and condos - Fuel oil, kerosene, etc. (%)
House heating fuel used in houses and condos - Coal or coke (%)
House heating fuel used in houses and condos - Wood (%)
House heating fuel used in houses and condos - Solar energy (%)
House heating fuel used in houses and condos - Other fuel (%)
House heating fuel used in houses and condos - No fuel used (%)
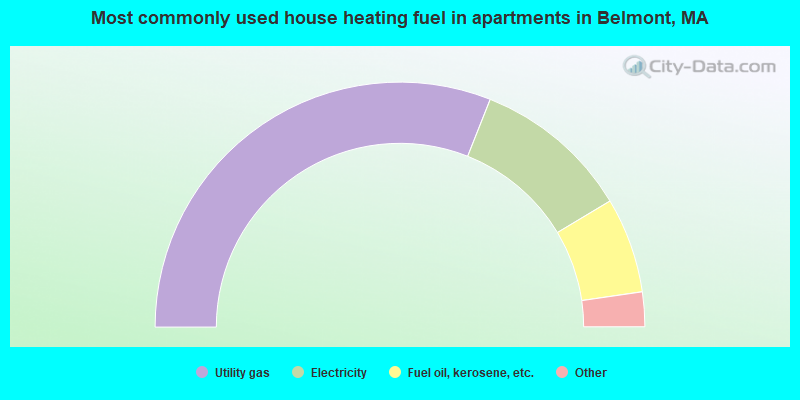
House heating fuel used in apartments - Utility gas (%)
House heating fuel used in apartments - Bottled, tank, or LP gas (%)
House heating fuel used in apartments - Electricity (%)
House heating fuel used in apartments - Fuel oil, kerosene, etc. (%)
House heating fuel used in apartments - Coal or coke (%)
House heating fuel used in apartments - Wood (%)
House heating fuel used in apartments - Solar energy (%)
House heating fuel used in apartments - Other fuel (%)
House heating fuel used in apartments - No fuel used (%)
Latest news about housing in Belmont, MA collected exclusively by city-data.com from local newspapers, TV, and radio stations
Median year house/condo built: 1938Median year apartment built: 1948Household type by relationship:
Households: 26,897
Male householders: 5,310 (703 living alone ), Female householders: 5,082 (1,678 living alone )6,513 spouses (6,467 opposite-sex spouses ), 394 unmarried partners , (361 opposite-sex unmarried partners ), 8,192 children (8,019 natural , 120 adopted , 52 stepchildren ), 110 grandchildren , 102 brothers or sisters , 482 parents , 0 foster children , 114 other relatives , 343 non-relatives In group quarters: 250
Size of family households: 2,812 2-persons , 2,298 3-persons , 1,684 4-persons , 541 5-persons , 171 6-persons , 36 7-or-more-persons .
Size of nonfamily households: 2,483 1-person , 478 2-persons , 17 3-persons , 9 4-persons .
5,607 married couples with children. single-parent households (213 men , 450 women ).
68.0% of residents of Belmont speak English at home. of residents speak Spanish at home (82% speak English very well , 15% speak English well , 2% speak English not well , 1% don't speak English at all ).of residents speak other Indo-European language at home (79% speak English very well , 14% speak English well , 6% speak English not well , 1% don't speak English at all ).of residents speak Asian or Pacific Island language at home (64% speak English very well , 21% speak English well , 9% speak English not well , 7% don't speak English at all ).of residents speak other language at home (86% speak English very well , 5% speak English well , 8% speak English not well ).
Foreign born population: 7,153 (26.6%)of them are naturalized citizens )
Median number of rooms in houses and condos:
Median number of rooms in apartments
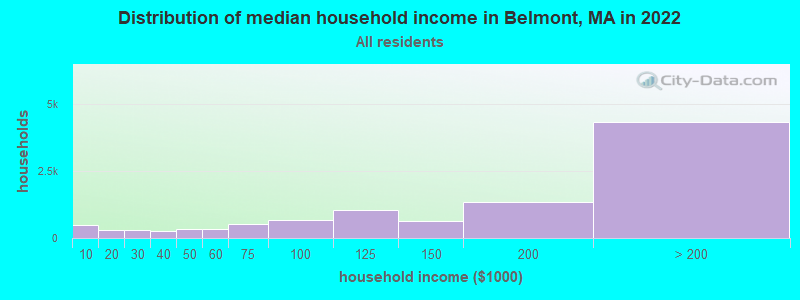
Belmont, MA household income distribution 500 Less than $10,000283 $10,000 to $19,999286 $20,000 to $29,999244 $30,000 to $39,999318 $40,000 to $49,999323 $50,000 to $59,999524 $60,000 to $74,999671 $75,000 to $99,9991,065 $100,000 to $124,999641 $125,000 to $149,9991,357 $150,000 to $199,9994,338 $200,000 or more
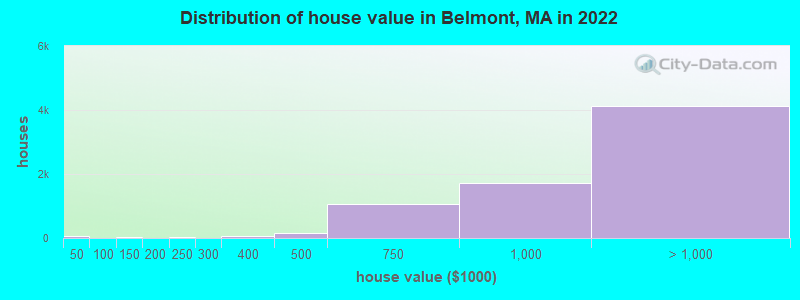
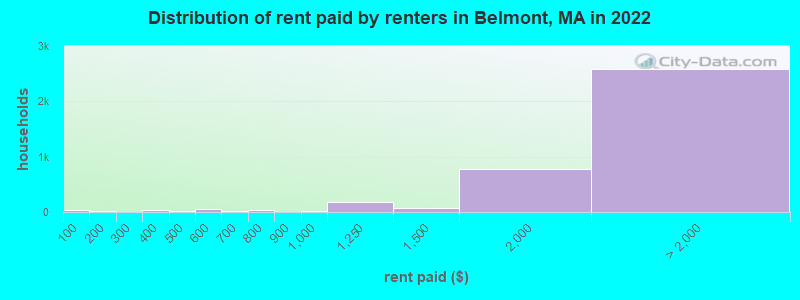
Home value of owner - occupied houses in 2022 in Belmont, MA 50 Less than $10,00014 $100,000 to $124,9991 $125,000 to $149,99910 $150,000 to $174,99916 $200,000 to $249,99969 $300,000 to $399,999157 $400,000 to $499,9991,076 $500,000 to $749,9991,725 $750,000 to $999,9992,455 $1,000,000 to $1,499,9991,010 $1,500,000 to $1,999,999671 $2,000,000 or moreRent paid by renters in 2022 in Belmont, MA 36 Less than $10011 $100 to $1499 $250 to $29935 $300 to $3498 $350 to $39916 $400 to $44932 $500 to $54912 $550 to $59917 $650 to $69926 $700 to $74912 $750 to $7994 $800 to $89918 $900 to $999172 $1,000 to $1,24964 $1,250 to $1,499781 $1,500 to $1,9991,434 $2,000 to $2,499361 $2,500 to $2,999270 $3,000 to $3,499335 $3,500 or more189 No cash rent
Percentage of workers working in this county: 74.7%Number of people working at home: 4,401 (31.5% of all workers )
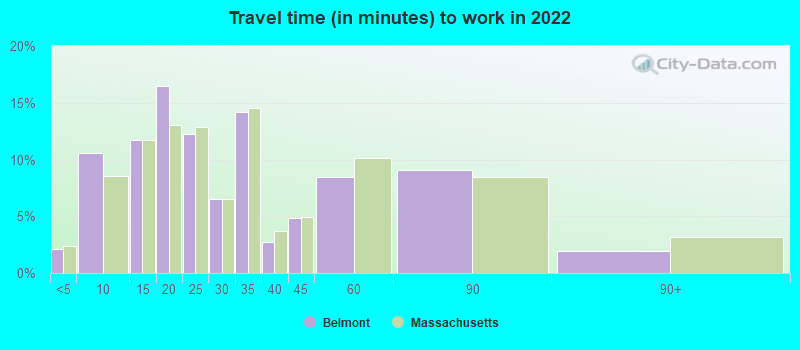
Travel time to work (commute)
Less than 5 minutes: 1375 to 9 minutes: 68310 to 14 minutes: 67715 to 19 minutes: 1,00620 to 24 minutes: 1,35225 to 29 minutes: 93630 to 34 minutes: 1,94935 to 39 minutes: 51940 to 44 minutes: 63845 to 59 minutes: 1,28560 to 89 minutes: 60090 or more minutes: 74
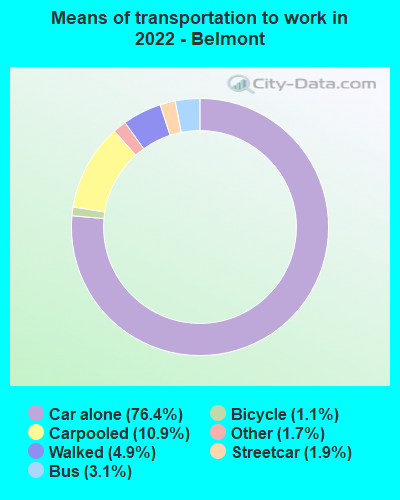
Means of transportation to work:
Drove a car alone: 5,456 (49.2%)Carpooled: 817 (7.4%)Bus : 175 (1.6%)Subway or elevated rail : 137 (1.2%)Taxi: 156 (1.4%)Bicycle: 101 (0.9%)Walked: 362 (3.3%)Worked at home: 4,401 (39.7%)
Unemployment by race in 2022
Unemployment rate for White non-Hispanic residents 3.5% Males3.3% FemalesUnemployment rate for Black residents 12.2% Males7.5% FemalesUnemployment rate for American Indian and Alaska Native residents 100.0% FemalesUnemployment rate for Asian residents 0.8% Males3.5% FemalesUnemployment rate for two or more race residents 0.8% Males6.1% FemalesUnemployment rate for Hispanic or Latino residents 2.2% Females
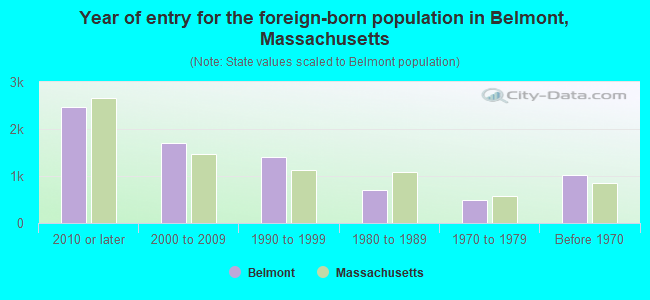
Year of entry for the foreign-born population in Belmont, Massachusetts
2,464 2010 or later 1,704 2000 to 2009 1,412 1990 to 1999 696 1980 to 1989 486 1970 to 1979 1,011 Before 1970
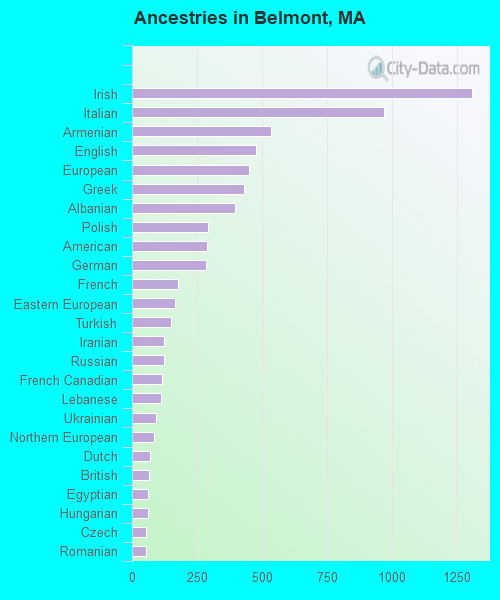
First ancestries reported:
Irish: 1,309 (10.1%)
Italian: 969 (7.5%)
Armenian: 537 (4.1%)
English: 478 (3.7%)
European: 449 (3.5%)
Greek: 432 (3.3%)
Albanian: 395 (3.0%)
Polish: 291 (2.2%)
American: 288 (2.2%)
German: 285 (2.2%)
French: 179 (1.4%)
Eastern European: 166 (1.3%)
Turkish: 151 (1.2%)
Iranian: 125 (1.0%)
Russian: 123 (0.9%)
French Canadian: 115 (0.9%)
Lebanese: 111 (0.9%)
Ukrainian: 93 (0.7%)
Northern European: 84 (0.6%)
Dutch: 69 (0.5%)
British: 66 (0.5%)
Egyptian: 62 (0.5%)
Hungarian: 62 (0.5%)
Czech: 55 (0.4%)
Romanian: 53 (0.4%)
Brazilian: 51 (0.4%)
Portuguese: 44 (0.3%)
Israeli: 38 (0.3%)
Jamaican: 37 (0.3%)
Scottish: 35 (0.3%)
Sudanese: 33 (0.3%)
Swiss: 32 (0.2%)
Lithuanian: 32 (0.2%)
Scandinavian: 32 (0.2%)
Swedish: 32 (0.2%)
Croatian: 31 (0.2%)
Austrian: 29 (0.2%)
Norwegian: 28 (0.2%)
Yugoslavian: 26 (0.2%)
Scotch-Irish: 21 (0.2%)
African: 19 (0.1%)
Macedonian: 18 (0.1%)
Danish: 14 (0.1%)
Ethiopian: 14 (0.1%)
Cypriot: 14 (0.1%)
Serbian: 12 (0.09%)
Estonian: 11 (0.08%)
Canadian: 10 (0.08%)
Arab: 10 (0.08%)
Syrian: 9 (0.07%)
Ghanaian: 9 (0.07%)
Australian: 3 (0.02%)
British West Indian: 3 (0.02%)
Palestinian: 2 (0.02%)
Most common places of birth for foreign-born residents (%): China, excluding Hong Kong and Taiwan Belmont:
20.7% (1,484)Massachusetts:
8.4% (103,233)
India Belmont:
7.0% (501)Massachusetts:
6.8% (82,934)
Albania Belmont:
6.0% (426)Massachusetts:
1.1% (13,076)
Korea Belmont:
5.9% (424)Massachusetts:
1.4% (17,613)
Jamaica Belmont:
3.9% (282)Massachusetts:
1.7% (21,468)
Armenia Belmont:
3.1% (221)Massachusetts:
0.2% (2,307)
Japan Belmont:
3.0% (212)Massachusetts:
0.6% (7,301)
Turkey Belmont:
2.9% (210)Massachusetts:
0.4% (5,208)
France Belmont:
2.5% (178)Massachusetts:
0.6% (7,364)
Canada Belmont:
2.3% (165)Massachusetts:
2.3% (28,158)
Germany Belmont:
2.3% (163)Massachusetts:
1.0% (12,529)
Russia Belmont:
2.2% (159)Massachusetts:
1.5% (18,278)
Taiwan Belmont:
2.1% (150)Massachusetts:
0.7% (8,270)
Italy Belmont:
1.8% (126)Massachusetts:
1.4% (16,886)
Iran Belmont:
1.6% (118)Massachusetts:
0.6% (7,213)
Greece Belmont:
1.6% (112)Massachusetts:
0.8% (10,043)
Colombia Belmont:
1.5% (110)Massachusetts:
2.3% (27,810)
Place of birth for U.S.-born residents:
This state: 11,774Other state: 7,638Northeast: 3,565Midwest: 1,383South: 1,364West: 1,302 87.3% of Belmont residents lived in the same house 1 years ago.
Out of people who lived in different houses, 30.8% lived in this county.
Out of people who lived in different counties, 27.2% lived in Massachusetts.
Belmont:
87.3%State average:
87.7%
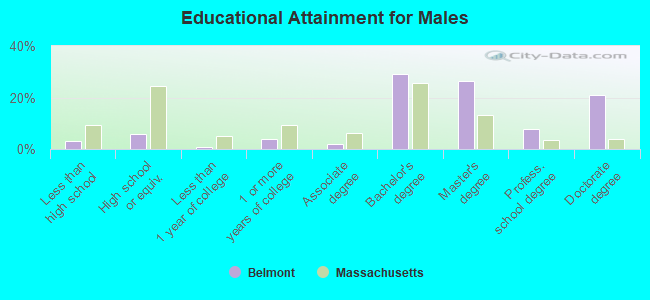
Education attainment for males 25 years and older:
No schooling: 53Nursery to 4th grade: 05th and 6th grade: 217th and 8th grade: 649th grade: 510th grade: 4011th grade: 1212th grade, no diploma: 74High school graduate (or equivalency): 539Less than 1 year of college: 66Some college more than 1 year, no degree: 347Associate degree: 183Bachelor's degree: 2,634Master's degree: 2,397Professional school degree: 699Doctorate degree: 1,879
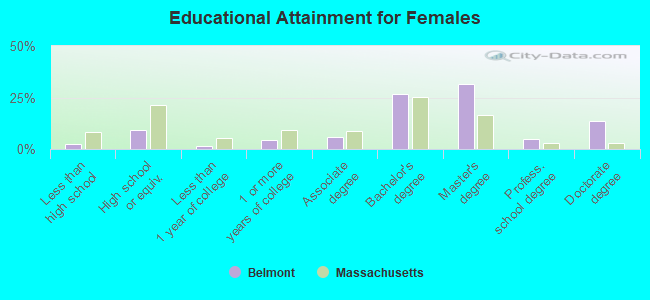
Education attainment for females 25 years and older:
No schooling: 56Nursery to 4th grade: 115th and 6th grade: 267th and 8th grade: 329th grade: 1410th grade: 3011th grade: 1312th grade, no diploma: 58High school graduate (or equivalency): 946Less than 1 year of college: 167Some college more than 1 year, no degree: 440Associate degree: 579Bachelor's degree: 2,719Master's degree: 3,207Professional school degree: 497Doctorate degree: 1,358
Housing units in structures:
One, detached: 5,034One, attached: 726Two: 3,2143 or 4: 9515 to 9: 15910 to 19: 17720 to 49: 23750 or more: 505Housing units lacking complete plumbing facilities in 2022: 0.1%Housing units lacking complete kitchen facilities in 2022: 0.4%House/condo owner moved in on average 16 years ago
Renter moved in on average 4 years ago
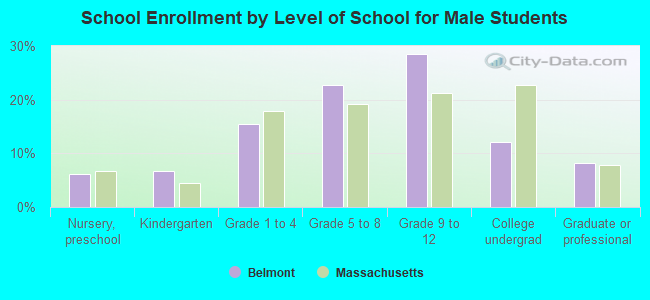
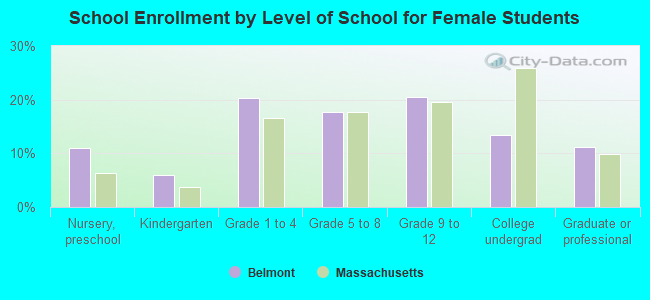
Private vs. public school enrollment:
Students in private schools in grades 1 to 8 (elementary and middle school): 339 Here:
11.8%Massachusetts:
10.3%
Students in private schools in grades 9 to 12 (high school): 203 Here:
11.2%Massachusetts:
12.3%
Students in private undergraduate colleges: 631 Here:
65.4%Massachusetts:
51.2%