Belleville, NJ (New Jersey) Houses and Residents
| Belleville: | $389,458 |
| New Jersey: | $428,900 |
Total population: 34,877 (All urban)
Houses: 14,144 (13,731 occupied: 6,995 owner occupied, 6,736 renter occupied)
| % of renters here: | 49% |
| State: | 35% |
Housing density: 4,230 houses/condos per square mile
Median price asked for vacant for-sale houses and condos in 2022 in this county: $231,294.
Median contract rent in 2022: $1,379 (lower quartile is $1,219, upper quartile is $1,799)
Median rent asked for vacant for-rent units in 2022: $1,488
Median gross rent in Belleville, NJ in 2022: $1,532
Housing units in Belleville with a mortgage: 3,107 (295 second mortgage, 302 home equity loan, 0 both second mortgage and home equity loan)
Houses without a mortgage: 1,743
Compare current foreclosures in Belleville, NJ:
| Photo | Address | Area | Beds / Baths | Price | Details |
|---|---|---|---|---|---|

|
#1
Joralemon St
Belleville, NJ 07109
|
592 sq. feet
|
1 baths 2 beds |
show details | |

|
#2
Magnolia St
Belleville, NJ 07109
|
1,536 sq. feet
|
- baths - beds |
show details | |

|
#3
Mount Pleasant Ave
Belleville, NJ 07109
|
2,553 sq. feet
|
- baths - beds |
show details | |

|
#4
Hamilton St
Belleville, NJ 07109
|
1,801 sq. feet
|
- baths - beds |
show details | |

|
#5
Crestwood Ave
Belleville, NJ 07109
|
1,316 sq. feet
|
- baths - beds |
show details | |

|
#6
William St Apt 7
Belleville, NJ 07109
|
- sq. feet
|
- baths - beds |
show details | |

|
#7
Montgomery Pl
Belleville, NJ 07109
|
1,836 sq. feet
|
- baths - beds |
show details | |

|
#8
Gregory Ter
Belleville, NJ 07109
|
1,289 sq. feet
|
- baths - beds |
show details | |

|
#9
Madison St
Belleville, NJ 07109
|
768 sq. feet
|
- baths - beds |
show details | |

|
#10
Adelaide St
Belleville, NJ 07109
|
1,510 sq. feet
|
- baths - beds |
show details |
| Photo | Address | Area | Beds / Baths | Price | Details |
|---|---|---|---|---|---|

|
#11
High St
Belleville, NJ 07109
|
- sq. feet
|
- baths - beds |
show details | |

|
#12
Hill St
Belleville, NJ 07109
|
- sq. feet
|
- baths - beds |
show details | |

|
#13
High St
Belleville, NJ 07109
|
- sq. feet
|
- baths - beds |
show details | |

|
#14
Linden Ave
Belleville, NJ 07109
|
- sq. feet
|
- baths - beds |
show details | |

|
#15
Passaic Ave
Belleville, NJ 07109
|
3,082 sq. feet
|
- baths - beds |
show details | |

|
#16
Rutgers St
Belleville, NJ 07109
|
1,480 sq. feet
|
- baths - beds |
show details | |

|
#17
Main St
Belleville, NJ 07109
|
- sq. feet
|
- baths - beds |
show details | |

|
#18
Little St
Belleville, NJ 07109
|
- sq. feet
|
- baths - beds |
show details | |

|
#19
Union Ave
Belleville, NJ 07109
|
2,296 sq. feet
|
- baths - beds |
show details | |

|
#20
Franklin St
Belleville, NJ 07109
|
- sq. feet
|
- baths - beds |
show details |
| Photo | Address | Area | Beds / Baths | Price | Details |
|---|---|---|---|---|---|

|
#21
Holmes St
Belleville, NJ 07109
|
3,091 sq. feet
|
- baths - beds |
show details | |

|
#22
Bell St
Belleville, NJ 07109
|
- sq. feet
|
- baths - beds |
show details | |

|
#23
Rutgers St Apt A6
Belleville, NJ 07109
|
- sq. feet
|
- baths - beds |
show details | |

|
#24
Rutgers St Apt 11
Belleville, NJ 07109
|
- sq. feet
|
- baths - beds |
show details | |

|
#25
Salter Pl
Belleville, NJ 07109
|
1,397 sq. feet
|
- baths - beds |
show details | |

|
#26
Ralph St
Belleville, NJ 07109
|
1,824 sq. feet
|
- baths - beds |
show details | |

|
#27
White Oak Ter
Belleville, NJ 07109
|
1,251 sq. feet
|
- baths - beds |
show details | |

|
#28
S Carpenter Ter Apt 1r
Belleville, NJ 07109
|
- sq. feet
|
- baths - beds |
show details | |

|
#29
Belleville Ave
Belleville, NJ 07109
|
- sq. feet
|
- baths - beds |
show details | |

|
#30
Franklin Ave
Belleville, NJ 07109
|
- sq. feet
|
- baths - beds |
show details |
| Photo | Address | Area | Beds / Baths | Price | Details |
|---|---|---|---|---|---|

|
#31
Branch Brook Dr
Belleville, NJ 07109
|
- sq. feet
|
- baths - beds |
show details | |

|
#32
Washington Ave
Belleville, NJ 07109
|
- sq. feet
|
- baths - beds |
show details | |

|
#33
Washington Ave
Belleville, NJ 07109
|
- sq. feet
|
- baths - beds |
show details | |

|
#34
Continental Ave
Belleville, NJ 07109
|
- sq. feet
|
- baths - beds |
show details | |

|
#35
Joralemon St
Belleville, NJ 07109
|
- sq. feet
|
- baths - beds |
show details | |

|
#36
Jefferson St
Belleville, NJ 07109
|
- sq. feet
|
- baths - beds |
show details | |

|
#37
Ralph St
Belleville, NJ 07109
|
- sq. feet
|
- baths - beds |
show details | |

|
#38
Davidson St Apt 28
Belleville, NJ 07109
|
- sq. feet
|
- baths - beds |
show details | |

|
#39
Main St, Unit 2-e
Belleville, NJ 07109
|
- sq. feet
|
- baths - beds |
show details | |

|
#40
Heckel St
Belleville, NJ 07109
|
- sq. feet
|
- baths - beds |
show details |
| Photo | Address | Area | Beds / Baths | Price | Details |
|---|---|---|---|---|---|

|
#41
Passaic Ave Apt 1l
Belleville, NJ 07109
|
- sq. feet
|
- baths - beds |
show details | |

|
#42
Mill St
Belleville, NJ 07109
|
- sq. feet
|
- baths - beds |
show details | |

|
#43
Brighton Ave Apt 2d
Belleville, NJ 07109
|
- sq. feet
|
- baths - beds |
show details | |

|
#44
Rossmore Pl # 2
Belleville, NJ 07109
|
- sq. feet
|
- baths - beds |
show details | |

|
#45
Heckel St
Belleville, NJ 07109
|
1,961 sq. feet
|
- baths - beds |
show details | |

|
#46
Belmont Ave # 319
Belleville, NJ 07109
|
- sq. feet
|
- baths - beds |
show details | |

|
#47
Mill St
Belleville, NJ 07109
|
- sq. feet
|
- baths - beds |
show details | |

|
#48
Main St
Belleville, NJ 07109
|
- sq. feet
|
- baths - beds |
show details | |

|
#49
Joralemon St Apt D5
Belleville, NJ 07109
|
- sq. feet
|
- baths - beds |
show details | |

|
Check over 1 million property listings on Foreclosure.com!
|
browse all offers | |||
Latest news about housing in Belleville, NJ collected exclusively by city-data.com from local newspapers, TV, and radio stations


Household type by relationship:
Households: 760,197- In family households: 645,040 (104,343 male householders, 84,996 female householders)
113,673 spouses, 245,726 children (232,723 natural, 5,793 adopted, 7,210 stepchildren), 20,627 grandchildren, 15,422 brothers or sisters, 11,923 parents, foster children, 19,910 other relatives, 22,762 non-relatives
- In nonfamily households: 115,157 (42,135 male householders (33,262 living alone)), 52,238 female householders (45,266 living alone)), 20,784 nonrelatives
- In group quarters: 23,772 (12,126 institutionalized population)
108,634 married couples with children.
65,899 single-parent households (10,059 men, 55,840 women).
57.4% of residents of Belleville speak English at home.
21.1% of residents speak Spanish at home (62% speak English very well, 22% speak English well, 13% speak English not well, 3% don't speak English at all).
12.1% of residents speak other Indo-European language at home (61% speak English very well, 25% speak English well, 12% speak English not well, 3% don't speak English at all).
8.2% of residents speak Asian or Pacific Island language at home (67% speak English very well, 23% speak English well, 9% speak English not well, 2% don't speak English at all).
1.1% of residents speak other language at home (67% speak English very well, 30% speak English well, 3% speak English not well).
Foreign born population: 14,273 (37.1%)
(62.0% of them are naturalized citizens)
| Here: | 6.7 |
| State: | 6.8 |
| Here: | 4.1 |
| State: | 3.9 |

- Bedrooms in owner-occupied houses and condos in Belleville, New Jersey
- 25no bedroom
- 4741 bedroom
- 1,9092 bedrooms
- 3,1643 bedrooms
- 1,0934 bedrooms
- 3305+ bedrooms

- Bedrooms in renter-occupied apartments in Belleville, New Jersey
- 173no bedroom
- 3,0601 bedroom
- 2,6322 bedrooms
- 7633 bedrooms
- 864 bedrooms
- 225+ bedrooms

- Cars and other vehicles available in Belleville in owner-occupied houses/condos
- 664no vehicle
- 2,2911 vehicle
- 2,6762 vehicles
- 9503 vehicles
- 2914 vehicles
- 1235+ vehicles

- Cars and other vehicles available in Belleville in renter-occupied apartments
- 1,032no vehicle
- 3,8151 vehicle
- 1,6462 vehicles
- 2003 vehicles
- 194 vehicles
- 245+ vehicles

- Rooms in owner-occupied houses in Belleville, New Jersey
- 181 room
- 822 rooms
- 2733 rooms
- 6824 rooms
- 1,3555 rooms
- 1,9726 rooms
- 1,4807 rooms
- 5608 rooms
- 5739+ rooms

- Rooms in renter-occupied apartments in Belleville, New Jersey
- 1141 room
- 6462 rooms
- 2,0933 rooms
- 1,8774 rooms
- 1,3915 rooms
- 4176 rooms
- 1017 rooms
- 528 rooms
- 459+ rooms


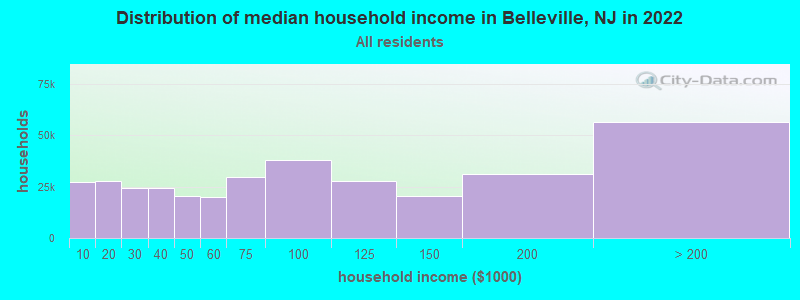
Belleville, NJ household income distribution

- 27,362Less than $10,000
- 27,791$10,000 to $19,999
- 24,514$20,000 to $29,999
- 24,283$30,000 to $39,999
- 20,391$40,000 to $49,999
- 19,884$50,000 to $59,999
- 29,460$60,000 to $74,999
- 38,163$75,000 to $99,999
- 27,566$100,000 to $124,999
- 20,485$125,000 to $149,999
- 30,966$150,000 to $199,999
- 56,478$200,000 or more
Percentage of workers working in this county: 54.4%
Number of people working at home: 3,195 (15.4% of all workers)
Travel time to work (commute)
- Less than 5 minutes: 384
- 5 to 9 minutes: 1,301
- 10 to 14 minutes: 1,947
- 15 to 19 minutes: 2,416
- 20 to 24 minutes: 2,516
- 25 to 29 minutes: 1,043
- 30 to 34 minutes: 3,031
- 35 to 39 minutes: 548
- 40 to 44 minutes: 663
- 45 to 59 minutes: 1,384
- 60 to 89 minutes: 1,097
- 90 or more minutes: 335
Means of transportation to work:
- Drove a car alone: 12,946 (77.1%)
- Carpooled: 1,940 (11.6%)
- Bus or trolley bus: 812 (4.8%)
- Streetcar or trolley car: 9 (0.1%)
- Subway or elevated: 223 (1.3%)
- Railroad: 156 (0.9%)
- Taxi: 26 (0.2%)
- Bicycle: 17 (0.1%)
- Walked: 435 (2.6%)
- Other means: 101 (0.6%)
- Worked at home: 126 (0.8%)


- Year of entry for the foreign-born population in Belleville, New Jersey
- 1,9201995 to March 2000
- 2,1161990 to 1994
- 1,5931985 to 1989
- 1,0531980 to 1984
- 8881975 to 1979
- 6301970 to 1974
- 4621965 to 1969
- 976Before 1965

First ancestries reported:
- Other: 14,627 (37.8%)
- Italian: 11,115 (28.7%)
- Irish: 3,371 (8.7%)
- German: 2,463 (6.4%)
- Polish: 1,611 (4.2%)
- United States: 918 (2.4%)
- English: 784 (2.0%)
- Portuguese: 610 (1.6%)
- Arab: 392 (1.0%)
- West Indian: 385 (1.0%)
- French: 294 (0.8%)
- Russian: 253 (0.7%)
- Hungarian: 229 (0.6%)
- Scottish: 228 (0.6%)
- Subsaharan African: 199 (0.5%)
- Dutch: 182 (0.5%)
- Greek: 164 (0.4%)
- Scotch-Irish: 151 (0.4%)
- Czech: 139 (0.4%)
- Ukrainian: 122 (0.3%)
- Lithuanian: 118 (0.3%)
- French Canadian: 103 (0.3%)
- Welsh: 96 (0.2%)
- Slovak: 47 (0.1%)
- Norwegian: 41 (0.1%)
- Swedish: 37 (0.10%)
- Swiss: 31 (0.08%)
- Danish: 14 (0.04%)
Most common places of birth for foreign-born residents (%):
| Belleville: | 17.0% (1,639) |
| New Jersey: | 4.7% (69,773) |
| Belleville: | 14.0% (1,349) |
| New Jersey: | 3.6% (53,482) |
| Belleville: | 10.2% (983) |
| New Jersey: | 4.0% (58,395) |
| Belleville: | 6.2% (597) |
| New Jersey: | 8.1% (119,497) |
| Belleville: | 4.3% (415) |
| New Jersey: | 3.7% (55,241) |
| Belleville: | 3.9% (372) |
| New Jersey: | 0.9% (13,337) |
| Belleville: | 3.8% (366) |
| New Jersey: | 3.1% (45,151) |
| Belleville: | 3.3% (314) |
| New Jersey: | 4.7% (69,754) |
| Belleville: | 2.8% (274) |
| New Jersey: | 6.2% (91,316) |
| Belleville: | 2.8% (271) |
| New Jersey: | 2.5% (37,183) |
| Belleville: | 2.4% (228) |
| New Jersey: | 1.5% (22,097) |
| Belleville: | 1.7% (167) |
| New Jersey: | 1.1% (16,052) |
| Belleville: | 1.7% (160) |
| New Jersey: | 0.6% (8,941) |
| Belleville: | 1.6% (153) |
| New Jersey: | 2.7% (40,092) |
Place of birth for U.S.-born residents:
- This state: 21,080
- Other state: 3,871
- Northeast: 2,842
- Midwest: 264
- South: 636
- West: 129
61% of Belleville residents lived in the same house 5 years ago.
Out of people who lived in different houses, 65% lived in this county.
Out of people who lived in different counties, 73% lived in New Jersey.
Education attainment for males 25 years and older:
- No schooling: 122
- Nursery to 4th grade: 121
- 5th and 6th grade: 206
- 7th and 8th grade: 399
- 9th grade: 245
- 10th grade: 291
- 11th grade: 308
- 12th grade, no diploma: 640
- High school graduate (or equivalency): 4,046
- Less than 1 year of college: 788
- Some college more than 1 year, no degree: 1,520
- Associate degree: 374
- Bachelor's degree: 1,938
- Master's degree: 541
- Professional school degree: 205
- Doctorate degree: 26

Education attainment for females 25 years and older:
- No schooling: 236
- Nursery to 4th grade: 126
- 5th and 6th grade: 222
- 7th and 8th grade: 697
- 9th grade: 261
- 10th grade: 430
- 11th grade: 423
- 12th grade, no diploma: 749
- High school graduate (or equivalency): 4,724
- Less than 1 year of college: 761
- Some college more than 1 year, no degree: 1,354
- Associate degree: 610
- Bachelor's degree: 2,030
- Master's degree: 534
- Professional school degree: 160
- Doctorate degree: 27


Housing units in structures:
- One, detached: 5,205
- One, attached: 538
- Two: 3,240
- 3 or 4: 1,593
- 5 to 9: 896
- 10 to 19: 1,198
- 20 to 49: 858
- 50 or more: 606
- Mobile homes: 10
Housing units lacking complete kitchen facilities: 0.5%

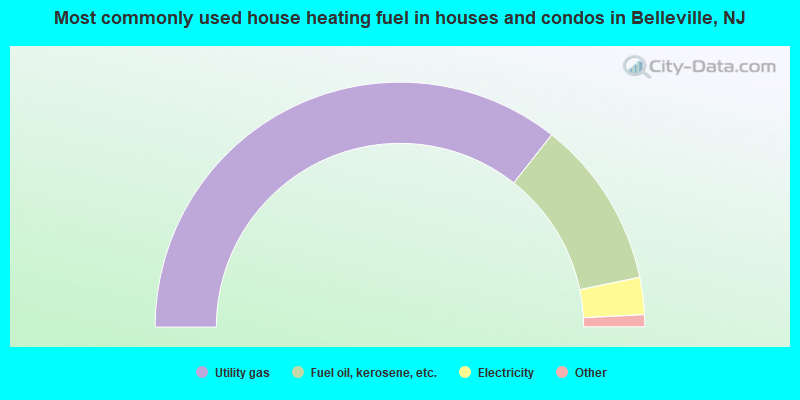
- 71.3%Utility gas
- 22.2%Fuel oil, kerosene, etc.
- 4.9%Electricity
- 1.2%Bottled, tank, or LP gas
- 0.2%No fuel used
- 0.1%Coal or coke
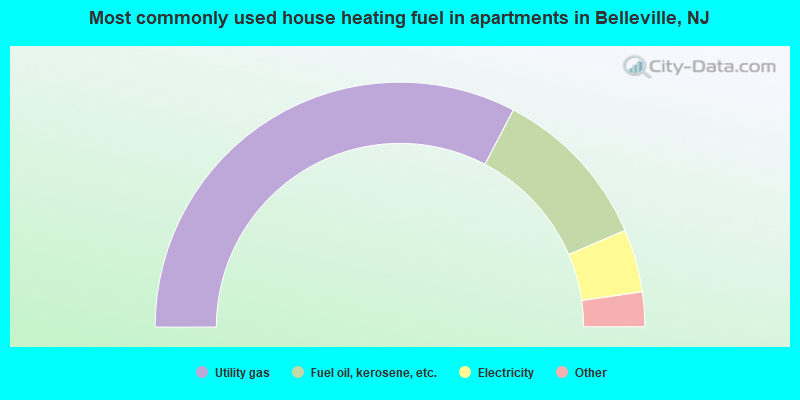
- 65.4%Utility gas
- 21.8%Fuel oil, kerosene, etc.
- 8.3%Electricity
- 2.9%Bottled, tank, or LP gas
- 1.0%No fuel used
- 0.3%Other fuel
- 0.2%Wood
- 0.1%Coal or coke
Private vs. public school enrollment:
| Here: | 15.5% |
| New Jersey: | 13.2% |
| Here: | 12.8% |
| New Jersey: | 13.0% |
| Here: | 29.9% |
| New Jersey: | 30.1% |


