Bay Point, CA (California) Houses and Residents
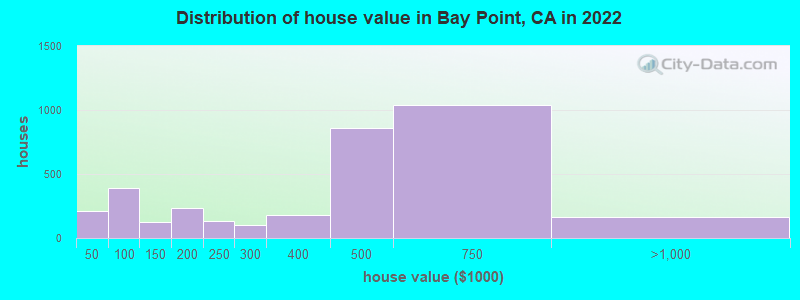
Estimated median house or condo value in 2022: $492,999 (it was $136,400 in 2000 )
Bay Point:
$492,999California:
$715,900
Lower value quartile - upper value quartile: $279,040 - $624,430Mean price in 2022: Detached houses: $535,361 Here:
$535,361State:
$988,808
Townhouses or other attached units: $480,130 Here:
$480,130State:
$838,546
Mobile homes: $155,983 Here:
$155,983State:
$184,506
Total population: 21,349 (Urban population: 21,089, Rural population: 326 (all nonfarm) )
Houses: 6,911 (6,697 occupied: 3,782 owner occupied, 2,928 renter occupied )
% of renters here:
44%State:
44%
Housing density: 744 houses/condos per square mile
Median price asked for vacant for-sale houses and condos in 2022: $3,793,706.
Median contract rent in 2022: $1,617 (lower quartile is $1,237, upper quartile is over $2,000)
Median rent asked for vacant for-rent units in 2022: $63,939
Median gross rent in Bay Point, CA in 2022: $1,829
Housing units in Bay Point with a mortgage: 2,279 (71 second mortgage, 0 home equity loan, 55 both second mortgage and home equity loan )Houses without a mortgage: 40
Median household income for houses/condos with a mortgage: $97,748
Median household income for apartments without a mortgage: $60,464
Median monthly housing costs: $1,668
Data:
Median house or condo value ($)
Median house or condo value ($ change since 2000)
Median house or condo value ($) - White
Median house or condo value ($) - Black or African American
Median house or condo value ($) - Asian
Median house or condo value ($) - Hispanic or Latino
Median house or condo value ($) - American Indian and Alaska Native
Median house or condo value ($) - Multirace
Median house or condo value ($) - Other Race
Median price asked for mobile homes ($)
Household density (households per square mile)
Mean house or condo value by units in structure - 1, detached ($)
Mean house or condo value by units in structure - 1, attached ($)
Mean house or condo value by units in structure - 2 ($)
Mean house or condo value by units in structure by units in structure - 3 or 4 ($)
Mean house or condo value by units in structure - 5 or more ($)
Mean house or condo value by units in structure - Boat, RV, van, etc. ($)
Mean house or condo value by units in structure - Mobile home ($)
Median contract rent ($)
Median contract rent - Lower quartile ($)
Median contract rent - Upper quartile ($)
Median gross rent ($)
Urban houses (%)
Rural houses (%)
Houses occupied (%)
Houses occupied (% change since 2000)
Houses owner occupied (%)
Houses owner occupied (% change since 2000)
Houses renter occupied (%)
Houses renter occupied (% change since 2000)
Vacant housing units - For rent (%)
Vacant housing units - For rent (% change since 2000)
Vacant housing units - For sale only (%)
Vacant housing units - For sale only (% change since 2000)
Vacant housing units - Rented or sold, not occupied (%)
Vacant housing units - Rented or sold, not occupied (% change since 2000)
Vacant housing units - For seasonal, recreational, or occasional use (%)
Vacant housing units - For seasonal, recreational, or occasional use (% change since 2000)
Vacant housing units - For migrant workers (%)
Vacant housing units - For migrant workers (% change since 2000)
Vacant housing units - Other vacant (%)
Vacant housing units - Other vacant (% change since 2000)
Median monthly housing costs ($)
Median household income for houses/condos with a mortgage ($)
Median household income for houses/condos without a mortgage ($)
Median household income ($)
Median household income ($) - White
Median household income ($) - Black or African American
Median household income ($) - Asian
Median household income ($) - Hispanic or Latino
Median household income ($) - American Indian and Alaska Native
Median household income ($) - Multirace
Median household income ($) - Other Race
Mortgage status - with mortgage (%)
Mortgage status - with second mortgage (%)
Mortgage status - with home equity loan (%)
Mortgage status - with both second mortgage and home equity loan (%)
Mortgage status - without a mortgage (%)
Median year house/condo built
Median year apartment built
Household type by relationship - Male householder living alone (%)
Household type by relationship - Male householder not living alone (%)
Household type by relationship - Female householder living alone (%)
Household type by relationship - Female householder not living alone (%)
Household type by relationship - Opposite-Sex spouse (%)
Household type by relationship - Same-Sex spouse (%)
Household type by relationship - Opposite-Sex unmarried partner (%)
Household type by relationship - Same-Sex unmarried partner (%)
Household type by relationship - In group quarters (%)
Size of family households - 2-person household (%)
Size of family households - 3-person household (%)
Size of family households - 4-person household (%)
Size of family households - 5-person household (%)
Size of family households - 6-person household (%)
Size of family households - 7-or-more-person household (%)
Size of nonfamily households - 1-person household (%)
Size of nonfamily households - 2-person household (%)
Size of nonfamily households - 3-person household (%)
Size of nonfamily households - 4-person household (%)
Size of nonfamily households - 5-person household (%)
Size of nonfamily households - 6-person household (%)
Size of nonfamily households - 7-or-moreperson household (%)
Year house built - Built 2010 or later (%)
Year house built - Built 2000 to 2009 (%)
Year house built - Built 1990 to 1999 (%)
Year house built - Built 1980 to 1989 (%)
Year house built - Built 1970 to 1979 (%)
Year house built - Built 1960 to 1969 (%)
Year house built - Built 1950 to 1959 (%)
Year house built - Built 1940 to 1949 (%)
Year house built - Built 1939 or earlier (%)
Median number of rooms in houses and condos
Median number of rooms in apartments
Median number of bedrooms in owner occupied houses
Mean number of bedrooms in owner occupied houses
Median number of bedrooms in renter occupied houses
Mean number of bedrooms in renter occupied houses
Median number of vehichles in owner occupied houses
Mean number of vehichles in owner occupied houses
Median number of vehichles in renter occupied houses
Mean number of vehichles in renter occupied houses
Rooms in owner-occupied houses - 1 room (%)
Rooms in owner-occupied houses - 2 rooms (%)
Rooms in owner-occupied houses - 3 rooms (%)
Rooms in owner-occupied houses - 4 rooms (%)
Rooms in owner-occupied houses - 5 rooms (%)
Rooms in owner-occupied houses - 6 rooms (%)
Rooms in owner-occupied houses - 7 rooms (%)
Rooms in owner-occupied houses - 8 rooms (%)
Rooms in owner-occupied houses - 9+ rooms (%)
Rooms in renter-occupied houses - 1 room (%)
Rooms in renter-occupied houses - 2 rooms (%)
Rooms in renter-occupied houses - 3 rooms (%)
Rooms in renter-occupied houses - 4 rooms (%)
Rooms in renter-occupied houses - 5 rooms (%)
Rooms in renter-occupied houses - 6 rooms (%)
Rooms in renter-occupied houses - 7 rooms (%)
Rooms in renter-occupied houses - 8 rooms (%)
Rooms in renter-occupied houses - 9+ rooms (%)
Bedrooms in owner-occupied houses - no bedrooms (%)
Bedrooms in owner-occupied houses - 1 bedroom (%)
Bedrooms in owner-occupied houses - 2 bedrooms (%)
Bedrooms in owner-occupied houses - 3 bedrooms (%)
Bedrooms in owner-occupied houses - 4 bedrooms (%)
Bedrooms in owner-occupied houses - 5+ bedrooms (%)
Bedrooms in renter-occupied houses - no bedrooms (%)
Bedrooms in renter-occupied houses - 1 bedroom (%)
Bedrooms in renter-occupied houses - 2 bedrooms (%)
Bedrooms in renter-occupied houses - 3 bedrooms (%)
Bedrooms in renter-occupied houses - 4 bedrooms (%)
Bedrooms in renter-occupied houses - 5+ bedrooms (%)
Vehicles available in owner-occupied houses - no vehicle available (%)
Vehicles available in owner-occupied houses - 1 vehicle available(%)
Vehicles available in owner-occupied houses - 2 Vehicles available (%)
Vehicles available in owner-occupied houses - 3 Vehicles available (%)
Vehicles available in owner-occupied houses - 4 Vehicles available (%)
Vehicles available in owner-occupied houses - 5+ Vehicles available (%)
Vehicles available in renter-occupied houses - no vehicle available (%)
Vehicles available in renter-occupied houses - 1 vehicle available (%)
Vehicles available in renter-occupied houses - 2 Vehicles available (%)
Vehicles available in renter-occupied houses - 3 Vehicles available (%)
Vehicles available in renter-occupied houses - 4 Vehicles available (%)
Vehicles available in renter-occupied houses - 5+ Vehicles available (%)
Housing units in structures - 1, detached (%)
Housing units in structures - 1, attached (%)
Housing units in structures - 2 (%)
Housing units in structures - 3 or 4 (%)
Housing units in structures - 5 to 9 (%)
Housing units in structures - 10 to 19 (%)
Housing units in structures - 20 to 49 (%)
Housing units in structures - 50 or more (%)
Housing units in structures - Mobile home (%)
Housing units in structures - Boat, RV, van, etc. (%)
Housing units in structures - Owners - 1, detached (%)
Housing units in structures - Owners - 1, attached (%)
Housing units in structures - Owners - 2 (%)
Housing units in structures - Owners - 3 or 4 (%)
Housing units in structures - Owners - 5 to 9 (%)
Housing units in structures - Owners - 10 to 19 (%)
Housing units in structures - Owners - 20 to 49 (%)
Housing units in structures - Owners - 50 or more (%)
Housing units in structures - Owners - Mobile home (%)
Housing units in structures - Owners - Boat, RV, van, etc. (%)
Housing units in structures - Renters - 1, detached (%)
Housing units in structures - Renters - 1, attached (%)
Housing units in structures - Renters - 2 (%)
Housing units in structures - Renters - 3 or 4 (%)
Housing units in structures - Renters - 5 to 9 (%)
Housing units in structures - Renters - 10 to 19 (%)
Housing units in structures - Renters - 20 to 49 (%)
Housing units in structures - Renters - 50 or more (%)
Housing units in structures - Renters - Mobile home (%)
Housing units in structures - Renters - Boat, RV, van, etc. (%)
House/condo owner moved in on average (years ago)
Renter moved in on average (years ago)
Year householder moved into unit - Moved in 1999 to March 2000 (%)
Year householder moved into unit - Moved in 1999 to March 2000 (%) - White
Year householder moved into unit - Moved in 1999 to March 2000 (%) - Black or African American
Year householder moved into unit - Moved in 1999 to March 2000 (%) - Asian
Year householder moved into unit - Moved in 1999 to March 2000 (%) - Hispanic or Latino
Year householder moved into unit - Moved in 1999 to March 2000 (%) - American Indian and Alaska Native
Year householder moved into unit - Moved in 1999 to March 2000 (%) - Multirace
Year householder moved into unit - Moved in 1999 to March 2000 (%) - Other Race
Year householder moved into unit - Moved in 1995 to 1998 (%)
Year householder moved into unit - Moved in 1995 to 1998 (%) - White
Year householder moved into unit - Moved in 1995 to 1998 (%) - Black or African American
Year householder moved into unit - Moved in 1995 to 1998 (%) - Asian
Year householder moved into unit - Moved in 1995 to 1998 (%) - Hispanic or Latino
Year householder moved into unit - Moved in 1995 to 1998 (%) - American Indian and Alaska Native
Year householder moved into unit - Moved in 1995 to 1998 (%) - Multirace
Year householder moved into unit - Moved in 1995 to 1998 (%) - Other Race
Year householder moved into unit - Moved in 1990 to 1994 (%)
Year householder moved into unit - Moved in 1990 to 1994 (%) - White
Year householder moved into unit - Moved in 1990 to 1994 (%) - Black or African American
Year householder moved into unit - Moved in 1990 to 1994 (%) - Asian
Year householder moved into unit - Moved in 1990 to 1994 (%) - Hispanic or Latino
Year householder moved into unit - Moved in 1990 to 1994 (%) - American Indian and Alaska Native
Year householder moved into unit - Moved in 1990 to 1994 (%) - Multirace
Year householder moved into unit - Moved in 1990 to 1994 (%) - Other Race
Year householder moved into unit - Moved in 1980 to 1989 (%)
Year householder moved into unit - Moved in 1980 to 1989 (%) - White
Year householder moved into unit - Moved in 1980 to 1989 (%) - Black or African American
Year householder moved into unit - Moved in 1980 to 1989 (%) - Asian
Year householder moved into unit - Moved in 1980 to 1989 (%) - Hispanic or Latino
Year householder moved into unit - Moved in 1980 to 1989 (%) - American Indian and Alaska Native
Year householder moved into unit - Moved in 1980 to 1989 (%) - Multirace
Year householder moved into unit - Moved in 1980 to 1989 (%) - Other Race
Year householder moved into unit - Moved in 1970 to 1979 (%)
Year householder moved into unit - Moved in 1970 to 1979 (%) - White
Year householder moved into unit - Moved in 1970 to 1979 (%) - Black or African American
Year householder moved into unit - Moved in 1970 to 1979 (%) - Asian
Year householder moved into unit - Moved in 1970 to 1979 (%) - Hispanic or Latino
Year householder moved into unit - Moved in 1970 to 1979 (%) - American Indian and Alaska Native
Year householder moved into unit - Moved in 1970 to 1979 (%) - Multirace
Year householder moved into unit - Moved in 1970 to 1979 (%) - Other Race
Year householder moved into unit - Moved in 1969 or earlier (%)
Year householder moved into unit - Moved in 1969 or earlier (%) - White
Year householder moved into unit - Moved in 1969 or earlier (%) - Black or African American
Year householder moved into unit - Moved in 1969 or earlier (%) - Asian
Year householder moved into unit - Moved in 1969 or earlier (%) - Hispanic or Latino
Year householder moved into unit - Moved in 1969 or earlier (%) - American Indian and Alaska Native
Year householder moved into unit - Moved in 1969 or earlier (%) - Multirace
Year householder moved into unit - Moved in 1969 or earlier (%) - Other Race
Housing units lacking complete plumbing facilities (%)
Housing units lacking complete kitchen facilities (%)
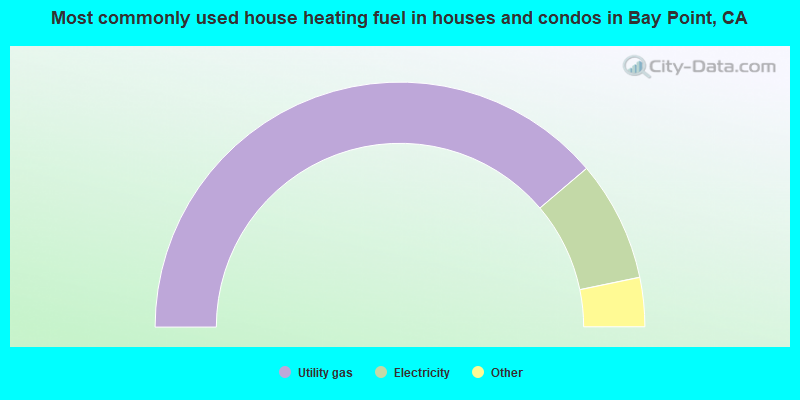
House heating fuel used in houses and condos - Utility gas (%)
House heating fuel used in houses and condos - Bottled, tank, or LP gas (%)
House heating fuel used in houses and condos - Electricity (%)
House heating fuel used in houses and condos - Fuel oil, kerosene, etc. (%)
House heating fuel used in houses and condos - Coal or coke (%)
House heating fuel used in houses and condos - Wood (%)
House heating fuel used in houses and condos - Solar energy (%)
House heating fuel used in houses and condos - Other fuel (%)
House heating fuel used in houses and condos - No fuel used (%)
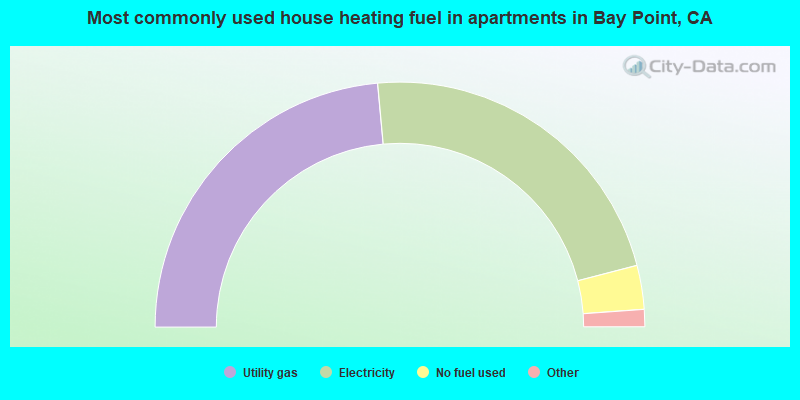
House heating fuel used in apartments - Utility gas (%)
House heating fuel used in apartments - Bottled, tank, or LP gas (%)
House heating fuel used in apartments - Electricity (%)
House heating fuel used in apartments - Fuel oil, kerosene, etc. (%)
House heating fuel used in apartments - Coal or coke (%)
House heating fuel used in apartments - Wood (%)
House heating fuel used in apartments - Solar energy (%)
House heating fuel used in apartments - Other fuel (%)
House heating fuel used in apartments - No fuel used (%)
Median year house/condo built: 1978Median year apartment built: 1983Household type by relationship:
Households: 24,287
Male householders: 3,483 (427 living alone ), Female householders: 3,087 (417 living alone )3,323 spouses (3,287 opposite-sex spouses ), 744 unmarried partners , (622 opposite-sex unmarried partners ), 8,654 children (8,181 natural , 128 adopted , 344 stepchildren ), 901 grandchildren , 564 brothers or sisters , 586 parents , 0 foster children , 1,674 other relatives , 1,219 non-relatives In group quarters: 47
Size of family households: 1,163 2-persons , 1,304 3-persons , 1,088 4-persons , 1,149 5-persons , 602 6-persons , 223 7-or-more-persons .
Size of nonfamily households: 855 1-person , 212 2-persons , 8 3-persons , 62 4-persons , 103 5-persons , 5 7-or-more-persons .
3,627 married couples with children. single-parent households (461 men , 824 women ).
33.4% of residents of Bay Point speak English at home. of residents speak Spanish at home (49% speak English very well , 26% speak English well , 17% speak English not well , 7% don't speak English at all ).of residents speak other Indo-European language at home (72% speak English very well , 13% speak English well , 14% speak English not well ).of residents speak Asian or Pacific Island language at home (45% speak English very well , 22% speak English well , 30% speak English not well , 3% don't speak English at all ).of residents speak other language at home (100% speak English very well ).
Foreign born population: 9,913 (40.8%)of them are naturalized citizens )
Median number of rooms in houses and condos:
Median number of rooms in apartments
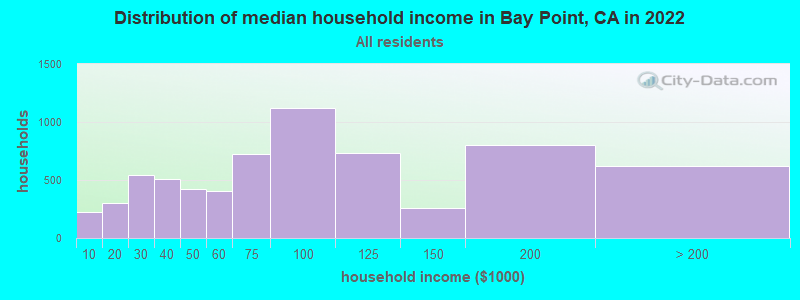
Bay Point, CA household income distribution 222 Less than $10,000304 $10,000 to $19,999541 $20,000 to $29,999505 $30,000 to $39,999422 $40,000 to $49,999409 $50,000 to $59,999728 $60,000 to $74,9991,119 $75,000 to $99,999733 $100,000 to $124,999261 $125,000 to $149,999800 $150,000 to $199,999620 $200,000 or more
Home value of owner - occupied houses in 2022 in Bay Point, CA 97 Less than $10,00043 $20,000 to $24,99925 $25,000 to $29,99917 $30,000 to $34,9991 $35,000 to $39,99923 $40,000 to $49,99921 $50,000 to $59,99916 $60,000 to $69,999108 $70,000 to $79,999221 $80,000 to $89,999121 $100,000 to $124,9996 $125,000 to $149,999227 $150,000 to $174,99910 $175,000 to $199,999135 $200,000 to $249,999102 $250,000 to $299,999179 $300,000 to $399,999860 $400,000 to $499,9991,037 $500,000 to $749,999149 $750,000 to $999,99915 $1,500,000 to $1,999,999Rent paid by renters in 2022 in Bay Point, CA 30 Less than $10026 $450 to $499116 $600 to $64920 $650 to $69913 $700 to $74941 $800 to $89925 $900 to $999461 $1,000 to $1,249322 $1,250 to $1,4991,044 $1,500 to $1,999470 $2,000 to $2,499159 $2,500 to $2,99972 $3,000 to $3,49982 No cash rent
Percentage of workers working in this county: 77.1%Number of people working at home: 592 (5.3% of all workers )
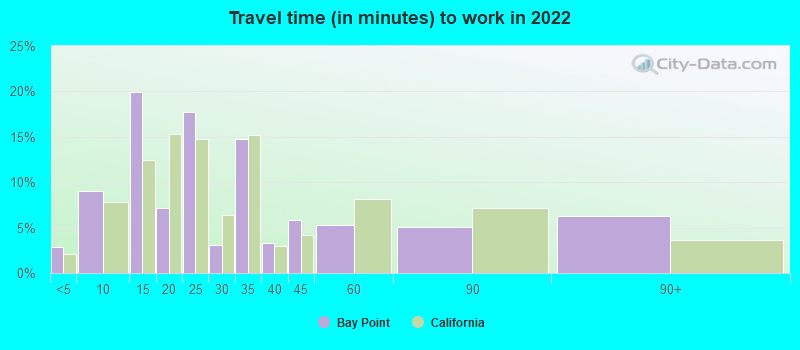
Travel time to work (commute)
Less than 5 minutes: 115 to 9 minutes: 34710 to 14 minutes: 87615 to 19 minutes: 1,19220 to 24 minutes: 1,50225 to 29 minutes: 37530 to 34 minutes: 1,90835 to 39 minutes: 30040 to 44 minutes: 56445 to 59 minutes: 1,22860 to 89 minutes: 1,20590 or more minutes: 606
Means of transportation to work:
Drove a car alone: 1,518 (62.5%)Carpooled: 164 (6.8%)Subway or elevated rail : 11 (0.5%)Ferryboat: 40 (1.6%)Taxi: 36 (1.5%)Walked: 41 (1.7%)Worked at home: 592 (24.4%)
Unemployment by race in 2022
Unemployment rate for White non-Hispanic residents 5.3% Males12.1% FemalesUnemployment rate for Black residents 3.7% Males3.0% FemalesUnemployment rate for American Indian and Alaska Native residents 100.0% MalesUnemployment rate for Asian residents 10.5% Males11.0% FemalesUnemployment rate for other race residents 6.1% Males14.7% FemalesUnemployment rate for two or more race residents 14.3% Males8.1% FemalesUnemployment rate for Hispanic or Latino residents 6.6% Males9.7% Females
Year of entry for the foreign-born population in Bay Point, California
2,264 2010 or later 2,897 2000 to 2009 2,407 1990 to 1999 2,450 1980 to 1989 1,030 1970 to 1979 425 Before 1970
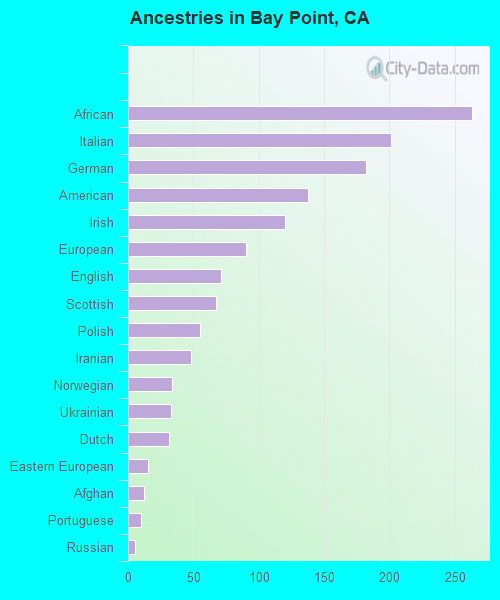
First ancestries reported:
African: 263 (1.5%)
Italian: 201 (1.2%)
German: 182 (1.1%)
American: 138 (0.8%)
Irish: 120 (0.7%)
European: 90 (0.5%)
English: 71 (0.4%)
Scottish: 67 (0.4%)
Polish: 55 (0.3%)
Iranian: 48 (0.3%)
Norwegian: 34 (0.2%)
Ukrainian: 33 (0.2%)
Dutch: 31 (0.2%)
Eastern European: 15 (0.09%)
Afghan: 12 (0.07%)
Portuguese: 10 (0.06%)
Russian: 5 (0.03%)
Northern European: 1 (0.01%) Most common places of birth for foreign-born residents (%): Mexico Bay Point:
61.0% (5,714)California:
37.2% (3,881,193)
El Salvador Bay Point:
8.7% (811)California:
4.2% (440,287)
Philippines Bay Point:
6.7% (632)California:
7.8% (818,297)
Vietnam Bay Point:
4.0% (372)California:
4.9% (512,335)
Peru Bay Point:
2.5% (237)California:
0.7% (74,025)
Guatemala Bay Point:
2.5% (236)California:
2.8% (290,436)
China, excluding Hong Kong and Taiwan Bay Point:
2.5% (235)California:
6.6% (684,672)
Nicaragua Bay Point:
1.9% (182)California:
0.6% (58,161)
Place of birth for U.S.-born residents:
This state: 12,400Other state: 1,948Northeast: 371Midwest: 472South: 710West: 381 91.4% of Bay Point residents lived in the same house 1 years ago.
Out of people who lived in different houses, 37.9% lived in this county.
Out of people who lived in different counties, 97.7% lived in California.
Bay Point:
91.4%State average:
88.9%
Education attainment for males 25 years and older:
No schooling: 421Nursery to 4th grade: 3625th and 6th grade: 5017th and 8th grade: 1329th grade: 27610th grade: 11911th grade: 5512th grade, no diploma: 531High school graduate (or equivalency): 2,696Less than 1 year of college: 439Some college more than 1 year, no degree: 809Associate degree: 681Bachelor's degree: 696Master's degree: 146Professional school degree: 32Doctorate degree: 75
Education attainment for females 25 years and older:
No schooling: 274Nursery to 4th grade: 1385th and 6th grade: 5337th and 8th grade: 1279th grade: 25410th grade: 9811th grade: 14012th grade, no diploma: 380High school graduate (or equivalency): 1,946Less than 1 year of college: 467Some college more than 1 year, no degree: 756Associate degree: 499Bachelor's degree: 1,039Master's degree: 272Professional school degree: 63Doctorate degree: 0
Housing units in structures:
One, detached: 4,562One, attached: 856Two: 123 or 4: 1565 to 9: 29810 to 19: 12220 to 49: 5750 or more: 76Mobile homes: 768Median worth of mobile homes: $128,432
Housing units lacking complete plumbing facilities in 2022: 0.2%Housing units lacking complete kitchen facilities in 2022: 1.5%House/condo owner moved in on average 11 years ago
Renter moved in on average 6 years ago
Private vs. public school enrollment:
Students in private schools in grades 1 to 8 (elementary and middle school): 296 Here:
9.5%California:
10.5%
Students in private schools in grades 9 to 12 (high school): 157 Here:
15.5%California:
8.5%
Students in private undergraduate colleges: 219 Here:
15.0%California:
15.9%